
Sample Category Title
EUR/JPY Daily Outlook
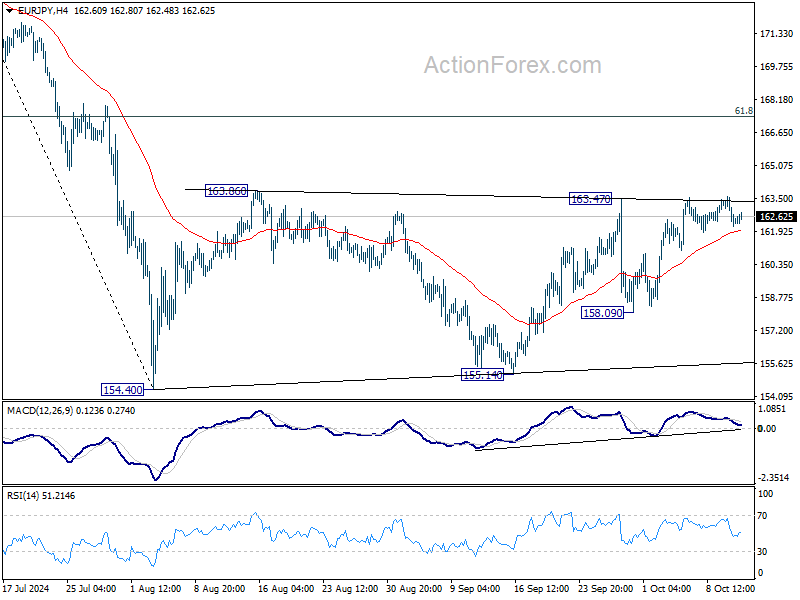
Daily Pivots: (S1) 161.92; (P) 162.76; (R1) 163.35; More....
Intraday bias in EUR/JPY remains neutral for the moment. On the upside, firm break of 163.47/86 resistance will resume the rebound from 154.40 to 61.8% retracement of 175.41 to 154.40 at 167.38. On the downside, break of 158.09 will bring deeper fall back to 154.40/155.14 support zone instead.
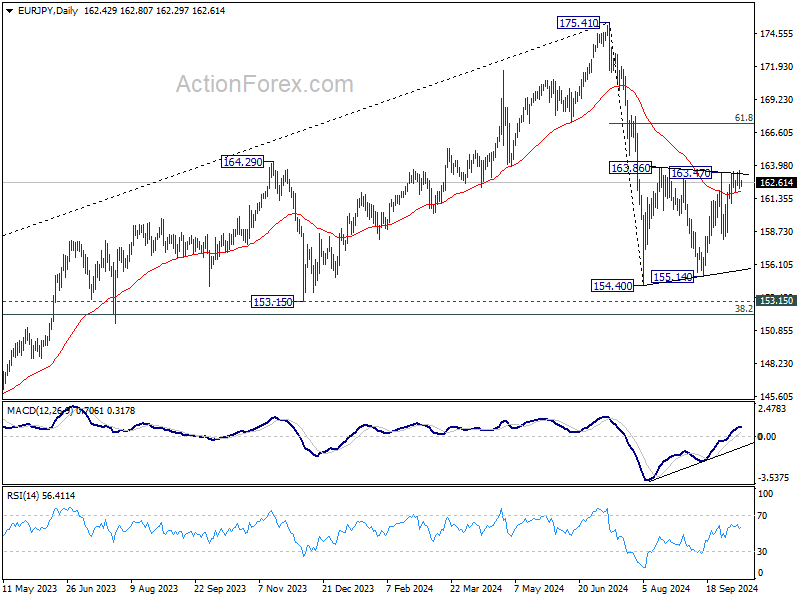
In the bigger picture, price actions from 175.41 are seen as correction to rally from 114.42 (2020 low). The range of consolidation should have been set between 38.2% retracement of 114.42 to 175.41 at 152.11 and 175.41 high. However, decisive break of 152.11 would argue that deeper correction is underway.
EUR/GBP Daily Outlook
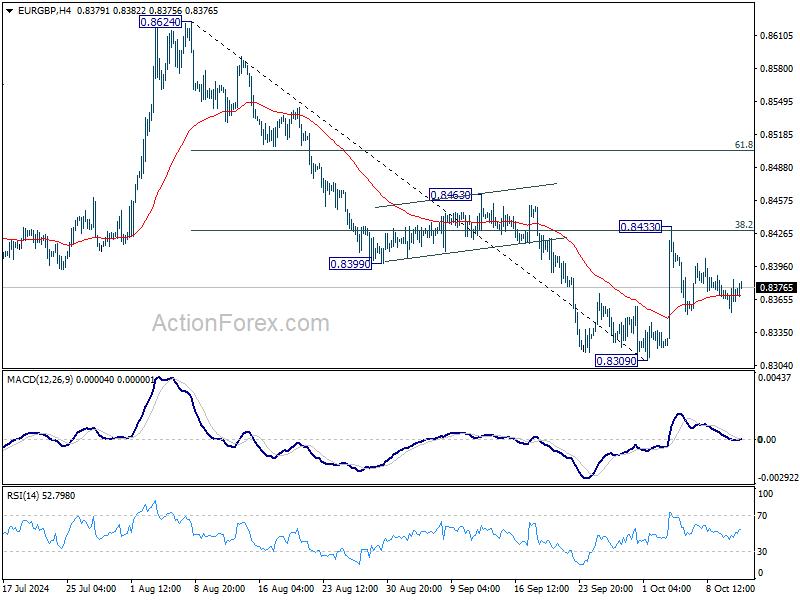
Daily Pivots: (S1) 0.8357; (P) 0.8371; (R1) 0.8389; More...
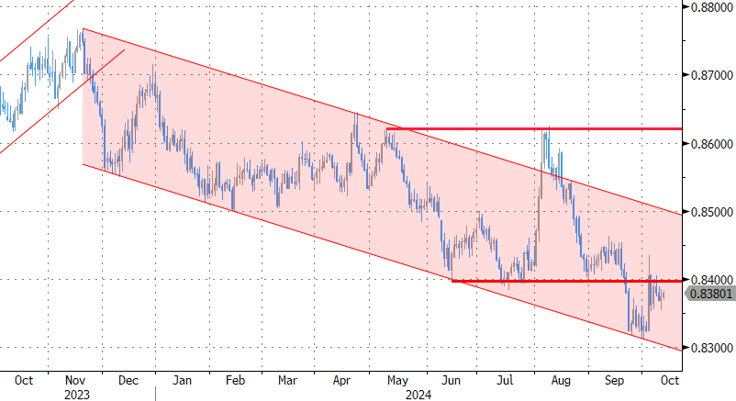
Intraday bias in EUR/GBP stays neutral at this point, and further decline is expected. On the downside, break of 0.8309 will resume larger down trend to 0.8201 key support next. However, decisive break of 38.2% retracement of 0.8624 to 0.8309 at 0.8429 will pave the way to 61.8% retracement at 0.8504 and possibly above.
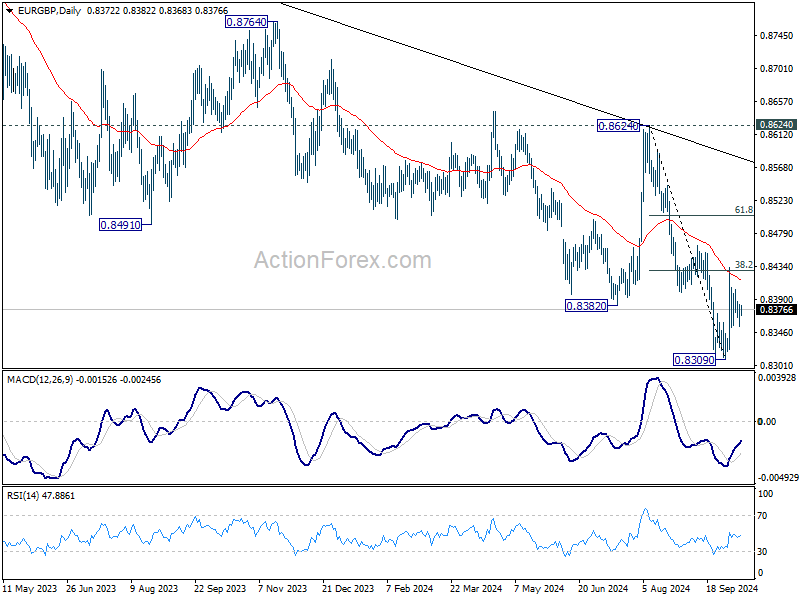
In the bigger picture, down trend from 0.9267 (2022 high) is in progress. Next target is 0.8201 (2022 low), but strong support should be seen there to bring rebound. However, outlook will remain bearish as long as 0.8624 resistance holds even in case of strong rebound.
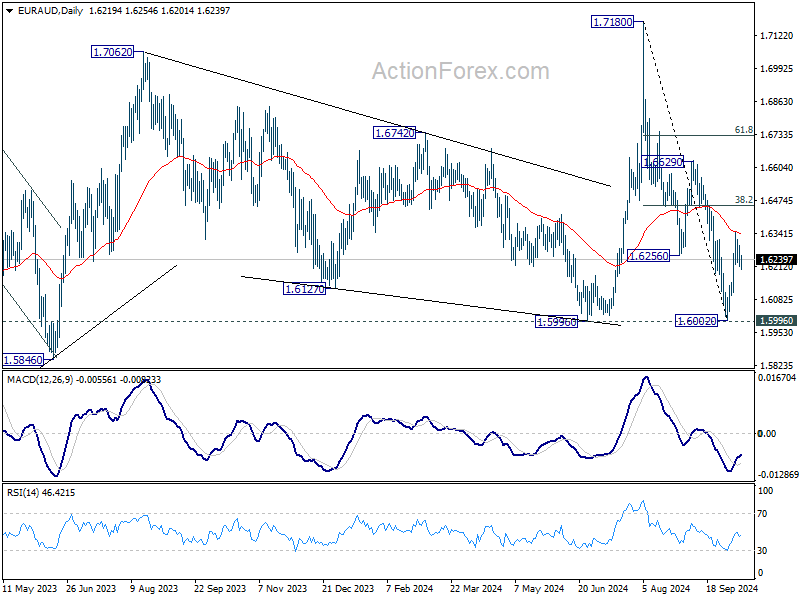
EUR/AUD Daily Outlook
Daily Pivots: (S1) 1.6194; (P) 1.6247; (R1) 1.6279; More...
Intraday bias in EUR/AUD stays neutral at this point. Another rise is in favor as long as 55 4H EMA (now at 1.6218) holds. Above 1.6351 will resume the rebound from 1.6002 short term bottom to 38.2% of 1.7180 to 1.6002 at 1.6452. Decisive break there will strengthen the case that whole corrective fall from 1.7180 has completed with three waves down to 1.6002. However, sustained break of 55 4H EMA will dampen this view and bring retest of 1.6002 low instead.
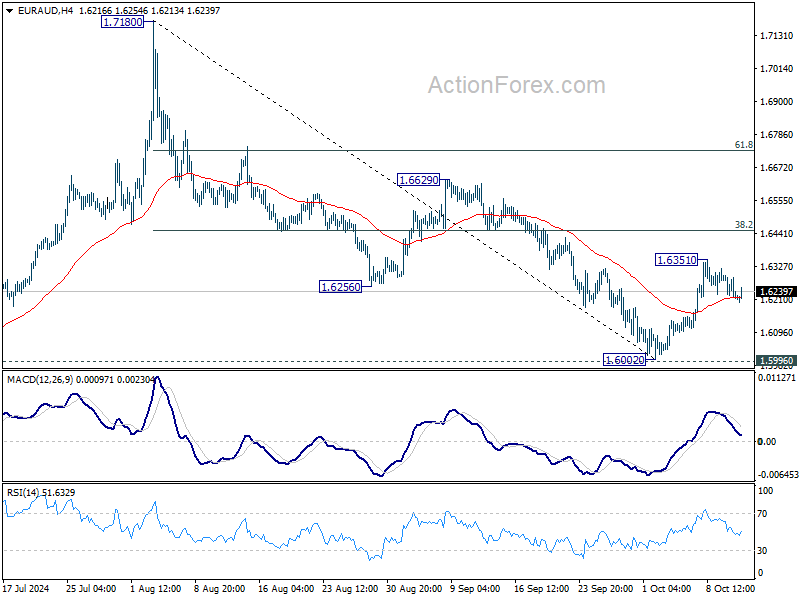
In the bigger picture, as long as 1.5996 support holds, up trend from 1.4281 (2022 low) is still expected to resume at a later stage. However, decisive break of 1.5996 will argue that the medium term trend has reversed and turn outlook bearish.
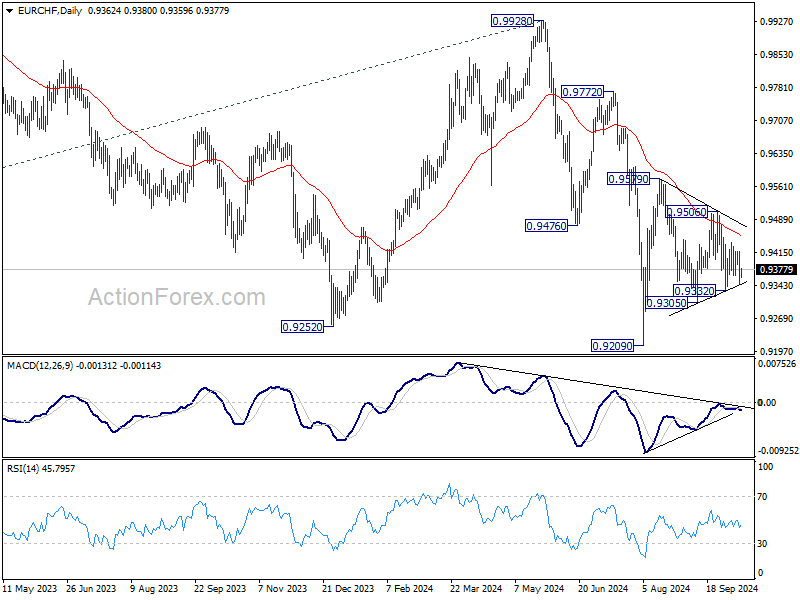
EUR/CHF Daily Outlook
Daily Pivots: (S1) 0.9333; (P) 0.9377; (R1) 0.9408; More....
Intraday bias in EUR/CHF Remains neutral for the moment, as range trading continues. On the downside, break of 0.9332 will resume the fall from 0.9579 towards 0.9209 low. On the upside, break of 0.9506 will turn intraday bias to the upside for 0.9579 resistance and above.
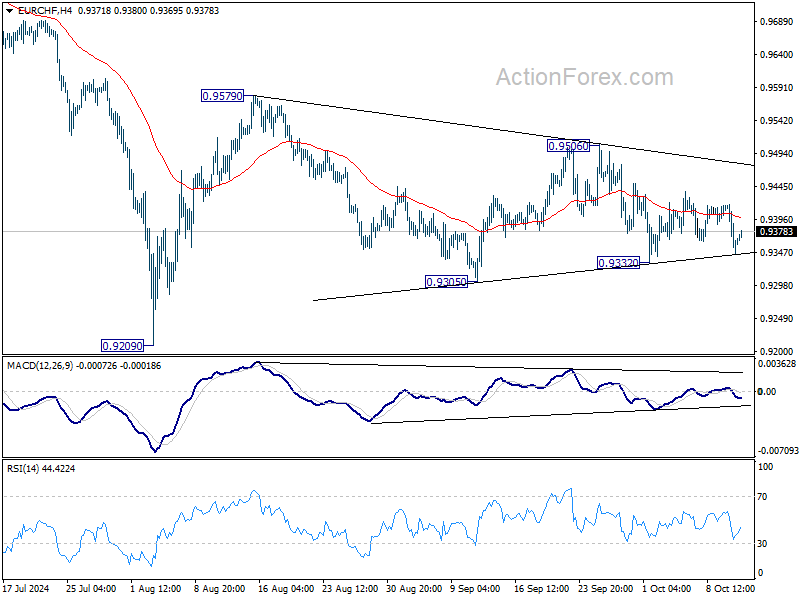
In the bigger picture, medium term corrective pattern from 0.9407 (2022 low) might have completed with three waves to 0.9928. Decisive break of 0.9252 (2023 low) will confirm long term down trend resumption. Next target will be 61.8% projection of 1.1149 to 0.9407 from 0.9928 at 0.8851. For now, outlook will stay bearish as long as 0.9928 resistance holds, even in case of strong rebound.
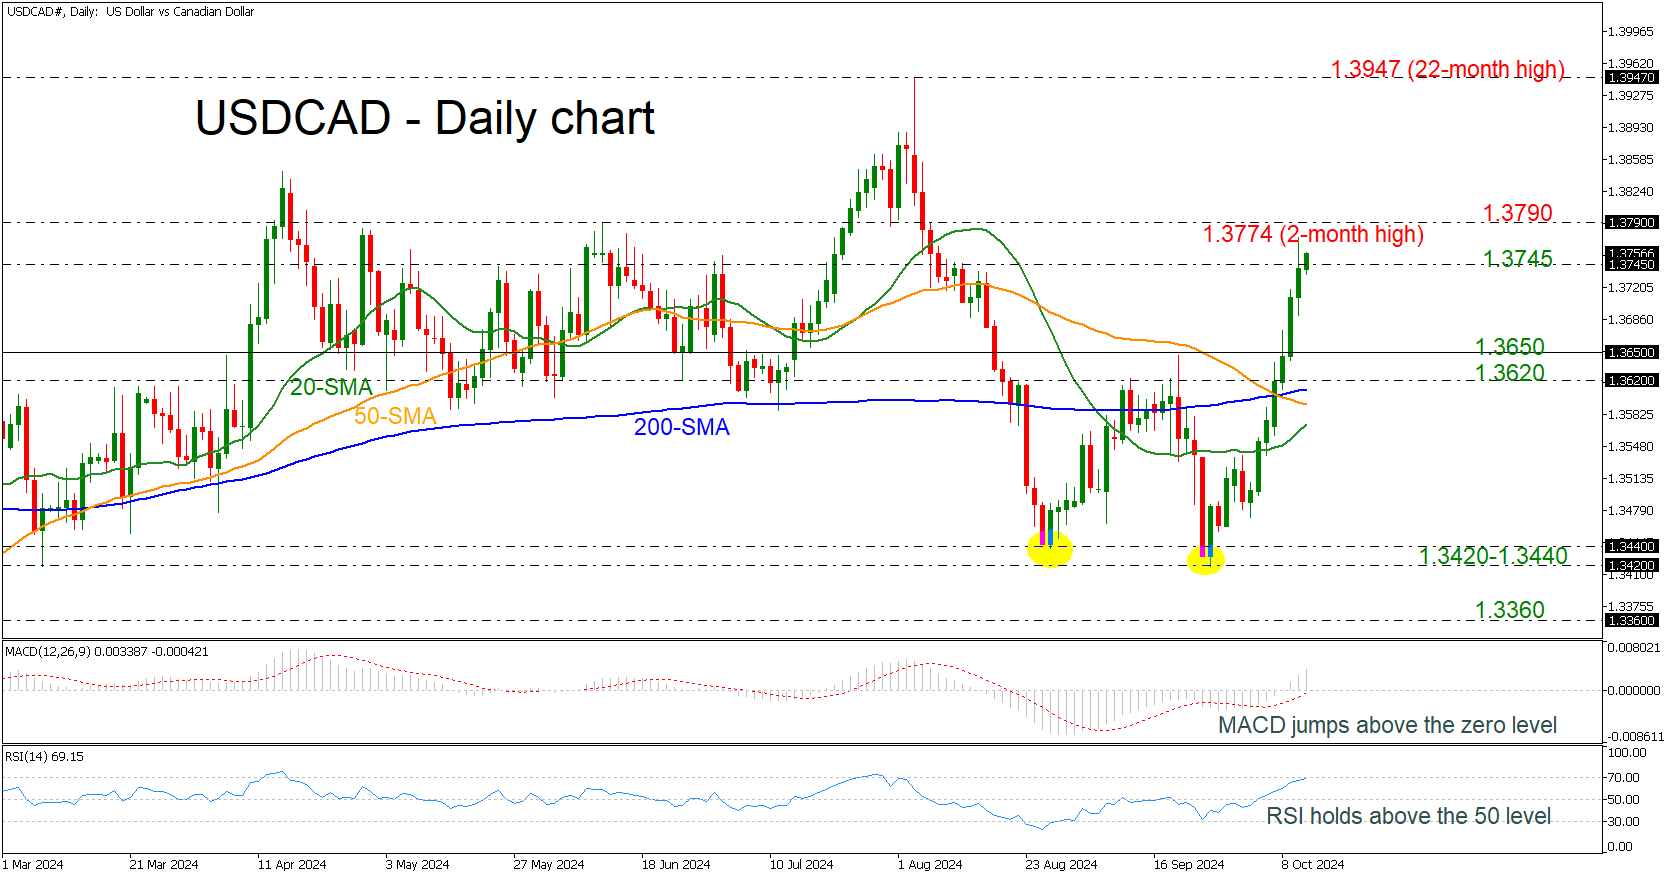
USDCAD Extends Its Bullish Rally to New 2-month High
- USDCAD completes 8 green days
- MACD and RSI indicate strong positive momentum
USDCAD skyrocketed to another fresh two-month high of 1.3774 during yesterday's session, adding more than 2.5% following the rebound from the double bottom pattern around 1.3420. The aggressive buying activity above the 1.3650 barrier, which served as a neckline, completed the latest formation.
Currently, the price is experiencing its eighth straight green day, with the technical oscillators showing more room for improvement in the market. The MACD is extending its positive momentum above its trigger and zero lines, while the RSI is ready to cross above the 70 level.
More upside pressure could open the door for the next inside swing low of 1.3790 before challenging the 22-month high of 1.3947.
Alternatively, a potential pullback to the downside could meet support at the 1.3650 and 1.3620 support lines. Marginally lower, the 200- and 50-day simple moving averages (SMAs) around the 1.3600 round number may pause the decline.
In summary, USDCAD is forming a significant bullish retracement, with an extension above 1.3790, indicating potential for a robust positive structure in the short-term outlook.
US Inflation Printed Hotter Than Expected and Contained Some Important Hawkish Details
Markets
US September inflation printed hotter than expected and contained some important hawkish details such as rising food prices and accelerating supercore services inflation (to an annualized 3mMA of around 4%). Several Fed officials including NY’s Williams, Chicago’s Goolsbee and Richmond’s Barkin were not too worried and focused on the broader picture in which inflation is moving in the right direction. Bostic was the odd one out. In an interview with the Wall Street Journal, the Atlanta Fed president said he was comfortable with skipping a meeting if the data say that’s appropriate. Coming shortly after a strong ISM, stellar payrolls and yesterday’s CPI, Bostic’s comments briefly sparked an uptick in yields and the dollar. The former finished lower nonetheless, unable to ignore the sharp jump in weekly jobless claims to the highest in more than a year (256k). North Carolina and Florida alone make more than 12k of the net 33k advance from the week before. Both states were hit by hurricane Helene. Net daily changes in US yields varied between -6.4 bps (2-yr) to +1.8 bps (30-yr). Underperformance of the long end was way more significant before an excellent 30-yr bond auction called off an intraday yield sprint of almost 7 bps (30-yr). The German yield curve’s shift was similar though much less sizeable (-2.7 bps to +0.6 bps). A fragile risk environment and proper gains in oil (Brent +3.7%) provided a cushion for the dollar. EUR/USD ended slightly lower (1.0934). DXY tested the 103 big figure for the first time since mid-August. Today’s economic calendar is a meagre one (Michigan consumer sentiment) and the US has a long weekend coming (Columbus Day on Monday). We don’t expect markets to move much in such an environment. The October US yield rally lost some steam, especially at the front where the 4% mark serves as a difficult-to-break resistance level. The dollar’s recent recovery may therefore ease a little as well. EUR/USD 1.0907 (50% retracement on the April-September EUR/USD rise) serves as first support. The financial start of the Q3 earnings season serves as a wildcard. We’d also mention a highly anticipated stimulus announcement of the Chinese finance minister tomorrow. It’s seen as a second chance after the country’s economic planning agency underwhelmed investors on Tuesday. Hopes this time around are for a massive CNY 2tn package.
News & Views
“The French economy is holding up, but our public debt is colossal. It would be both cynical and fatal not to see it, say it and recognize it.” And so French Finance Minister Armand yesterday evening unveiled a 2025 budget which delivered a combined €60.6bn in spending cuts (2/3) and tax hikes (1/3) which should reduce the deficit from 6.1% of GDP to 5% next year. The aim is to get below the 3% deficit threshold by 2029, two years after the official EU goal. The debt ratio is projected to hit 114.7 of GDP from 112.9% this year. The government uses 1.1% growth and 1.8% inflation in its calculations. In the proposal, spending cuts zoom in things like medical costs, unemployment and reducing the number of public servants. Temporary levies on large companies (revenue > €1bn) should raise around €12bn over the next two years. Company stock buybacks would be subject to an exceptional tax when the shares are canceled. A 20% tax rate floor will be introduced for individuals earning €250k annually or couples earning double the amount to counter tax shelter effects. A controversial measure is delaying the indexation of pensions until July 1. The budget bill will be discussed in parliament starting next week and needs to be adopted by the end 2024. The government’s lack of parliamentary majority makes it extremely vulnerable to obstructions and confidence votes.
The Bank of Korea lowered its policy rate a first time this morning, from 3.5% to 3.25%, after keeping it level since January 2023. The central bank expects inflation to stabilize at the 2% target level and growth to moderate further. Growth uncertainties increased though due to the delayed recovery in domestic demand. Regarding financial stability, housing prices in the Seoul area and household debt growth are anticipated to gradually slow due to the effects of tightened macroprudential policies. The Board will thoroughly assess the trade-offs among variables such as inflation, growth, and financial stability, and carefully determine the pace of further policy rate cuts. Five members want to keep rates steady over the next three months, with one in favor of keeping the door open for a cut. Governor Rhee’s view are not disclosed. The Korean won barely manages to gain ground this morning with USD/KRW holding near recent highs around 1350.
Graphs
GE 10y yield
The ECB cut policy rates by 25 bps in June and in September. Stubborn inflation (core, services) still is a source of concern, but very weak PMI’s and soft comments of Lagarde (and other MPC members) suggest the ECB is likely to step up the pace of easing with an October cut. Spill-overs from strong US data prevented a test of the 2.0% barrier. 2.00-2.35% might serve as a ST consolidation range.
US 10-y yield
The Fed kicked off its easing cycle with a 50 bps move. Powell and Co turning the focus from inflation to a potential slowdown in growth/employment made markets consider more 50 bps steps. Strong US September payrolls suggest the economy doesn’t need aggressive Fed support for now, but the debate might resurface as the economic cycle develops. For the US 10-y, 3.60% serves as strong support. The steepening trend is taking a breather.
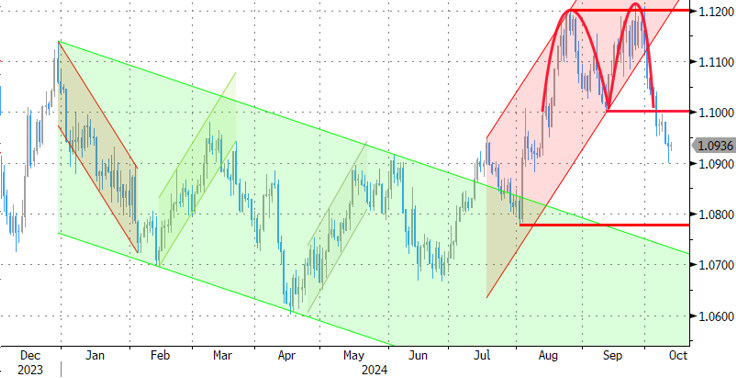
EUR/USD
EUR/USD twice tested the 1.12 big figure as the dollar lost interest rate support at stealth pace. Bets on fast and large rate cuts trumped traditional safe haven flows into USD. An ailing euro(pean economy) partially offset some of the general USD weakness. After solid early October US data, the dollar regained traction, with EUR/USD breaking the 1.1002 neckline. Targets of this pattern are near 1.08.
EUR/GBP
The BoE delivered a hawkish cut in August. Policy restrictiveness was indicated to be further unwound gradually. The economic picture between the UK and Europe also (temporarily?) diverged to the benefit of sterling, pulling EUR/GBP below 0.84 support. Dovish comments by BoE Bailey ended by default GBP-strength. Uncertainty on the UK budget to be released end this month is becoming an additional headwind for the UK currency.
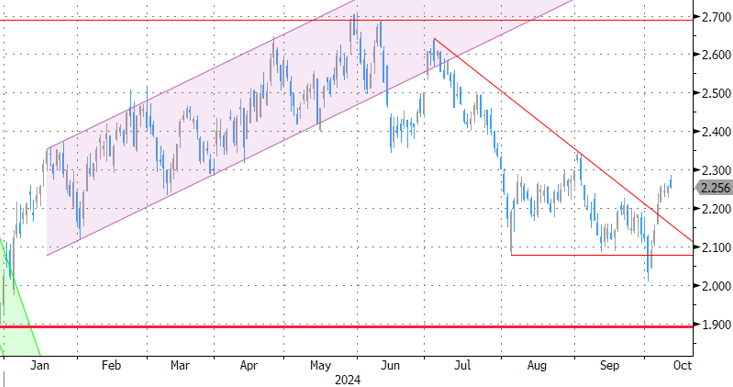
USD/CAD Daily Outlook
Daily Pivots: (S1) 1.3695; (P) 1.3735; (R1) 1.3782; More...
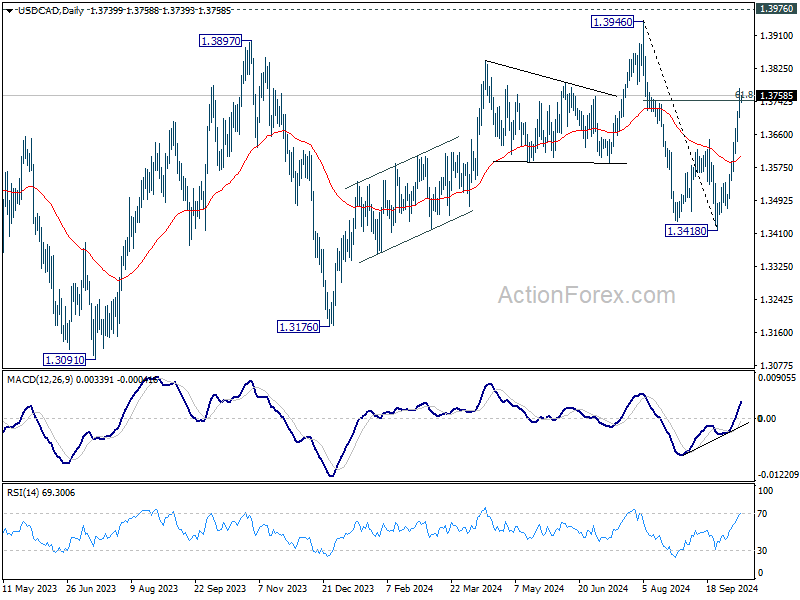
Intraday bias in USD/CAD remains on the upside as rise from 1.3418 is in progress. Sustained trading above 61.8% retracement of 1.3946 to 1.3418 at 1.3559 will target 1.3946 high again. On the downside, below 1.3702 minor support will turn intraday bias neutral first.
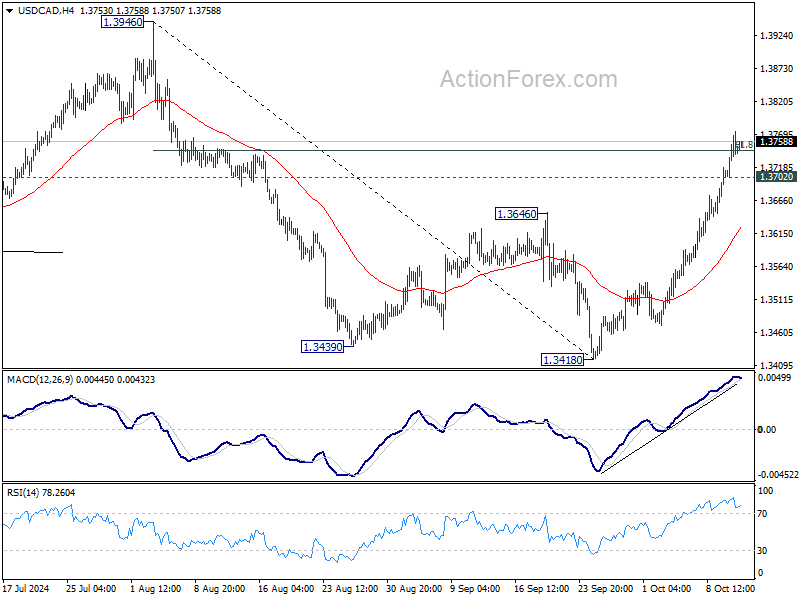
In the bigger picture, sideway consolidation pattern from 1.3976 (2022 high) might still extend further. While another decline cannot be ruled out, strong support should emerge above 1.2947 resistance turned support to bring rebound. Rise from 1.2005 (2021 low) is still in favor to resume at a later stage.
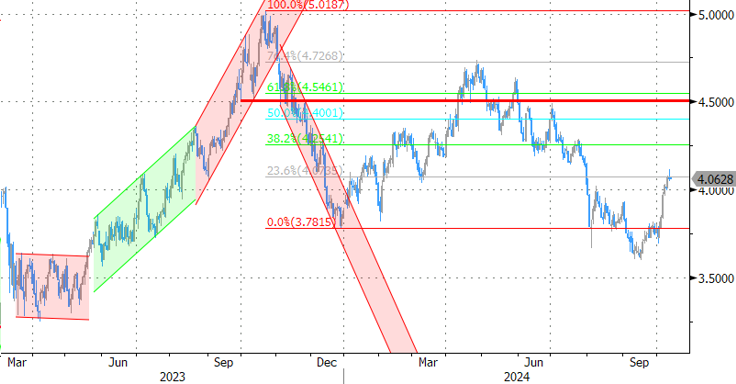
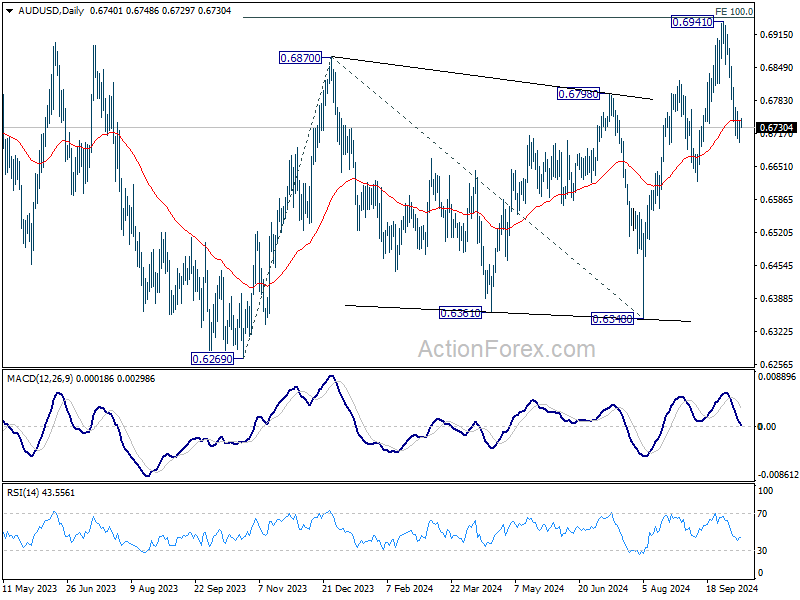
AUD/USD Daily Report
Daily Pivots: (S1) 0.6714; (P) 0.6728; (R1) 0.6755; More...
Intraday bias in AUD/USD remains neutral for the moment. Further decline is expected as long as 0.6809 minor resistance holds. Below 0.6701 will resume the fall from 0.6941 short term top. Sustained trading below 55 D EMA (now at 0.6744) should confirm rejection by 0.6941 fibonacci level, and bring deeper decline to 0.6621 support.
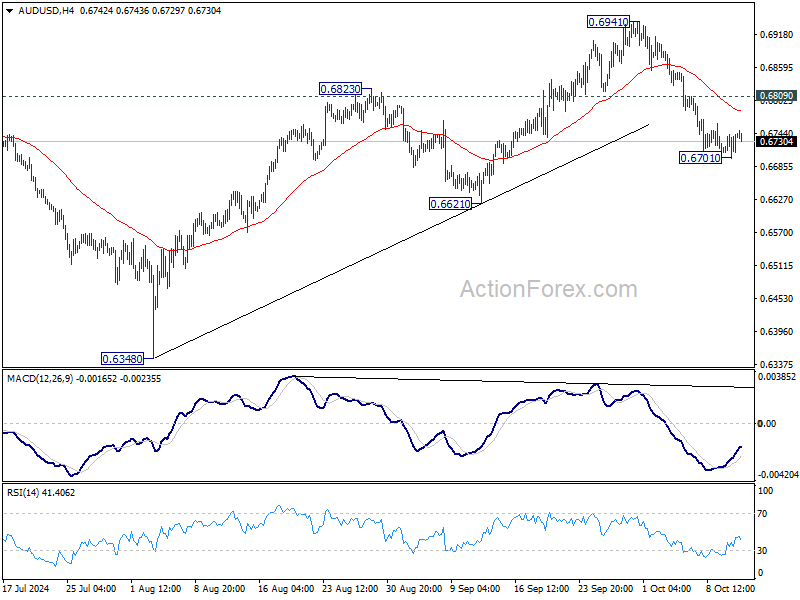
In the bigger picture, overall, price actions from 0.6169 (2022 low) are seen as a medium term corrective pattern, with rise from 0.6269 as the third leg. Firm break of 100% projection of 0.6269 to 0.6870 from 0.6340 at 0.6941 will target 138.2% projection at 0.7179. However, break of 0.6621 support will argue that rise from 0.6269 has completed and bring deeper fall back to 0.6269/6348 support zone.
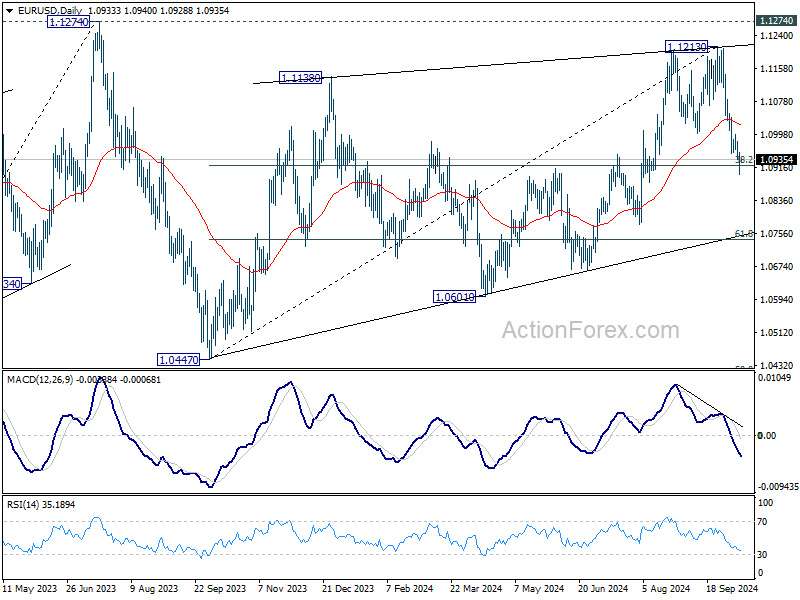
EUR/USD Daily Outlook
Daily Pivots: (S1) 1.0906; (P) 1.0931; (R1) 1.0961; More....
Intraday bias in EUR/USD remains on the downside. Sustained break of 38.2% retracement of 1.0447 to 1.1213 at 1.0920 will argue that fall from 1.1213 is the third leg of the corrective pattern from 1.1274. In this case, deeper decline would be seen to 61.8% retracement at 1.0740 next. On the upside, above 1.0996 minor resistance will turn intraday bias neutral again first.
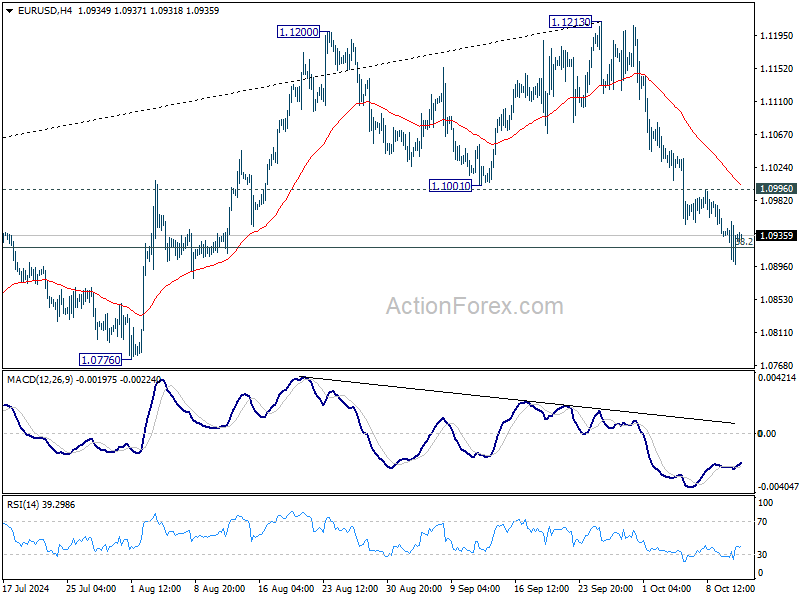
In the bigger picture, rejection by 1.1274 resistance suggests that corrective pattern from 1.1274 (2023 high) is not completed yet. Instead, decline from 1.1213 might be another falling leg. Sustained break of 55 W EMA (now at 1.0877) will validate this case, and bring deeper fall towards 1.0447 support again.
GBP/USD Daily Outlook
Daily Pivots: (S1) 1.3023; (P) 1.3058; (R1) 1.3095; More...
Intraday bias in GBP/USD stays neutral for the moment. While corrective fall from 1.3433 might extend lower, strong support should be seen from 1.3000 cluster support (38.2% retracement of 1.2298 to 1.3433 at 1.2999) to contained downside. Above 1.3174 minor resistance will turn bias back to the upside for stronger rebound. However, decisive break of 1.3000 will carry larger bearish implications.
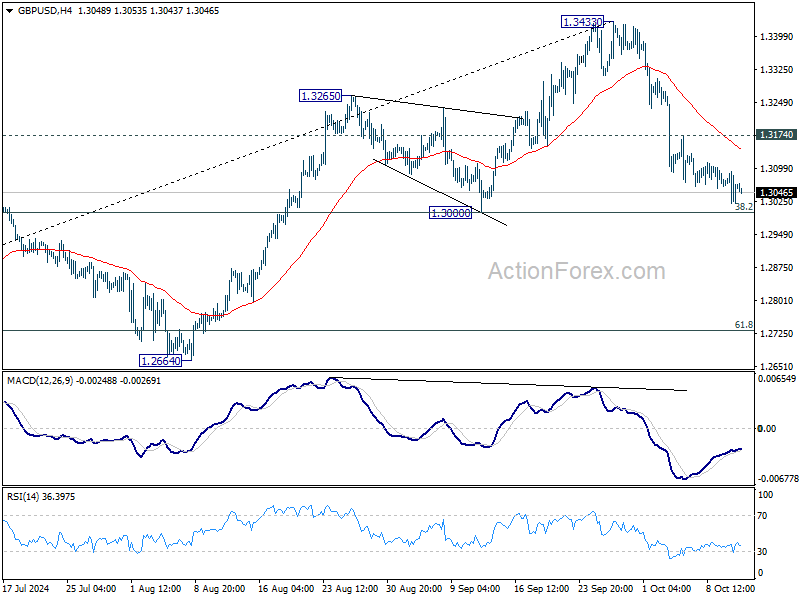
In the bigger picture, as long as 1.3000 support holds, the up trend from 1.0351 (2022 low) is still in progress. Next target is 61.8% projection of 1.0351 to 1.3141 from 1.2298 at 1.4022. However, considering mild bearish divergence condition in D MACD, decisive break of 1.3000 will argue that a medium term top is already in place, and bring deeper fall back to 1.2664 support next.
