
Sample Category Title
Cliff Notes: Shifting Views on the State of the Economy
Key insights from the week that was.
In Australia, there was finally a sigh of relief for consumers as October’s Westpac-MI Consumer Sentiment Survey reported a 6.2% increase in the headline index to 89.8, a two-and-a-half year high. The chief culprit behind this improvement was a significant pull-back in interest rate hike fears, as consumers take the cue from lower measured inflation and the broader global economic backdrop, which has seen many other peer economies begin to lower interest rates. This led consumers to have a much more positive view on the economy, with the sub-indexes tracking the 12mth and 5yr ahead view up 14.3% and 8.0% respectively in the month. Meanwhile, the progress on family finances remained relatively more subdued, highlighting the extent to which cost-of-living pressures have loomed over households. While pessimism still dominates overall, this marked one of the most constructive single-month reads since the RBA began raising interest rates.
This backdrop bodes relatively well for businesses too, given that both business and consumer confidence tend to move together over an economic cycle. On the conditions front, the latest NAB business survey also suggested that business conditions have found somewhat of a ‘floor’ over the course of this year. This is consistent with our view that economic activity is current around its nadir, having slowed to 1.0%yr in Q2 2024. In a context of recent tax cuts and monetary policy easing on the horizon, there is certainly scope for further improvement in sentiment and, hence, consumer spending. We are forecasting a recovery in growth hereafter to a pace of 1.5%yr by year-end and 2.4%yr in 2025. For more detail behind our view and forecasts, please see our latest Market Outlook published on WestpacIQ.
The RBA’s September Minutes provided another opportunity to digest the Board’s views on the balance of risks. There were two important developments on this front. Firstly, on the topic of the supply-demand balance, the RBA acknowledged that momentum in demand was weaker than initially expected. This, in effect, toned down some of their hawkishness on inflation from August, when the Board was telegraphing a more pessimistic view on supply potential. Secondly, there was a larger emphasis on assessments of financial conditions and the risk that they could turn out to be insufficiently restrictive to return inflation to target. We will continue to watch how the discussion of these points evolves over the coming months, but for now, the RBA’s focus is clearly squared on the dynamics around underlying inflation. We continue to expect the RBA to deliver its first rate cut in February 2025, before reaching a terminal rate of 3.35%. In this week’s essay, Chief Economist Luci Ellis details the longer-run trends guiding our thinking behind the global interest rate structure.
Offshore, the focus remained on US monetary policy.
Before jumping into this week's events, a quick note on the September non-farm payrolls print released late last week. Non-farm payrolls surprised to the upside rising 254k and exceeding the median market expectations of 150k. There was also an upward revision of 72k for the previous two months, attributed to a recalculation of seasonal factors. The unemployment rate inched down to 4.1%, 0.3ppt below the FOMC's forecast for Q4 2024. And the average hourly earnings rose by 0.4%mth with annual growth at 4.0%yr, up from 3.6% in July.
This week, minutes for the FOMC's September meeting were released. They showed that both 25 and 50bp cuts were on the table and the committee chose to go with the latter. Interestingly, several members argued that a 25bp cut was more consistent with a gradual path to easing as well as providing a degree of predictability. And the committee expressed concern about how the 50bp cut will be perceived with the minutes noting that “it was important to communicate that the recalibration of the stance of policy at this meeting should not be interpreted as evidence of a less favorable economic outlook or as a signal that the pace of policy easing would be more rapid than participants’ assessments of the appropriate path”. With regards to the FOMC’s assessment of the US economy, the labour market was perceived to be close to the long-run maximum employment, and less tight than prior to the pandemic. Risks of its further unwanted deterioration were assessed to have increased (this is before the release of the September jobs data). And the FOMC had greater confidence in inflation's return to 2.0% noting upside risk had 'diminished'.
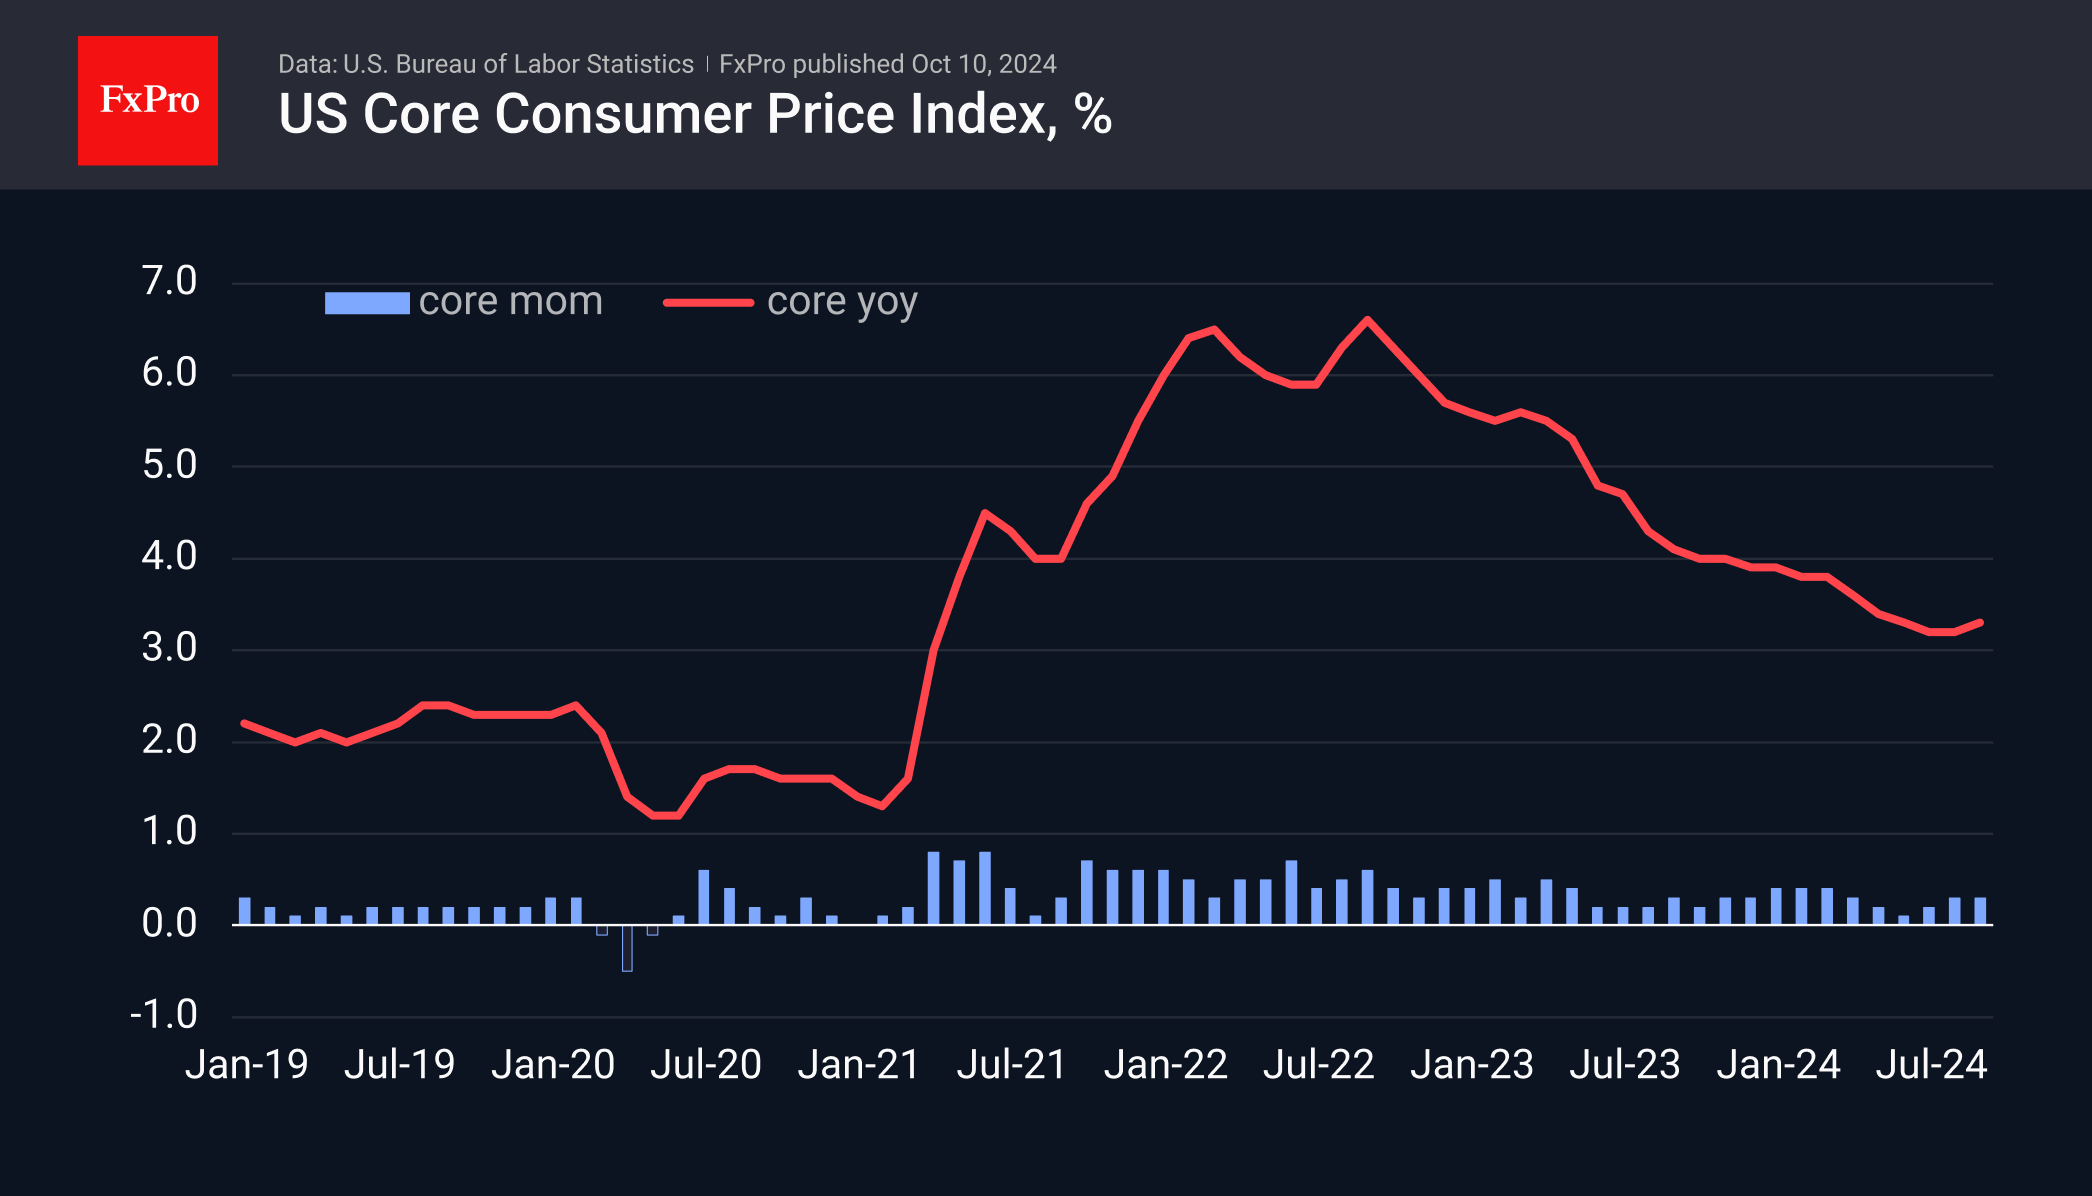
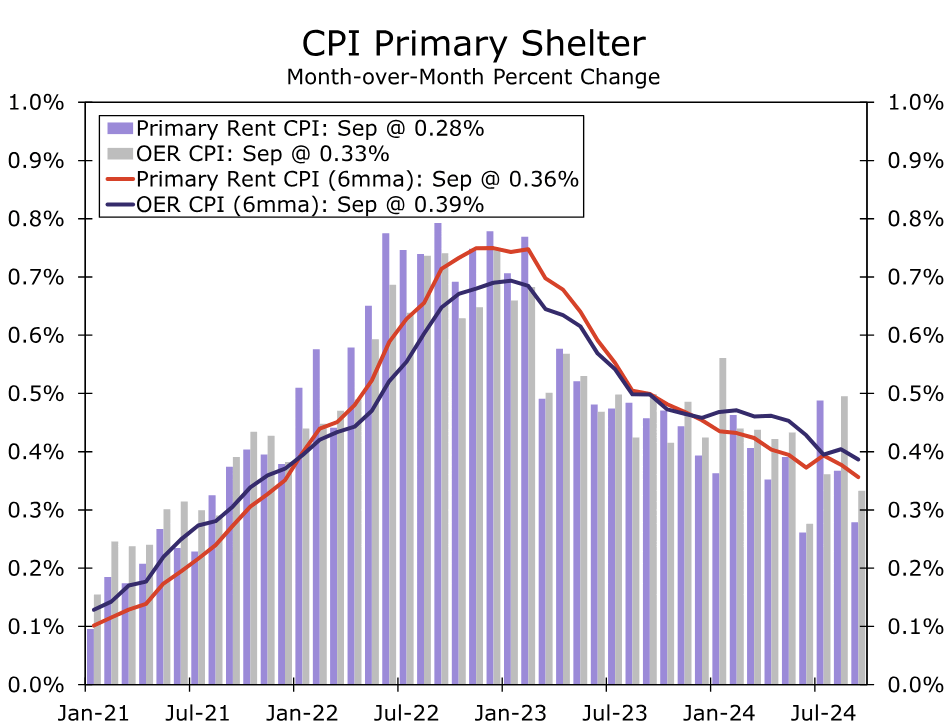
On the face of it, this week’s CPI data release for September was somewhat inconsistent with FOMC’s assessment, with both the headline and core CPIs rising slightly more than expected, by 0.2%mth and 0.3%mth respectively. Both rates were unchanged from August and fully in line with the averages over the last twelve months suggesting that inflationary pressures in the US remained stable last month. But details suggested that the upside surprise was accounted mainly by higher inflation in the core goods category and quite volatile items in it. The shelter component, one of the key drivers of headline inflation, showed that prices increased by 0.2%mth, half the average pace seen in 2024 so far. Ex-shelter, the annal CPI growth rate was just 1.1%yr. Subsequent comments from the FOMC members downplayed the importance of the September CPI print suggesting they are continuing to focus on the longer-term decline in inflation.
Closer to home, the Reserve Bank of New Zealand cut the overnight cash rate by 50bp to 4.75% in line with expectations. The move was driven by an assessment that the economy has excess capacity which should facilitate lower price and wage-setting behaviours. “Subdued” economic activity and employment conditions which continue to “soften” were credited to the still-restrictive monetary policy stance. Westpac expects another 50bp cut to come in November and for the policy rate to fall to a low of 3.75% in 2025.
US Data: Stubborn Inflation vs Jobs Warning Bell
US inflation came in slightly above expectations, but a jump in weekly jobless claims shifted the focus to the need for further policy easing, dampening speculation that the Fed may not cut rates in November.
Consumer prices rose 0.2% m/m in September, the same as the previous month, while annual inflation slowed from 2.5% to 2.4%, above expectations of 2.3%. Housing and food were important drivers, accounting for three-quarters of the total price increase.
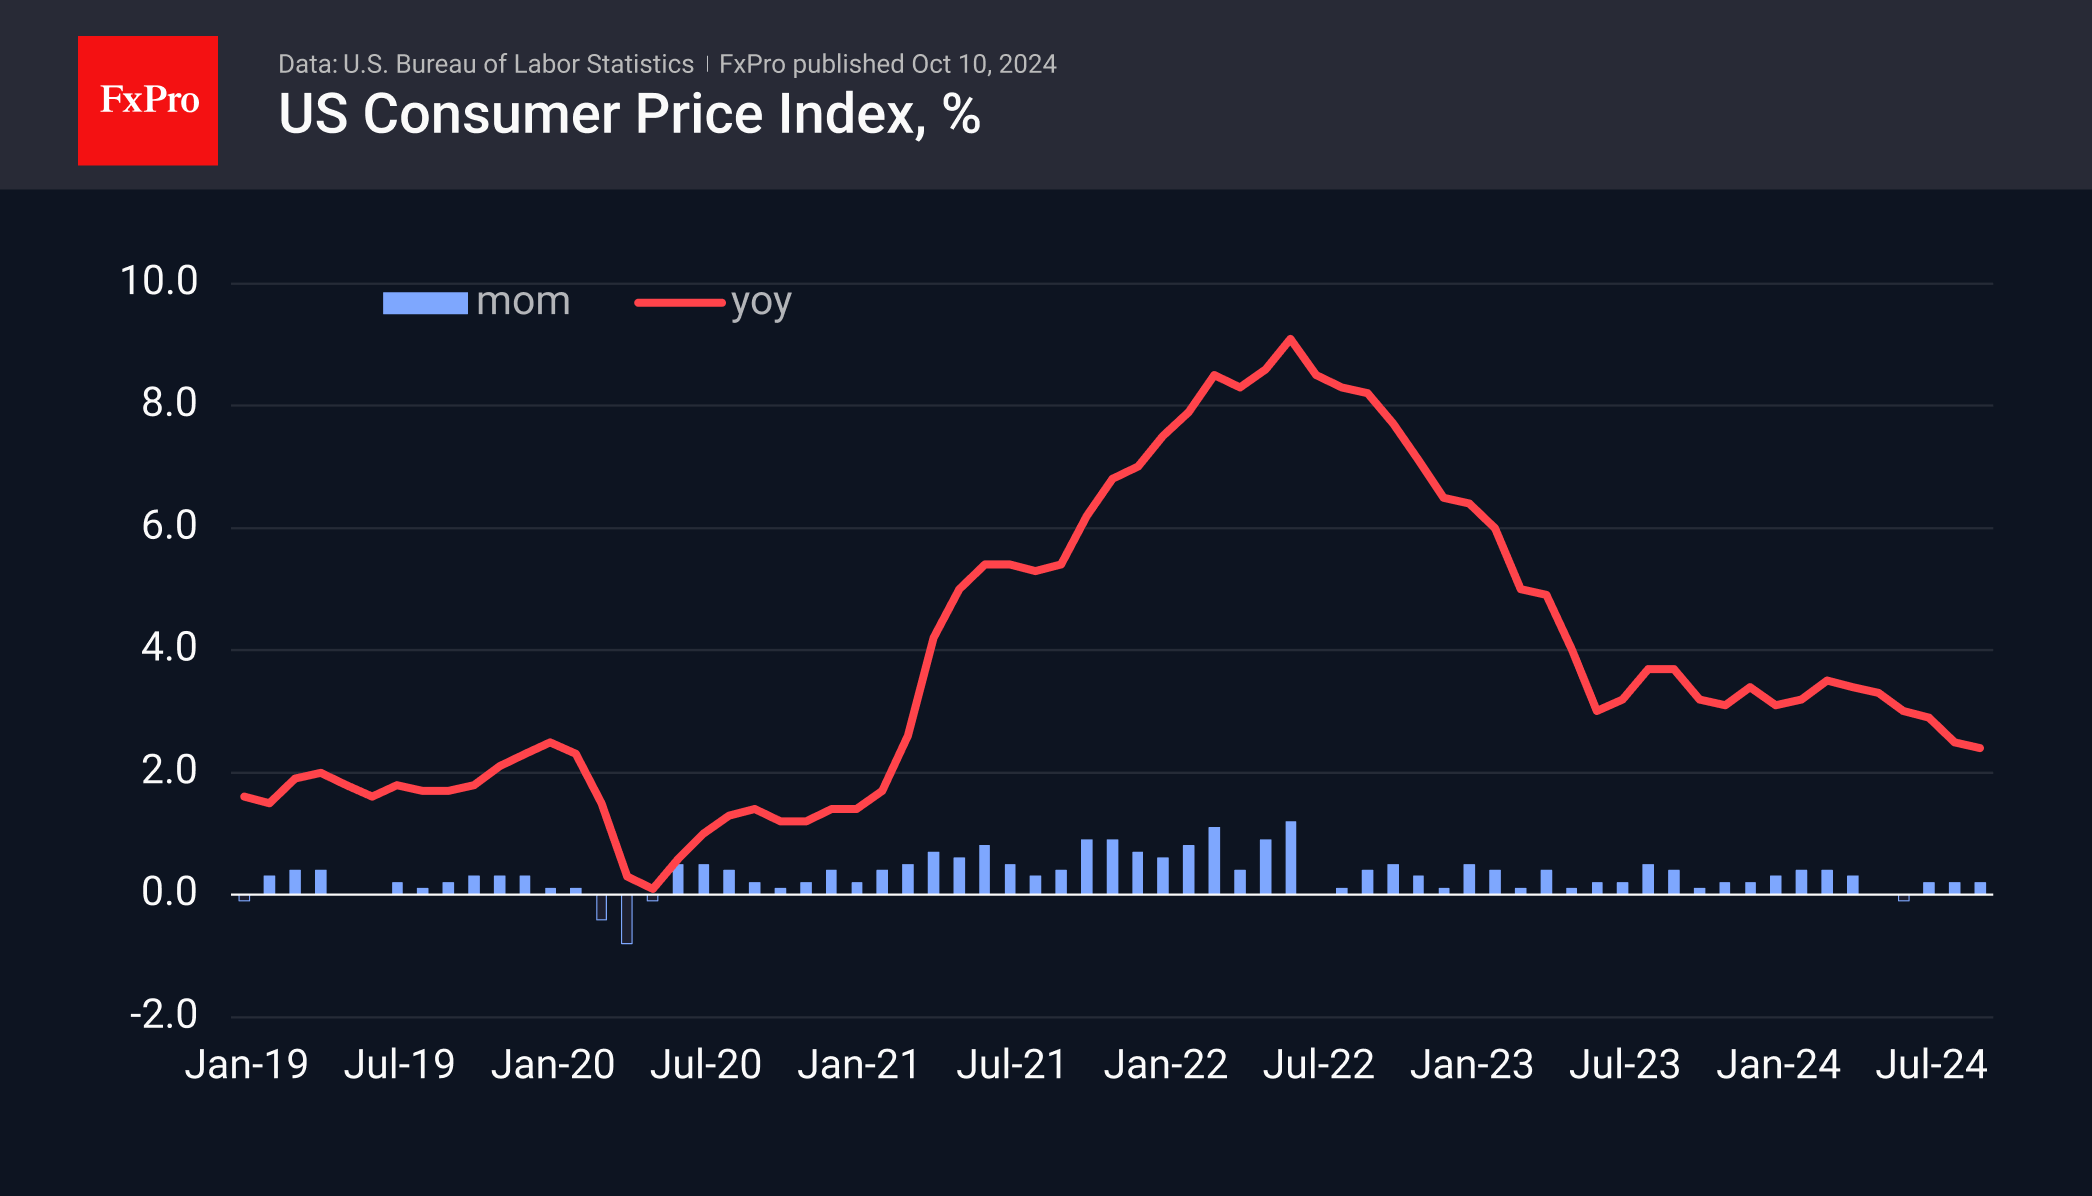
The core index, which excludes energy and food prices, accelerated its annual growth rate from 3.2% to 3.3%, the first acceleration in a year and a half. This proves that slowing inflation is no easy task in the context of full employment and is mediated by low oil and fuel prices.
The impact of accelerating core inflation—usually a bullish factor for the dollar—was overwhelmed this time by an unexpected jump in jobless claims last week. Initial claims were reported to have risen to 258K from 225K the previous week and an expected 231 K. The current level is the highest since last August and the fourth highest in almost three years as the US labour market recovered from the shutdown shock.
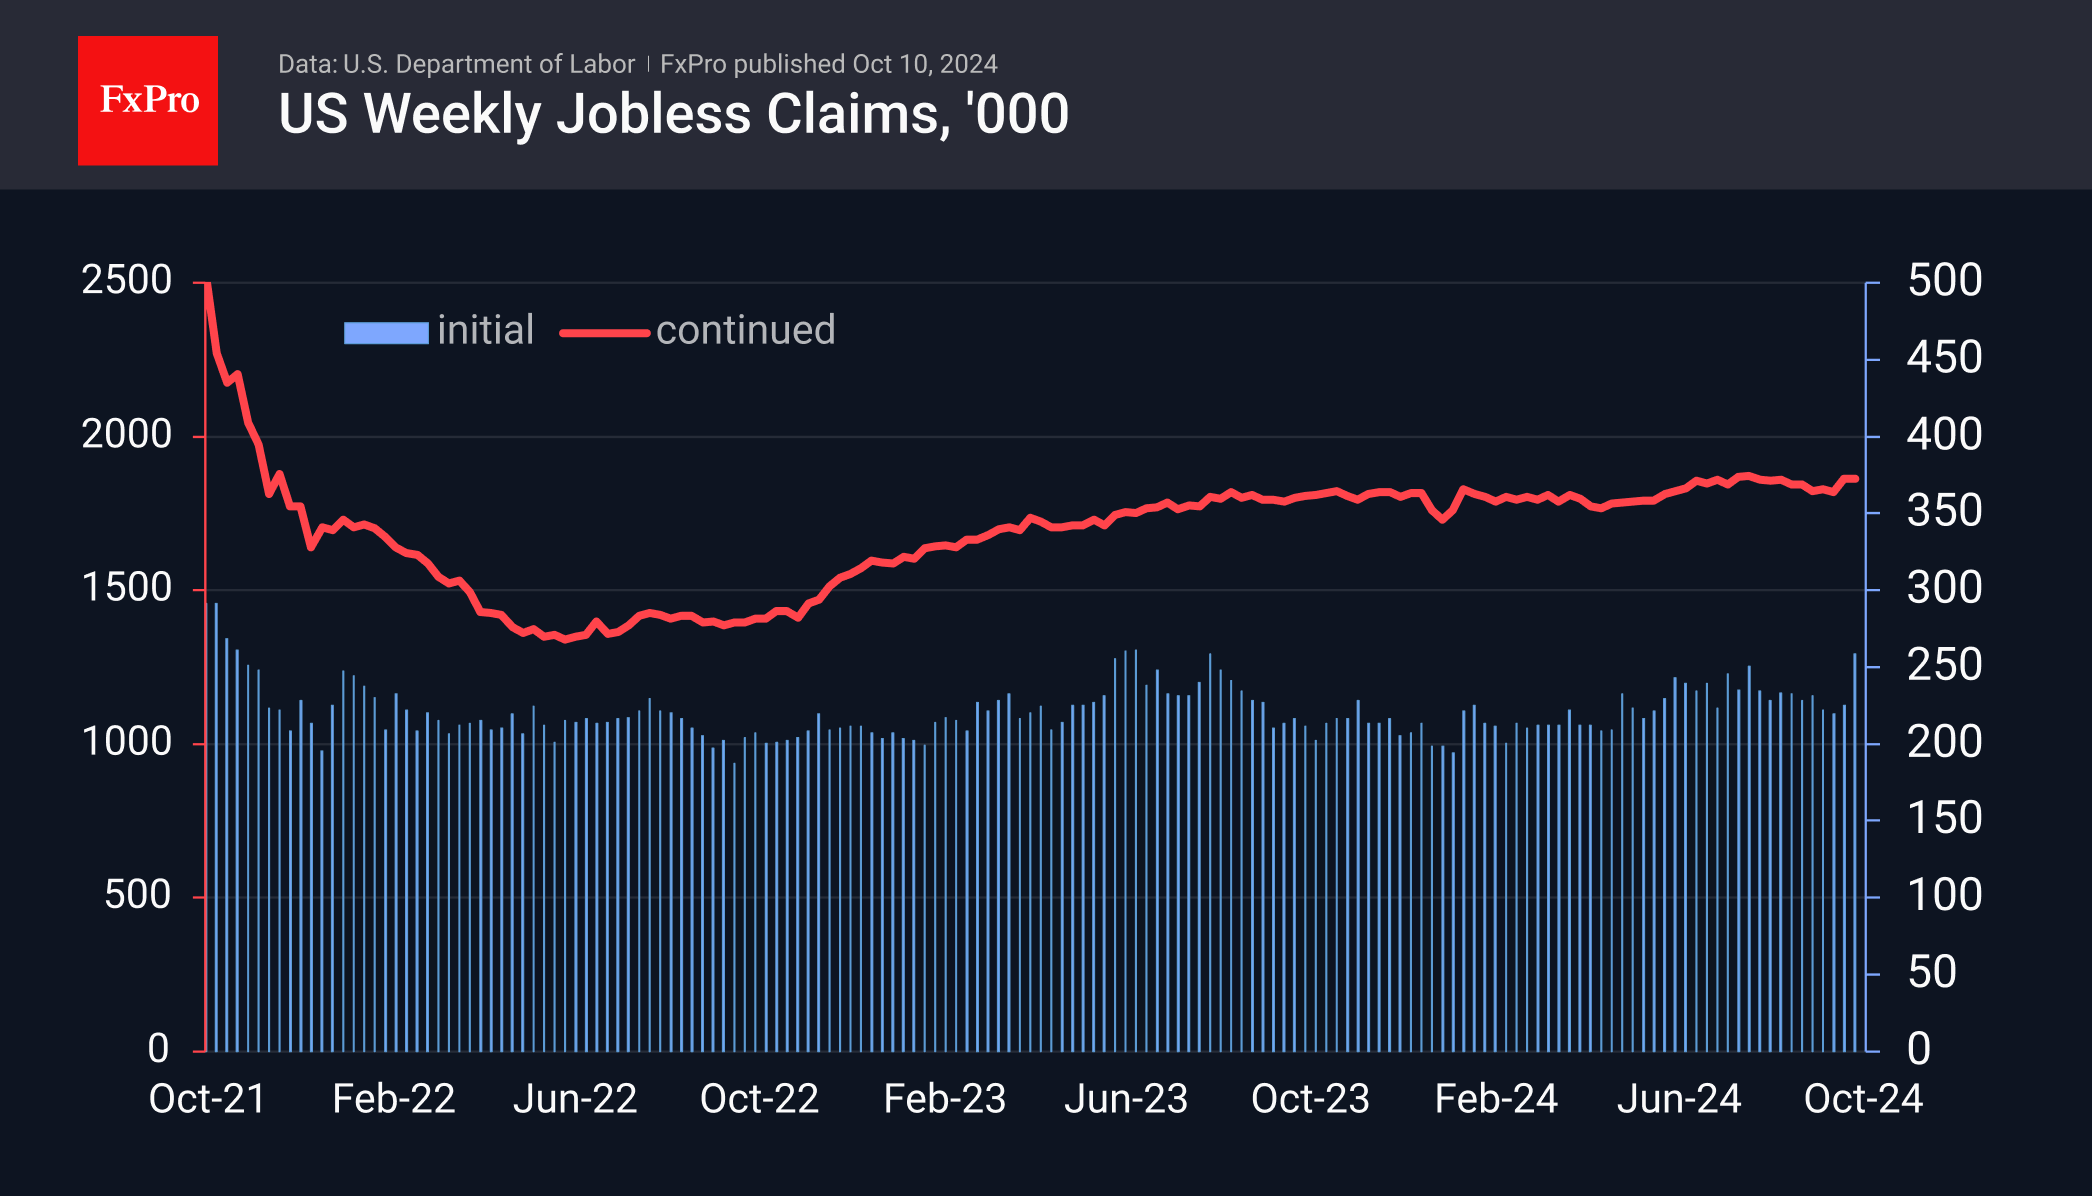
About two months ago, financial markets reacted nervously to employment signals, but the return of weekly claims to normal levels reassured investors that we were seeing a short-term spike rather than a trend reversal. Now, the situation is reversed: strong NFPs versus the alarm from the weekly numbers.
The dollar fluctuated between 0.4% and 0.1% in the first moments after the data was released but has only lost 0.1% at the time of writing on such conflicting data. Perhaps investors will now eagerly look for signals from Fed members to learn their assessment of the situation, which the market will follow.
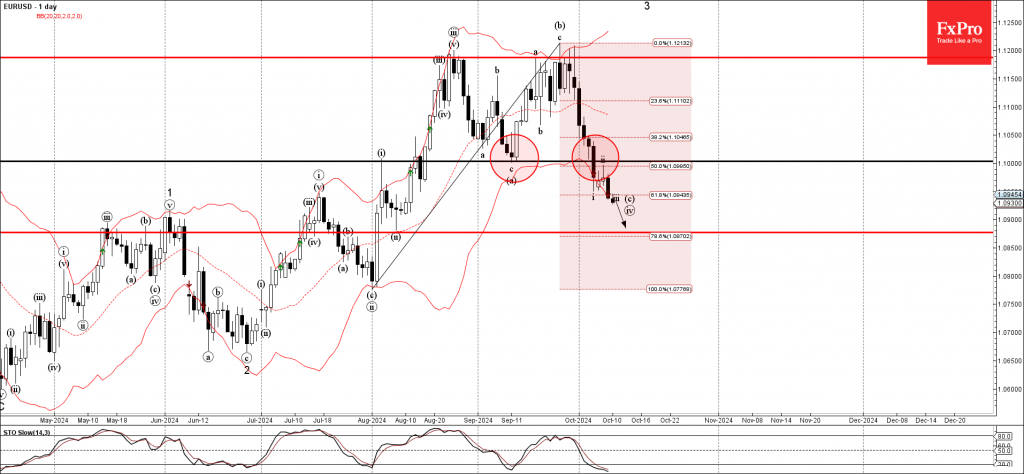
EURUSD Wave Analysis
- EURUSD broke support zone
- Likely to fall to support level 1.0875
EURUSD currency pair under the bearish pressure after the earlier breakout of the support zone located between the key support level 1.1000 (former monthly low from September) and the 50% Fibonacci correction of the upward impulse from July.
The breakout of this support zone accelerated the active minor impulse wave c of wave (iv) from the end of August.
Given the simultaneously bearish euro sentiment and bullish US dollar sentiment, EURUSD currency pair be expected to fall further to the next support level 1.0875, low of wave ii from August.
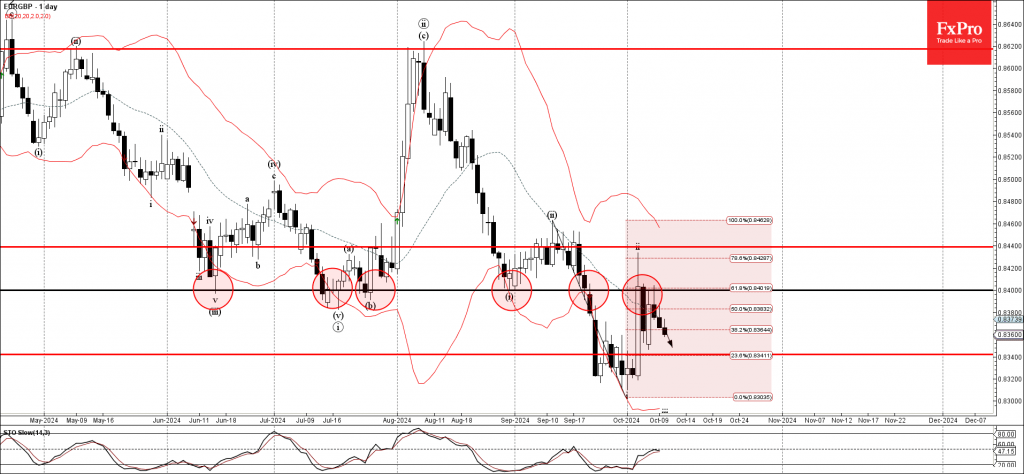
EURGBP Wave Analysis
- EURGBP reversed from resistance zone
- Likely to fall to support level 0.8340
EURGBP currency pair recently reversed down from the resistance zone located between the key resistance level 0.8400 (former strong support from June, July and August) intersecting 20-day moving average and the 618% Fibonacci correction of the downward impulse from September.
The downward reversal from this resistance zone started the active minor impulse wave iii.
Given the strongly bearish euro sentiment seen today and the clear daily downtrend, EURGBP currency pair be expected to fall further to the next support level 0.8340.
Fed’s Williams expects gradual move toward neutral policy
New York Fed President John Williams signaled today that monetary policy will continue to shift towards a more neutral stance in the coming months, aligning with ongoing progress toward price stability. He emphasized that while inflation remains above the 2% target, there has been clear movement in the right direction.
Williams noted, "Based on my current forecast for the economy, I expect that it will be appropriate to continue the process of moving the stance of monetary policy to a more neutral setting over time." He reiterated that this approach will help preserve both the economy's strength and the health of the labor market.
While acknowledging the work still needed to achieve price stability, he expressed optimism, stating, "The data paint a picture of an economy that has returned to balance." Despite inflation remaining elevated, the message from Williams was one of cautious confidence, suggesting the Fed’s shift towards less restrictive policy will proceed gradually.
Fed’s Goolsbee expects more close calls ahead on rate decisions
Chicago Fed President Austan Goolsbee, in an interview with CNBC today, highlighted the clear progress made in curbing inflation and cooling the labor market over the past 12 to 18 months.
“The overall trend... is clearly that inflation has come down a lot and the job market has cooled to a level which is around where we think full employment is,” Goolsbee stated.
Looking ahead, he noted there is broad consensus among policymakers that interest rates will need to drop a “fair amount” over the period.
However, in the near-term, Goolsbee expects more "close call" meetings for FOMC as members navigate through sometimes conflicting economic data.
Sunset Market Commentary
Markets
Data dependency = volatility. Today was a textbook example. The US economic agenda featured September CPI figures and the weekly jobless claims. The former came in at the topside of expectations with headline and core coming in at 0.2% and 0.3% m/m respectively, beating the consensus view by 0.1 ppt each. The yearly print as a result eased a little less than hoped-for in headline terms, from 2.5% to 2.4% and unexpectedly accelerated in the underlying gauge to 3.3%. Energy prices were a drag last month, falling almost 2% on a monthly basis, but food prices (0.4%) rose at fastest pace in about two years. Shelter prices, known for their stickiness, only rose by 0.2%, matching June’s low print which was in turn the slowest advance since August 2021. Offsetting this, however, is the quickening in core services ex housing inflation, a metric watched closely by the Fed. With the 0.4% m/m outcome, the annualized 3mMA is nearing 4% again. The broader services inflation gauge stood at 0.4% and 4.7% y/y. Bond yields’ first reaction was to extend previous daily gains with the 2-yr yield spiking to the highest level since mid-August. Enter weekly jobless claims. A big jump from 225k to 258k crushed expectations for a much more modest rise to 230k. States including Florida and North Carolina printed some of the biggest increases, revealing an impact from hurricane Helene. The upcoming readings may be affected similarly (hurricane Milton). The jury’s still out whether it turns out to be a temporary effect but since the Fed is now laser-focused on the labour market it does dictate the market reaction. Front-end yields in the US swapped intraday gains of as much as 7 bps for losses around 4 bps. But that’s nowhere near enough to table the idea of a 50 bps Fed cut in November again though. Current pricing still doesn’t fully discount a 25 bps move, even after today’s repositioning. Swings at the long end of the US curve were much more muted. The likes of the 10-yr trade flat. European/German yields pared earlier gains of 2-3 bps to around 1 bp. The dollar’s intraday volatility eventually ended up in small losses. EUR/USD rebounded from a 1.0910 low to 1.0948 currently. DXY’s trip above 103 ended quickly (102.83).
News & Views
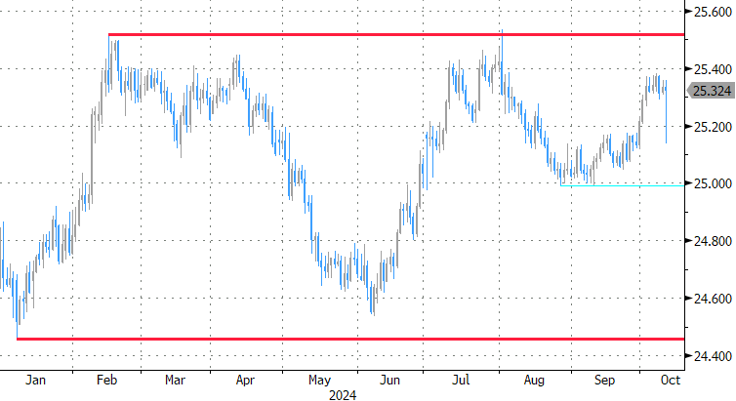
Prices in the Czech Republic declined -0.4% M/M, its statistical office published today. KBC expected a decline of 0.6 M/M. Due to an even sharper decline last year (base effects) the monthly decline still raised the Y/Y measure from 2.2% in August to 2.6% September. The monthly decline in prices was, amongst others, driven by a 20.9% decline in the prices for package holiday. Prices of fuels for personal transport also declined 4.9% M/M. Monthly prices rises mainly came from higher food prices (0.8%) and of costs related to education (+10.6% M/M). Y/Y goods and services prices went up by respectively 1.2% and 5.0%. The September outcome was 0.3% higher than the CNB summer forecast, but in a brief comment today, CNB indicated that core inflation was slightly below the forecast. Still, today’s report suggests that headline inflation might move to/or even above the 3.0% CNB tolerance band by the end of the year, before easing again in early 2025. KBC maintains a scenario of gradual easing (25 bps steps) from 4.25% currently to 3.50% in February 2025. The policy rate then might stay at that ‘new equilibrium level’ for a longer period. The koruna trades little changed near EUR/CZK 25.32.
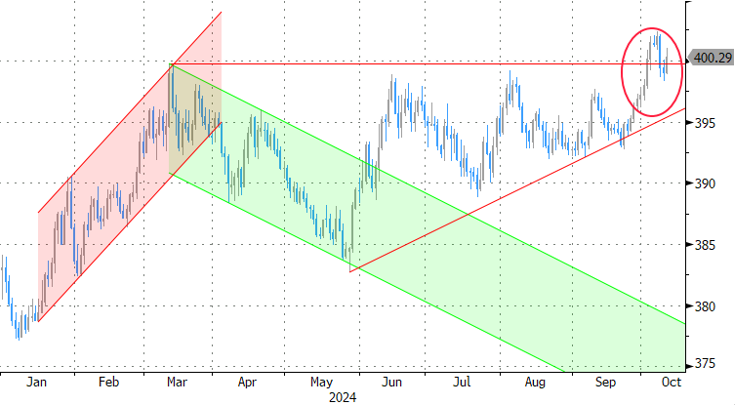
Hungarian inflation slowed more than expected by -0.1% M/M and 3.0% Y/Y (from 3.4%). Headline inflation returned to the MNB 3.0% target for the first time since January 2021. Analysis of the MNB tells that inflation of tradables declined 0.7% M/M to ease to 1.6% Y/Y. Market services prices increased 0.1% M/M holding the Y/Y-measure at 9.6%. Core inflation measures showed a mixed picture (core ex indirect taxes 4.8% from 4.6%, CPI ex processed food 5.5% from 5.8%, sticky price CPI 5.4% from 5.8%). After a pause in August, the MNB again eased the policy rate by 25 bps (to 6.5%) in September. We expect the MNB will (have to) stick to a cautious approach. Both core and inflation are expected to turn higher again toward the end of the year. As the forint weakened north of EUR/HUF 400, financial stability concerns will again get a bigger weight in the MNB assessment. In this respect deputy Governor Virag earlier this week indicated that chances of a skip at the October 22 meeting have grown. Lingering political tensions with the EU and market concerns on fiscal consolidation also don’t help the forint. The Hungarian currency declined from the EUR/HUF 399 area this morning to 400.6 currently.
Graphs
US 2-yr yield whipsawed on simultaneous release of stronger-than-expected CPI and surge in jobless claims
EUR/CZK: Czech koruna trades unchanged vs opening levels. September CPI won’t alter CNB’s gradual approach
EUR/HUF: below-consensus CPI doesn’t pave the way for further easing with forint again in the defensive
EUR/NOK: Easing Norwegian core inflation to nudge Norges Bank a bit further towards inaugural December cut?
September CPI: Minor Turbulence
Summary
The September CPI report came in slightly hotter than expected, but not enough to meaningfully change the outlook for U.S. inflation. Headline CPI rose 0.2% in the month, while excluding food and energy prices consumer price inflation was a tenth stronger at 0.3%. A 4.1% drop in gasoline prices helped restrain overall inflation, although a 0.4% rise in grocery store prices served as a partial offset to the respite at the pump. Core goods prices rose 0.2%, ending a six-month streak of goods deflation. Higher prices for new and used vehicles as well as apparel were the culprits for the increase in core goods prices. On the services side, slower inflation for shelter costs in September was offset by a jump in prices for airfares, motor vehicle insurance and medical care.
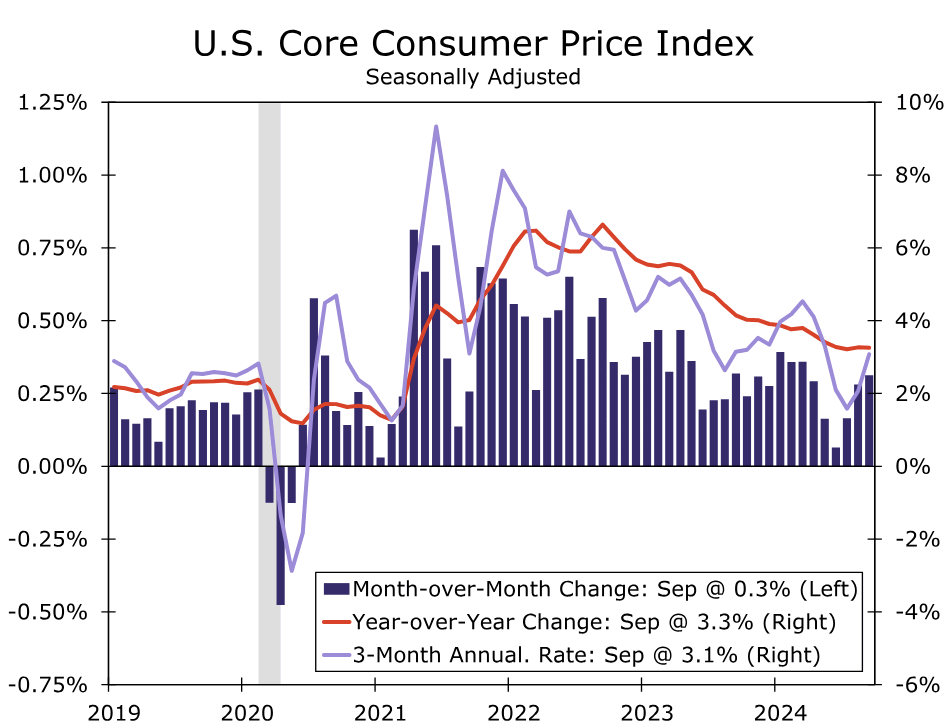
Today's data bring the year-ago change in the core CPI to 3.3%, with prices over the past three months increasing at a 3.1% annualized rate. For context, core CPI inflation averaged 2.2% in 2019, suggesting that the underlying pace of inflation at present is about one percentage point above what prevailed before the pandemic. Looking ahead, we expect the disinflation trend to continue, albeit gradually rather than sharply. The ongoing cooling in the labor market and lagging service sector components should help reduce core inflation a bit further in the months ahead. As a result, we expect the FOMC to continue normalizing monetary policy. We still anticipate two 25 bps rate cuts from the Federal Reserve at the two remaining FOMC meetings of the year.
Inflation Still Cooling on Trend
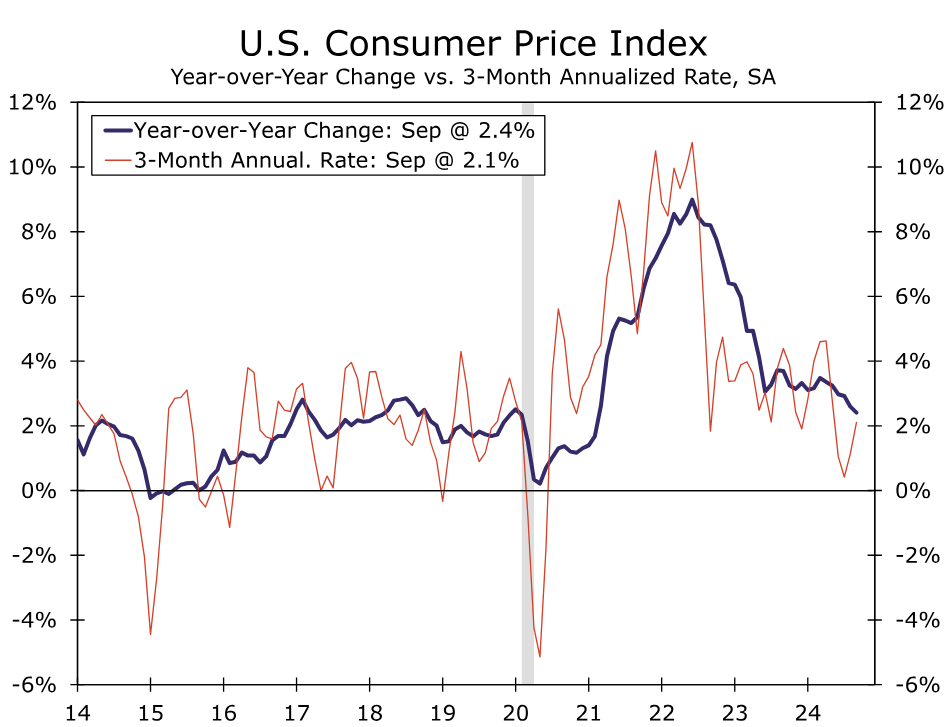
The bumpy ride to slower inflation continued in September. Overall consumer prices rose 0.2%, which was a tick higher than the Bloomberg consensus. Despite the somewhat larger-than-expected outturn, prices over the past year are up 2.4%, which marks the lowest one-year change in consumer prices since February 2021.
Consumers received some respite at the pump in September, with gasoline prices falling 4.1% last month. However, grocery store prices picked up sharply, increasing 0.4%. This was the largest monthly gain in nearly two years and was driven by a jump in egg prices (+8.4%) and the relatively volatile food component of fruits & vegetables (+0.9%). Even with September's jump, prices for food at home have risen 1.3% over the past year, down from a 12-month pace of 2.4% this time last year and a recent peak of 14% in the summer of 2022.
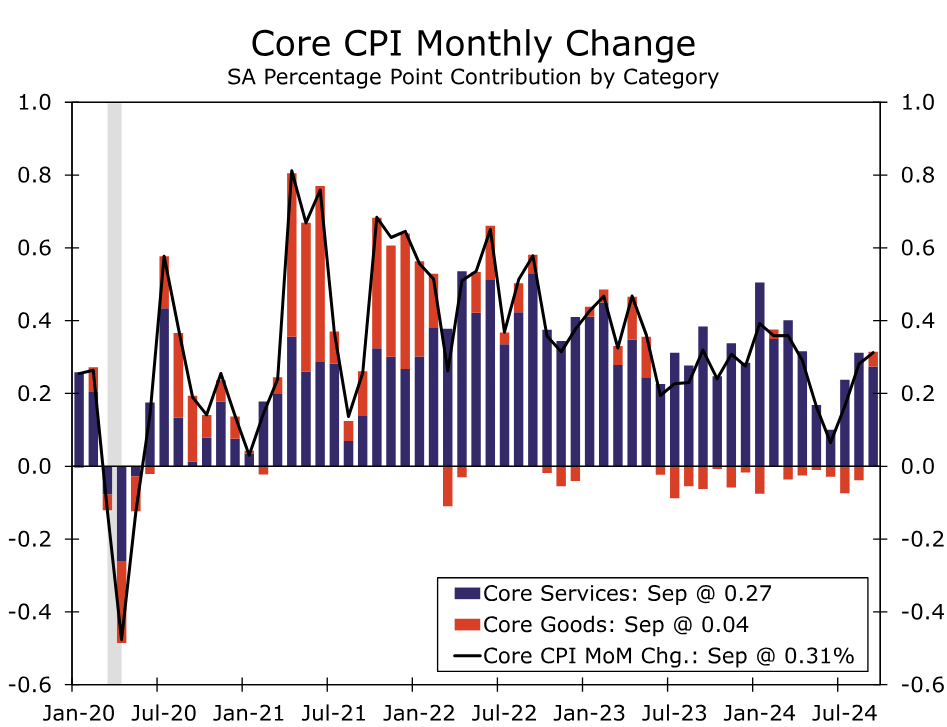
Excluding food and energy prices, core CPI came in at 0.3% (0.31% unrounded). This was modestly higher than we expected. Core goods prices rose 0.2% in the month, halting a six-month streak of deflation for prices in the goods sector. Small increases for prices of new and used vehicles contributed to the move higher, as did a 1.1% increase in apparel prices. Lower prices for medical care goods and recreation goods helped keep the increase in core goods prices in check.
Core services inflation was 0.4% in September (0.36% unrounded), a modest cooldown from the 0.41% pace registered in August. The drivers of services inflation in September were much different from what took place the prior month. Owners' equivalent rent came in at 0.3% in September, reversing the puzzlingly-strong 0.5% reading in August. Rents rose 0.3%, a tenth slower than September. However, outside primary shelter, services inflation jumped on the back of higher prices for airfares (+3.2%), motor vehicle insurance (+1.2%) and medical care services (+0.7%). Looking through the month-to-month noise, the underlying trend in core services inflation in recent months seems to have been between 0.3% and 0.4%, about a tenth or so stronger than the monthly pace that prevailed before the pandemic. Overall core CPI inflation has risen at a 3.1% annualized pace over the past three months, slightly below the year-ago pace (+3.3%) and about a percentage point faster than core CPI inflation in 2019.
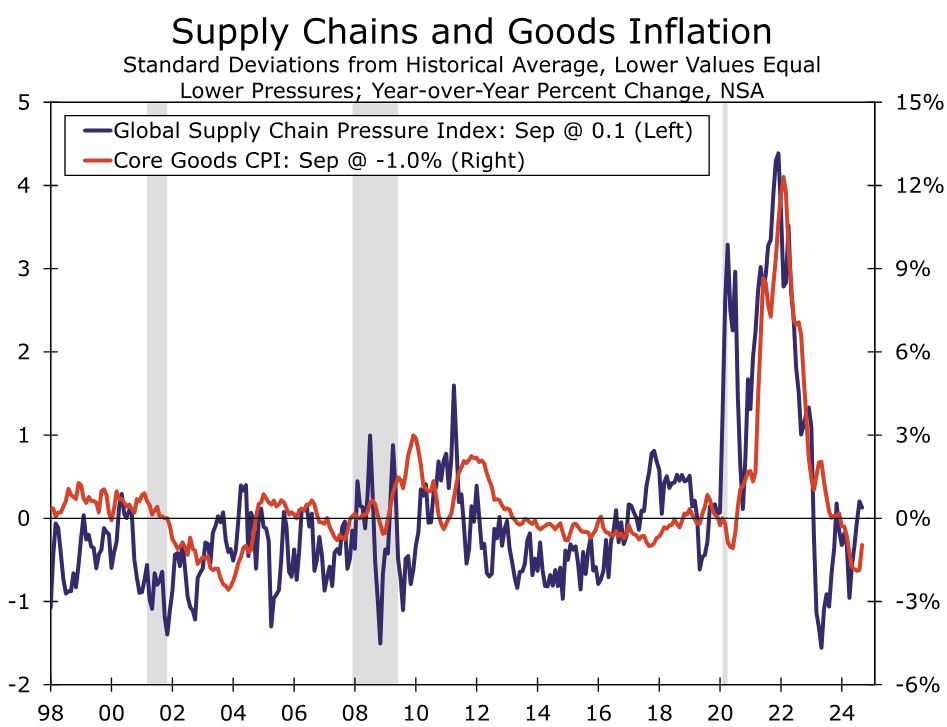
The September CPI report is consistent with our view that, while the overall trend in core inflation remains lower, further improvement is likely to be slower-going. The deflationary impulse to goods prices has waned with supply chain pressures no longer receding and inventories largely replenished. The downdraft to overall inflation from food and energy also has weakened, with the risks to energy costs for the time-being seeming to lie to the upside. However, we look for services inflation to continue to slow as housing inflation eases further and service providers benefit from tamer input cost growth for goods and labor.
While the next leg lower in inflation may take more time, the good news is that with the jobs market remaining in good shape and solid growth in productivity, average hourly earnings growth, up 4.0% over the past year, continues to outpace inflation. Thus, we do not see slower improvement on the inflation front as an impediment to real spending and output.
While today's inflation report may make some of the more hawkish members of the FOMC somewhat more reluctant to ease monetary policy further at the Committee's next meeting on November 7, we do not believe it is strong enough to warrant a pause. With inflation continuing to slow on trend and upward pressure on prices dissipating amid a cooler labor market and encouraging trends in productivity, there is still likely scope in the near term for policy to "recalibrate" further.
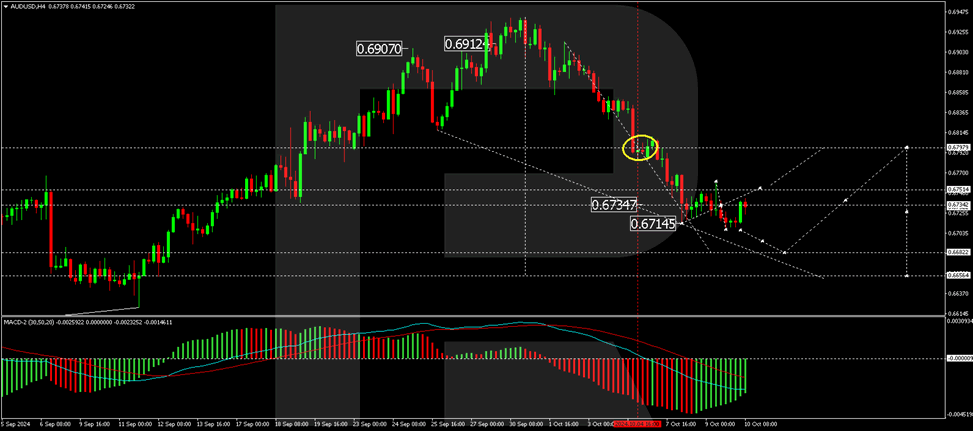
AUD/USD Stabilises Near Monthly Low Amid Mixed Signals
The AUD/USD pair has halted its nearly continuous seven-day decline, stabilising around 0.6730 on Thursday. This level marks the monthly low for the Australian dollar, which has faced significant pressures lately due to a strengthening US dollar and uncertainties in China, Australia's largest trading partner.
Market influences and economic indicators
The recent US jobs report and the Federal Reserve's latest meeting minutes have led investors to reassess their expectations for future US rate cuts, affecting the currency pair. Additionally, no new stimulus measures have been announced in China, impacting sentiment, given that earlier stimulative actions are still not fully reflected in the economic performance.
In Australia, inflation expectations have decreased to a three-year low of 4% in October, providing a somewhat positive signal. However, the minutes from the Reserve Bank of Australia's (RBA) latest meeting revealed discussions around both potential rate cuts and hikes, reflecting ongoing uncertainty about the economic outlook. The RBA concluded that the current interest rate appropriately balances the risks associated with inflation and labour market conditions.
AUD/USD technical analysis
The AUD/USD pair recently completed a downward wave to 0.6707 and is now forming a consolidation range above this level. If the pair breaks downwards, it could target a further decline to 0.6682. Conversely, an upward break might lead to a corrective move towards 0.6796. After this correction, the downward trend could continue towards 0.6655. The MACD indicator supports a bearish outlook, with its signal line positioned below zero and trending downwards.
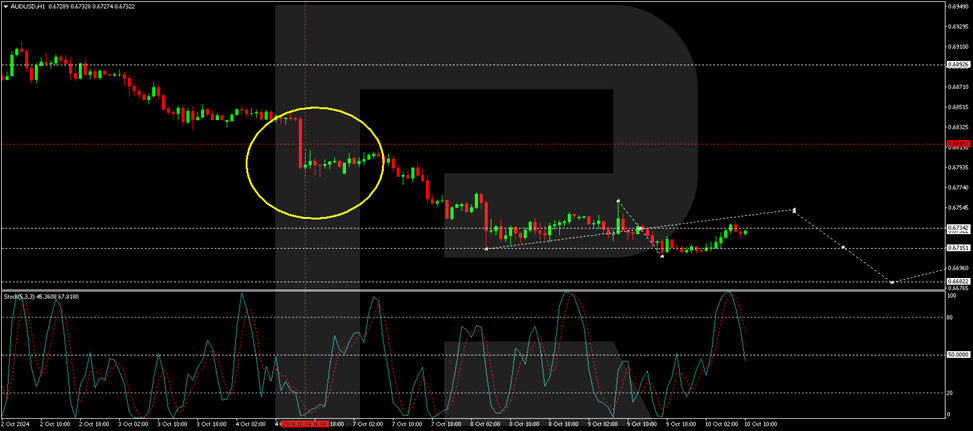
On the hourly chart, the pair is consolidating around 0.6734. An upward breakout could lead to a rise towards 0.6815. Following this, a new downward phase could begin, potentially reaching 0.6710. If this level is breached, the decline could extend towards 0.6682. The Stochastic oscillator, with its signal line below 80 and poised to move downwards, aligns with this potential downward trajectory.
Conclusion
Investors and traders should closely monitor further developments from both the Federal Reserve and the RBA, as well as any new economic data from China, which could significantly influence the direction of the AUD/USD pair. The complex interplay of US monetary policy expectations, Chinese economic actions, and domestic Australian economic indicators will likely continue to drive volatility in the currency pair.