Sample Category Title
GBP/USD Technical: Potential Bullish Reversal after 4-Week Slide as US CPI Looms
Since our last publication, the price actions of the GBP/USD have rallied and hit the lower limit of the first medium-term resistance zone of 1.3400/3505 (printed an intraday high of 1.3434 on 26 September).
A flip of BoE’s less dovish stance to “outright” dovish
Since the Bank of England (BoE) first interest rate cut of 25 basis points (bps) to reduce its key policy interest rate to 5.00% in August, its messaging and guidance on its accommodative monetary policy have been cautiously dovish where services inflation in UK remains sticky.
Thus, market participants have priced in a shallower and slower interest rate cut cycle in the UK versus the US where the US dollar has been weakest against the British pound sterling among other major currencies; the US dollar recorded its worst 2024 year-to-date loss of -5.2% against the pound sterling on 26 September.
However, the US dollar weakness has started to reverse in the past four weeks; further enhanced by a UK media interview with BoE Governor Bailey published on 3 October. BoE’s Bailey has a “sudden” change of his cautiously dovish rhetoric to outright dovish as he raised the prospect of more aggressive rate cuts by BoE in the coming months.
The GBP/USD recorded a decline of 1.08% on 3 October, its worst daily performance in almost a year. All in all, the pound sterling has shed 2.8% from its recent 26 September high to Wednesday, 9 October low of 1.3055.
Despite the four weeks of softness, the GBP is still the strongest among the major currencies and it still has a positive year-to-date return of 2.7% against the US dollar at this time of writing.
Longer-term UK OIS spreads have started to inch higher
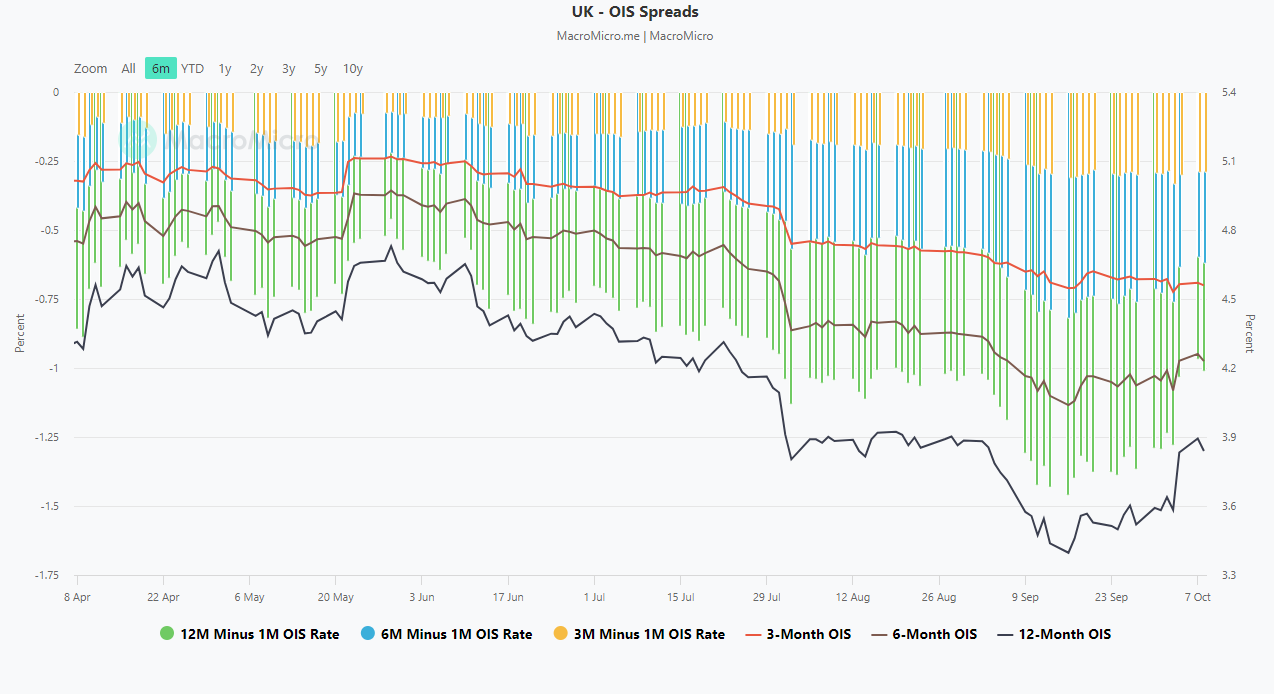
Fig 1: UK overnight indexed swap spreads as of 8 Oct 2024 (Source: MacroMicro, click to enlarge chart)
The overnight indexed swap (OIS) spread is the difference between the interest rate on long-term overnight indexed swaps and 1-month overnight indexed swaps.
Rates on OIS swaps can also be used as an indicator of the market’s expected central bank target interest rate. Widening OIS spreads indicate that the market expects the central bank to raise the interest rate in the short term, and vice versa.
The UK 6-month and 12-month OIS spread has started to trade higher since 3 October (media publication of BoE Bailey’s interview) which suggests that the interest rate swaps market has priced out some of the “dovish vibes” inherent in the past four weeks.
1.3000 remains the key medium-term support on the GBP/USD with 1.3260 as an upside trigger
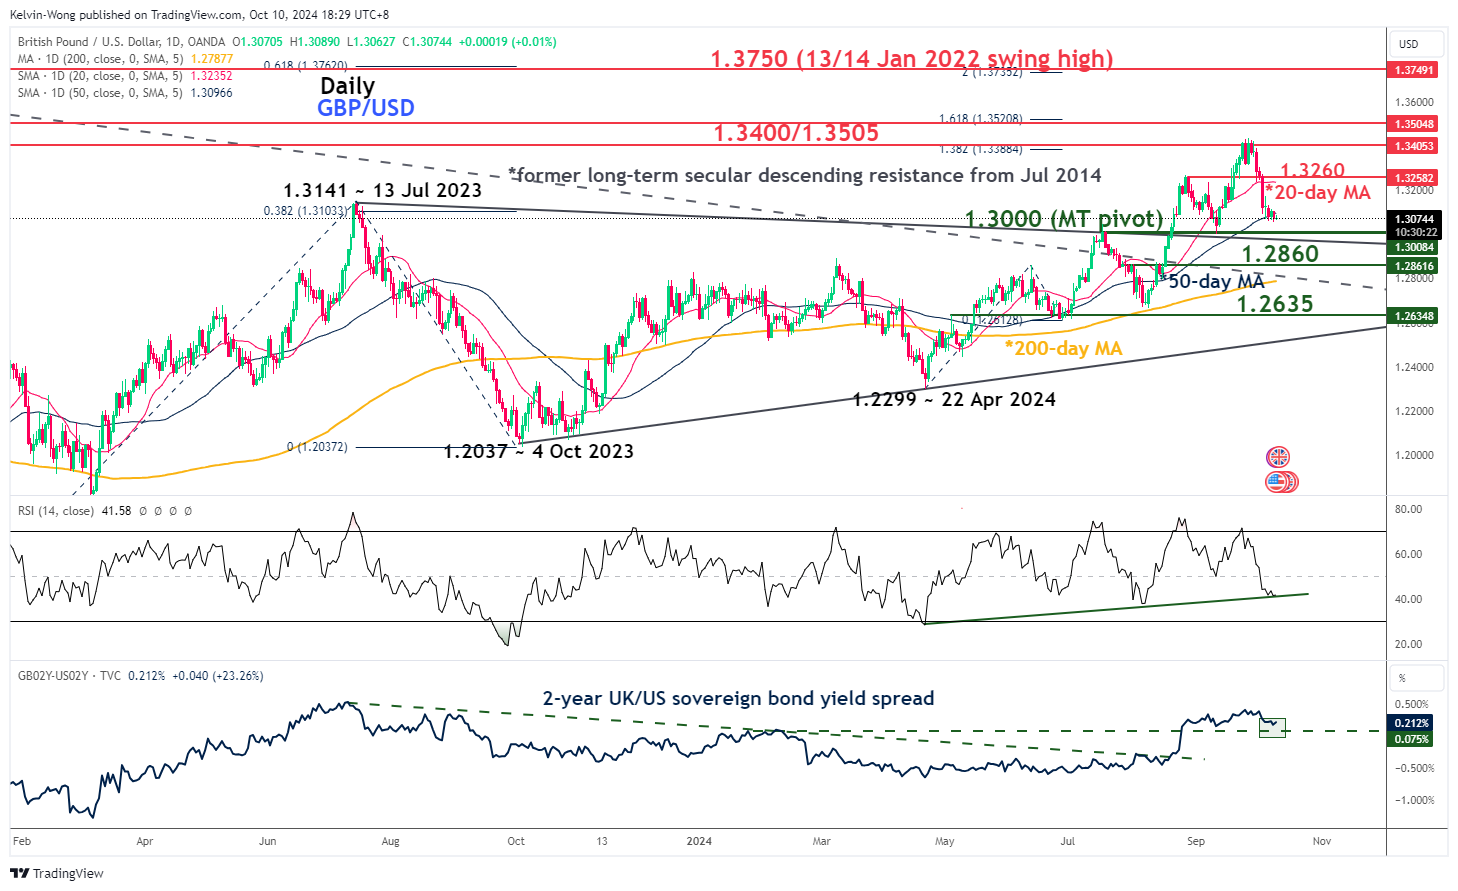
Fig 2: GBP/USD medium-term trend as of 10 Oct 2024 (Source: TradingView, click to enlarge chart)
The recent four-week slide of 2.8% (high to low) seen in the GBP/USD has reached its 50-day moving average.
In conjunction, the daily RSI momentum indicator has also hit a parallel ascending trendline support at the 40 level.
In addition, the 2-year yield spread of the UK sovereign bond (gilt) over the US Treasury note has just started a rebound right above its key medium-term support of 0.07%
Hence in the lens of technical analysis, these positive elements suggest a potential bullish reversal in the GBP/USD to renew its impulsive up sequence within its medium-term uptrend phase.
Watching the 1.3000 key medium-term pivotal support and clearance above 1.3260 (also the 20-day moving average) increases the odds of the potential bullish reversal scenario to revisit 1.3400/1.3505 before the next medium-term resistance comes in at 1.3750.
However, failure to hold at 1.3000 invalidates the bullish expectation for an extension of the corrective decline to expose the next medium-term supports at 1.2860 and 1.2635.
USD/JPY Steady After Fed Minutes
The yen is calm on Thursday after sharp losses a day earlier. In the European session, USD/JPY is trading at 148.88, down 0.28%.
Fed minutes: next cut will likely be 25 bps
The Federal Reserve released the minutes from the September meeting on Wednesday. That meeting was dramatic as the markets were uncertain right up to the rate announcement whether the Fed would cut by 25 or 50 basis points . The Fed opted for the oversized cut and only one FOMC member dissented. The minutes, however, indicated that there were other members who preferred a more gradual pace of lower rates although they went along with the 50-bps cut.
The September decision came after two consecutive employment reports that were softer than anticipated, which may have swayed some dovish members to vote for a 50-bps cut. The takeaway is that Jerome Powell shouldn’t expect the same degree of support for a 50-bps cut at the November or December meetings. The labor market bounced back in September with a nonfarm payrolls report that blew past the forecast and the markets have priced in a 25-bps cut in November.
US inflation will play a crucial part in the Fed’s rate path and September CPI will be released today. Headline inflation is expected to ease to 2.3%, compared to 2.5% in August, while core CPI is forecast to remain unchanged at 3.2%.
In Japan, the BoJ has dampened expectations for another rate hike and is expected to maintain rates at 0-0.25% at the October 31 meeting. New Prime Minister Shigeru Ishiba has supported a monetary policy but has changed his tune since being elected. Earlier this week, Ishiba said there was no need to raise rates, perhaps trying to avoid any controversial statements ahead of the snap election on October 27.
USD/JPY Technical
- USD/JPY tested resistance at 148.61 earlier. Above, there is resistance at 149.01
147.97 and 147.57 are providing support
USD/JPY Chart Analysis: Bears May Take Control
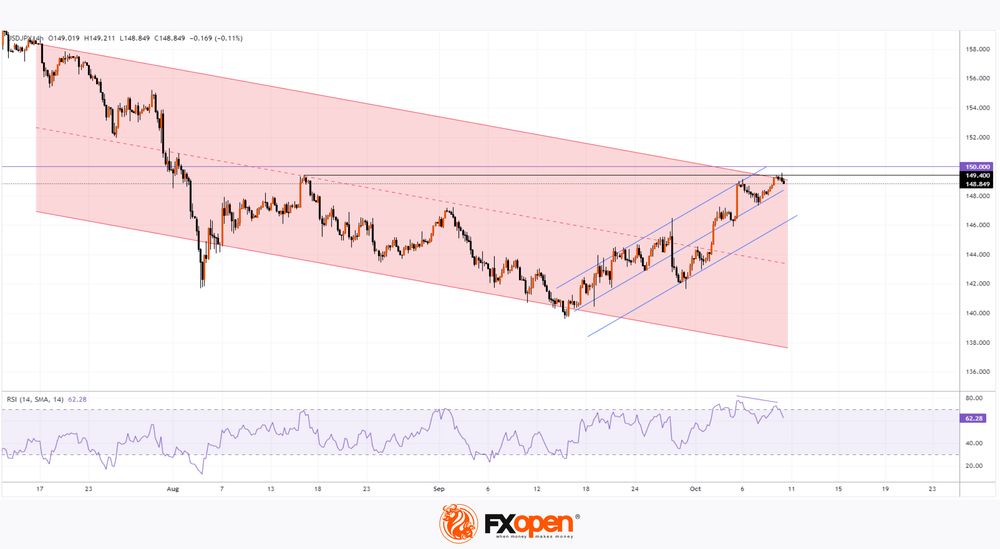
As shown in today’s USD/JPY chart, the US dollar has gained over 3.6% against the yen since the start of the month. Yesterday, the exchange rate surpassed the peak formed on 16 August around the 149.40 level, marking a 10-week high.
The bullish sentiment towards the US dollar has been influenced by increased market confidence in the Federal Reserve’s patient approach to further monetary easing, as reported by Reuters.
Can the USD/JPY rise continue?
From a technical analysis perspective, bears have a chance to take control, as the rate is nearing a resistance zone formed by:
→ the upper boundary of the descending channel (shown in red);
→ the psychological level of 150 yen per dollar.
Additional arguments supporting the potential for a bearish reversal include:
→ the price decline after briefly exceeding the 16 August peak (a possible false bullish breakout);
→ divergence on the RSI indicator.
The release of the US CPI data today at 15:30 GMT+3 could serve as a catalyst for a bearish move. The resulting price action will provide traders with important insights on whether the market is nearing the end of an intermediate recovery (shown with blue lines) within the descending channel (shown in red).
Trade over 50 forex markets 24 hours a day with FXOpen. Take advantage of low commissions, deep liquidity, and spreads from 0.0 pips. Open your FXOpen account now or learn more about trading forex with FXOpen.
This article represents the opinion of the Companies operating under the FXOpen brand only. It is not to be construed as an offer, solicitation, or recommendation with respect to products and services provided by the Companies operating under the FXOpen brand, nor is it to be considered financial advice.
USDCHF Looks Promising Ahead of US CPI Data
- USDCHF finds fresh buying near 50-day SMA; rises to six-week high
- Short-term outlook remains positive, but a pullback cannot be ruled out
- US CPI inflation data may create fresh volatility at 12:30 GMT
USDCHF secured strong footing near 50-day simple moving average (SMA) and extended its bullish break out of the monthly range to a six-week high of 0.8609 on Wednesday.
Despite the current weak price momentum, the technical indicators suggest there could be more bullish potential. With the RSI extending its uptrend above its 50 neutral mark and the MACD entering the positive region for the first time since May, the short-term bias is now favoring the upside. Yet, with the stochastic oscillator hovering near its 80 overbought level, some stability cannot be ruled out.
Resistance is anticipated around the 61.8% Fibonacci retracement level of 0.8672 if the pair continues its bullish wave. Further up, the August bar of 0.8725 could keep the bulls busy, delaying any increases towards the descending trendline and the 50% Fibonacci mark of 0.8777.
On the downside, the positive bias could be maintained if the 78.6% Fibonacci level of 0.8522 and the 50-day SMA put a floor under the price. If they concede and the price dips below its 20-day SMA, the spotlight will turn straight to the 0.8398 bottom. A steeper decline may threaten a broad outlook deterioration below the nine-year low of 0.8330 and the 0.8313 barrier. The 0.8200 round mark could come on the radar next.
All in all, USDCHF seems to be holding a bullish bias in the short-term picture after exiting its recent horizontal trajectory. Unless the price tumbles below 0.8522, a bearish action shouldn’t be a concern.

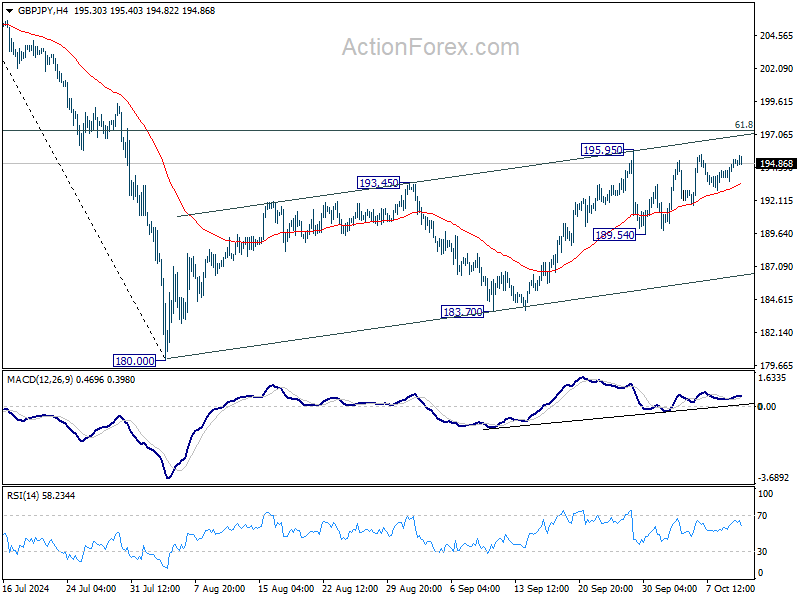
GBP/JPY Daily Outlook
Daily Pivots: (S1) 194.10; (P) 194.68; (R1) 195.78; More...
Intraday bias in GBP/JPY stays neutral at this point. On the upside break of 195.95 will resume whole rise from 180.00 to 61.8% retracement of 208.09 to 180.00 at 197.35 next. On the downside, break of 189.54 will turn bias back to the downside for 183.70 support instead.
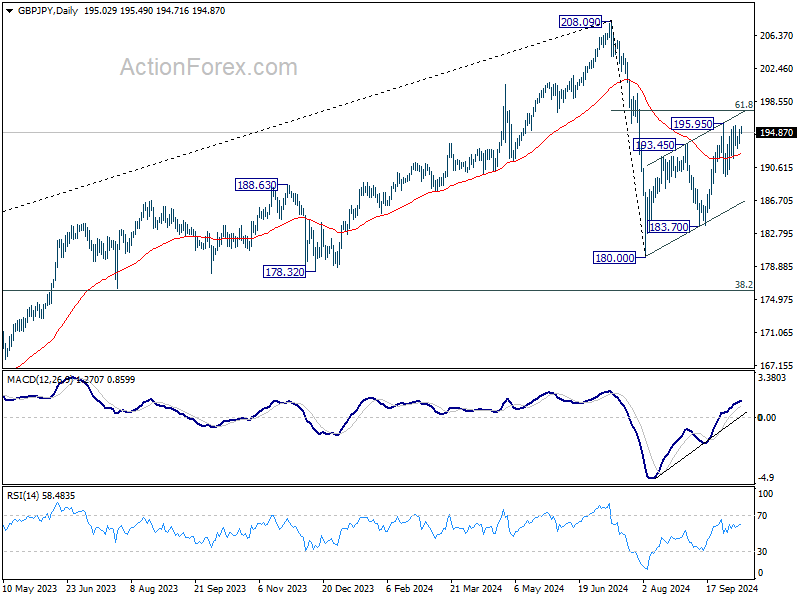
In the bigger picture, price actions from 208.09 are seen as a correction to whole rally from 123.94 (2020 low). The range of consolidation should be set between 38.2% retracement of 123.94 to 208.09 at 175.94 and 208.09. However, decisive break of 175.94 will argue that deeper correction is underway.
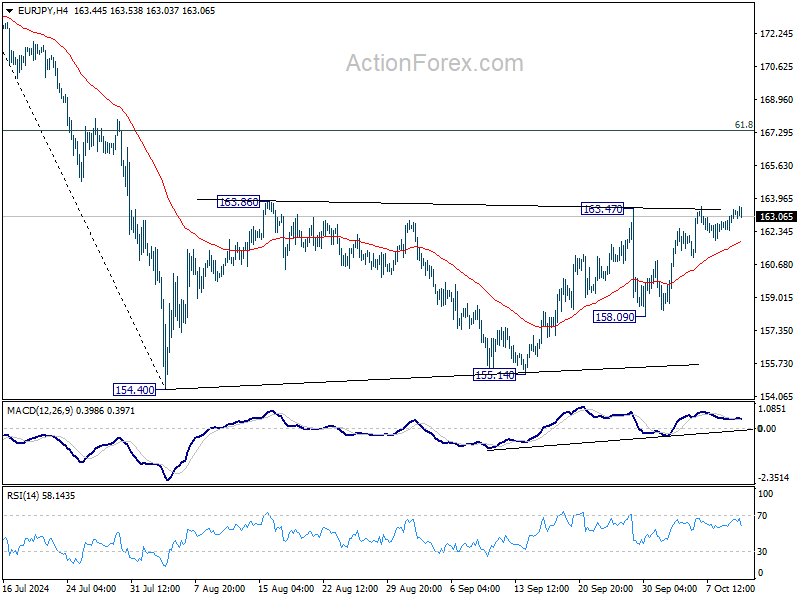
EUR/JPY Daily Outlook
Daily Pivots: (S1) 162.67; (P) 163.07; (R1) 163.75; More....
Intraday bias in EUR/JPY is still neutral at this point. On the upside, break of 163.47 resistance will resume the rebound from 154.40 to 61.8% retracement of 175.41 to 154.40 at 167.38. On the downside, break of 158.09 will bring deeper fall back to 154.40/155.14 support zone instead.
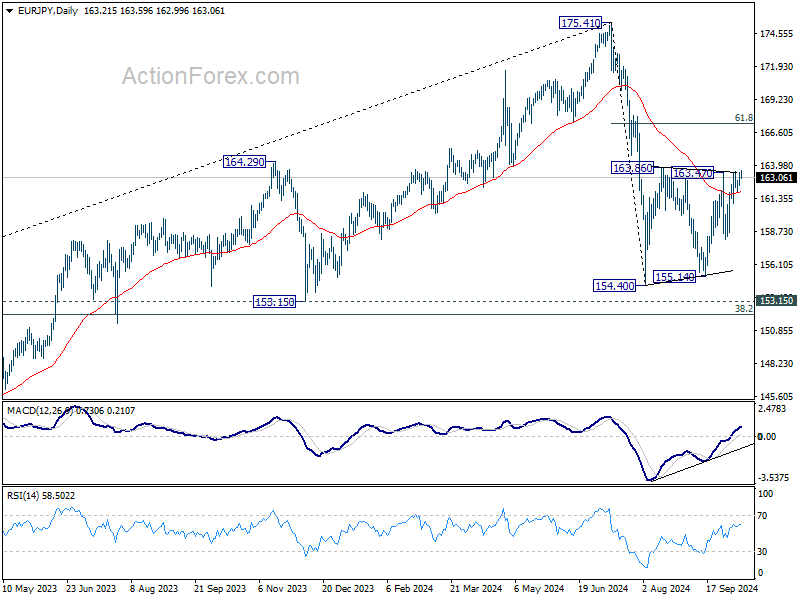
In the bigger picture, price actions from 175.41 are seen as correction to rally from 114.42 (2020 low). The range of consolidation should have been set between 38.2% retracement of 114.42 to 175.41 at 152.11 and 175.41 high. However, decisive break of 152.11 would argue that deeper correction is underway.
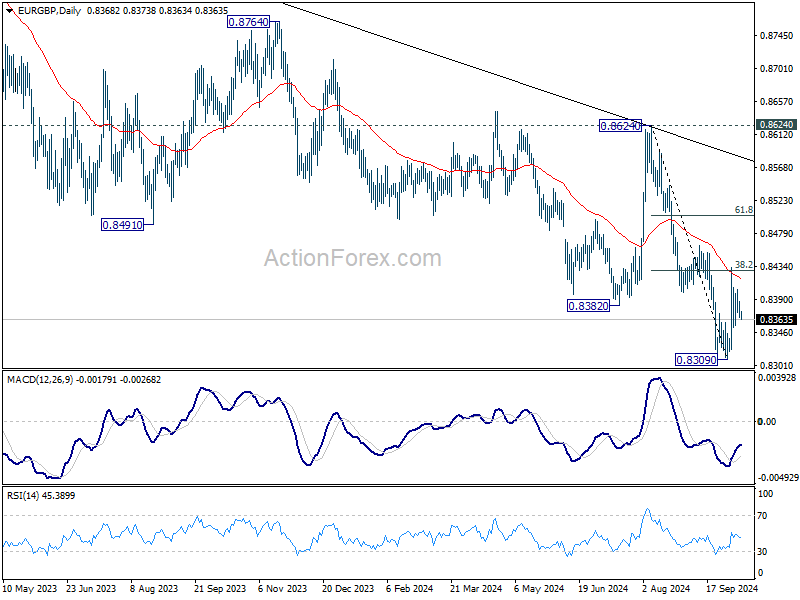
EUR/GBP Daily Outlook
Daily Pivots: (S1) 0.8361; (P) 0.8375; (R1) 0.8383; More...
Intraday bias in EUR/GBP remains neutral for the moment. Outlook also stays bearish. On the downside, break of 0.8309 will resume larger down trend to 0.8201 key support next. However, decisive break of 38.2% retracement of 0.8624 to 0.8309 at 0.8429 will pave the way to 61.8% retracement at 0.8504 and possibly above.
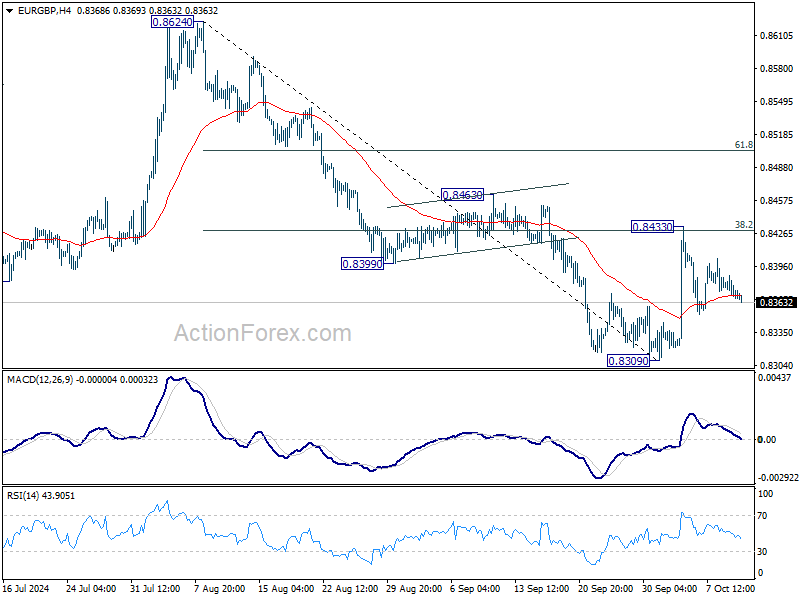
In the bigger picture, down trend from 0.9267 (2022 high) is in progress. Next target is 0.8201 (2022 low), but strong support should be seen there to bring rebound. However, outlook will remain bearish as long as 0.8624 resistance holds even in case of strong rebound.
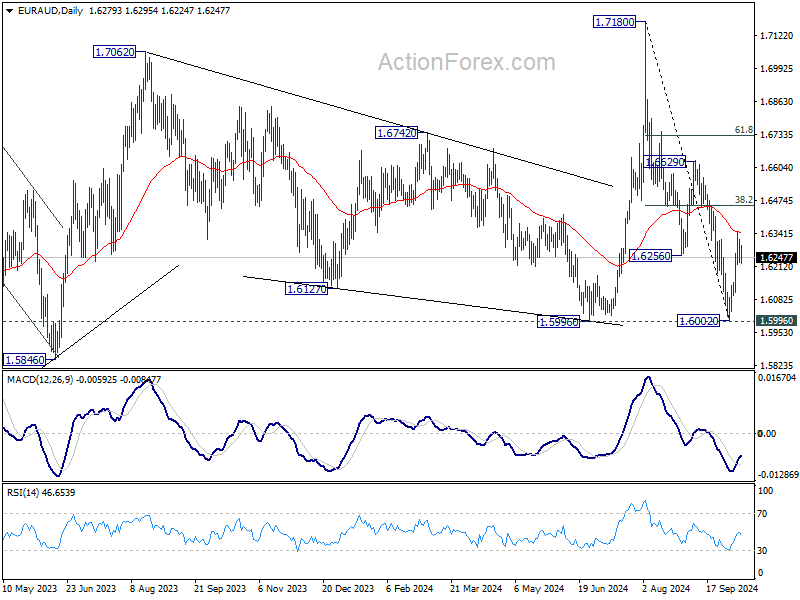
EUR/AUD Daily Outlook
Daily Pivots: (S1) 1.6236; (P) 1.6278; (R1) 1.6326; More...
Intraday bias in EUR/AUD is turned neutral with current retreat. Another rise is in favor as long as 55 4H EMA (now at 1.6251) holds. Above 1.6351 will resume the rebound from 1.6002 short term bottom to 38.2% of 1.7180 to 1.6002 at 1.6452. Decisive break there will strengthen the case that whole corrective fall from 1.7180 has completed with three waves down to 1.6002. However, sustained break of 55 4H EMA will dampen this view and bring retest of 1.6002 low instead.
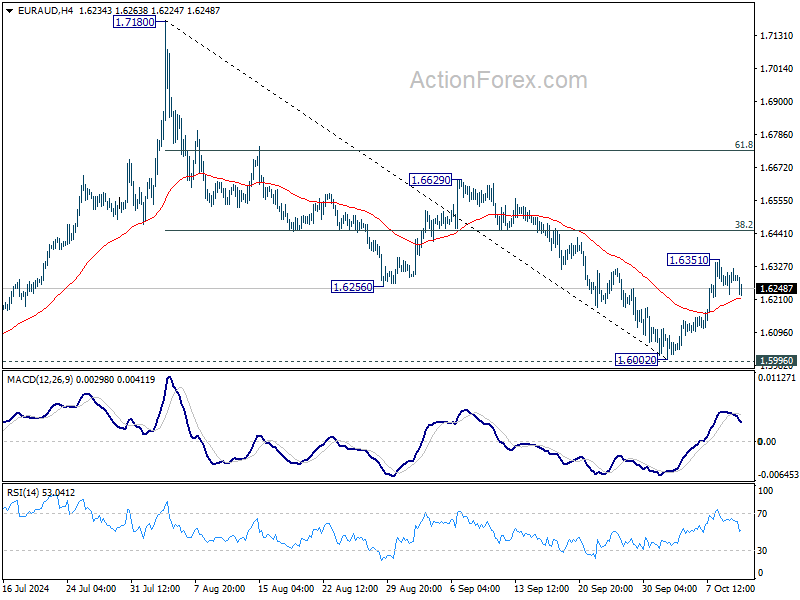
In the bigger picture, as long as 1.5996 support holds, up trend from 1.4281 (2022 low) is still expected to resume at a later stage. However, decisive break of 1.5996 will argue that the medium term trend has reversed and turn outlook bearish.
EUR/CHF Daily Outlook
Daily Pivots: (S1) 0.9396; (P) 0.9411; (R1) 0.9431; More....
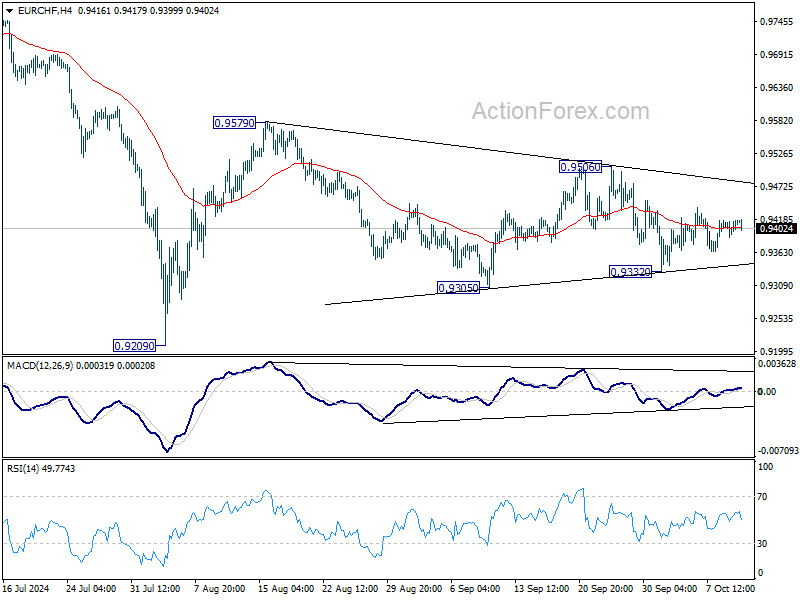
Intraday bias in EUR/CHF remains neutral as it's still bounded in converging range. For now, the favored case is that rise from 0.9209 low is not finished yet. Break of 0.9506 will turn intraday bias to the upside for 0.9579 resistance and above. However, break of 0.9332 will dampen this view and bring deeper decline through 0.9305 support instead.
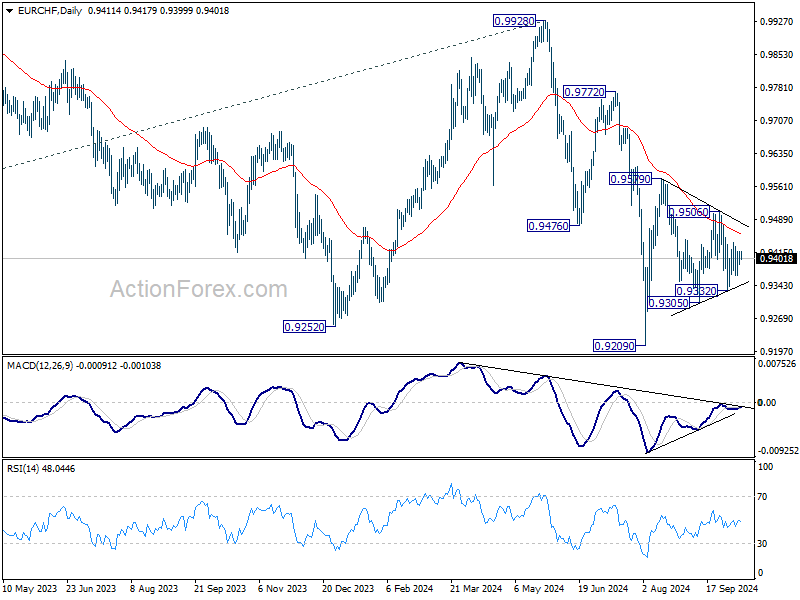
In the bigger picture, medium term corrective pattern from 0.9407 (2022 low) might have completed with three waves to 0.9928. Decisive break of 0.9252 (2023 low) will confirm long term down trend resumption. Next target will be 61.8% projection of 1.1149 to 0.9407 from 0.9928 at 0.8851. For now, outlook will stay bearish as long as 0.9928 resistance holds, even in case of strong rebound.
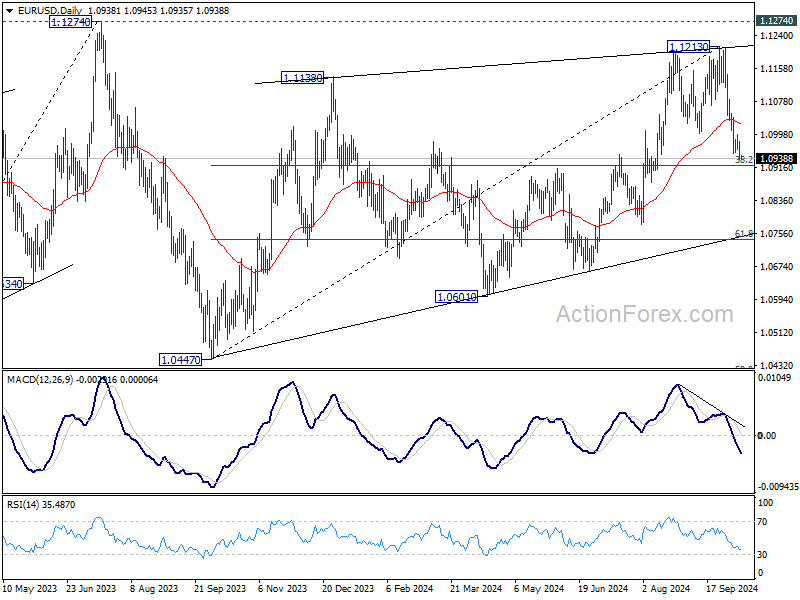
EUR/USD Daily Outlook
Daily Pivots: (S1) 1.0920; (P) 1.0956; (R1) 1.0975; More....
Intraday bias in EUR/USD is back on the downside with break of 1.0950 temporary low. Fall from 1.1213 short term top is resuming for 38.2% retracement of 1.0447 to 1.1213 at 1.0920. Sustained break there will argue that fall from 1.1213 is the third leg of the corrective pattern from 1.1274. In this case, deeper decline would be seen to 61.8% retracement at 1.0740 next. On the upside, above 1.0996 minor resistance will turn intraday bias neutral again first.
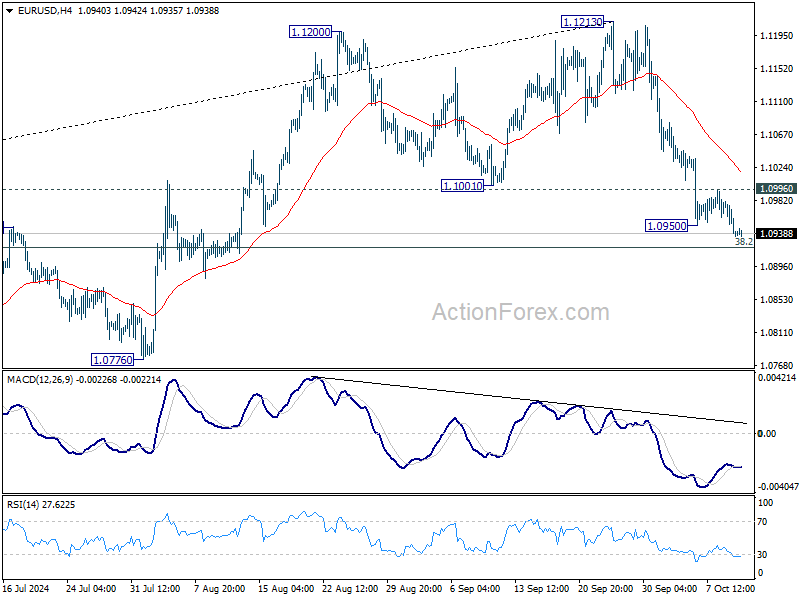
In the bigger picture, rejection by 1.1274 resistance suggests that corrective pattern from 1.1274 (2023 high) is not completed yet. Instead, decline from 1.1213 might be another falling leg. Sustained break of 55 W EMA (now at 1.0877) will validate this case, and bring deeper fall towards 1.0447 support again.