Sample Category Title
USD/CAD Daily Outlook
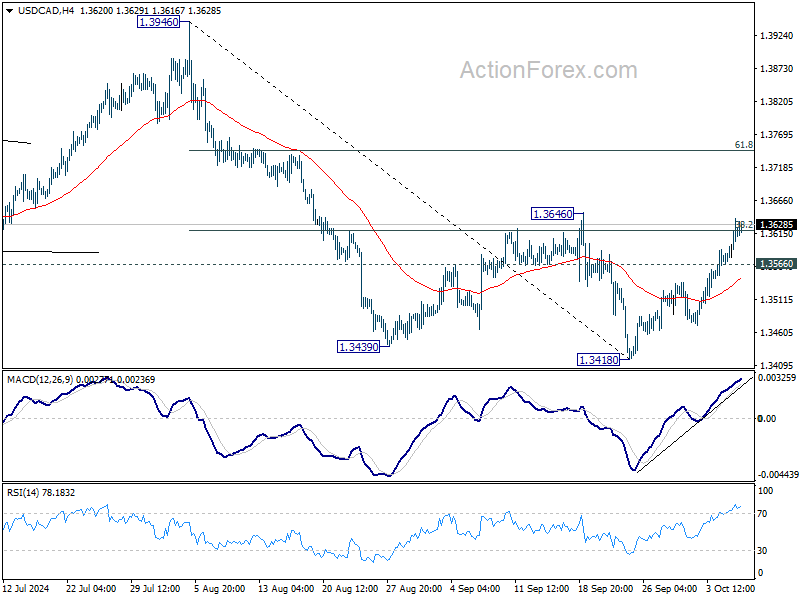
Daily Pivots: (S1) 1.3577; (P) 1.3609; (R1) 1.3653; More...
USD/CAD's rebound from 1.3418 is still in progress and intraday bias stays on the upside. Decisive break of 38.2% retracement of 1.3946 to 1.3418 at 1.3505 will target 61.8% retracement at 1.3559 next. On the downside, below 1.3566 minor support will turn intraday bias neutral first.
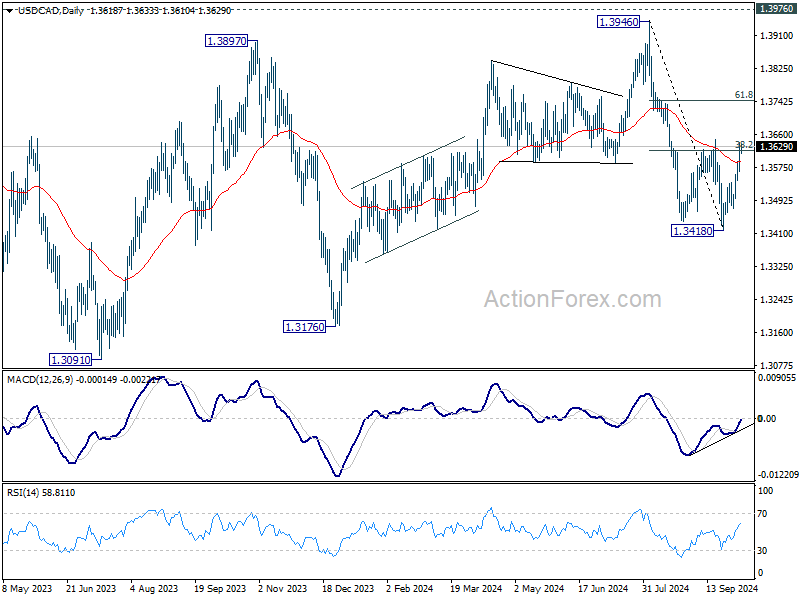
In the bigger picture, corrective pattern from 1.3976 (2022 high) is extending with another falling leg. While deeper decline could be seen, strong support should emerge above 1.2947 resistance turned support to bring rebound. Rise from 1.2005 (2021 low) is still in favor to resume at a later stage.
EUR/CHF Daily Outlook
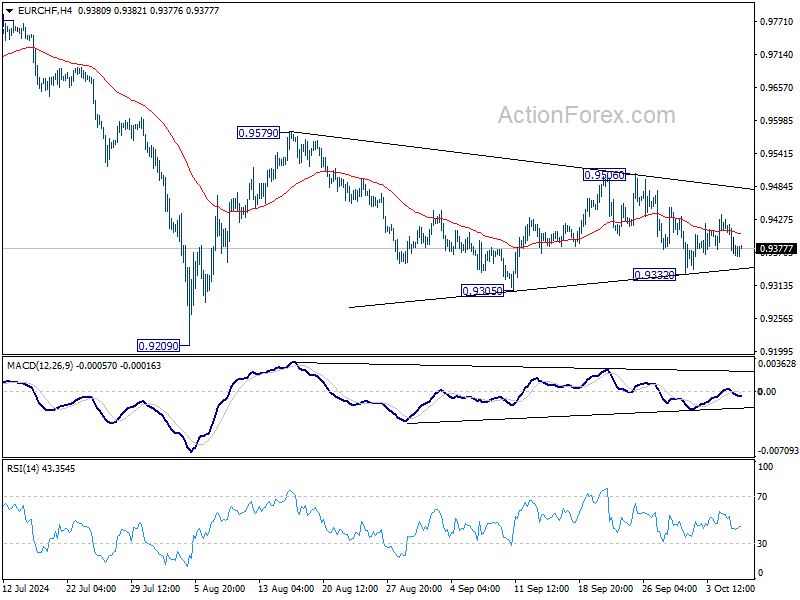
Daily Pivots: (S1) 0.9352; (P) 0.9391; (R1) 0.9416; More....
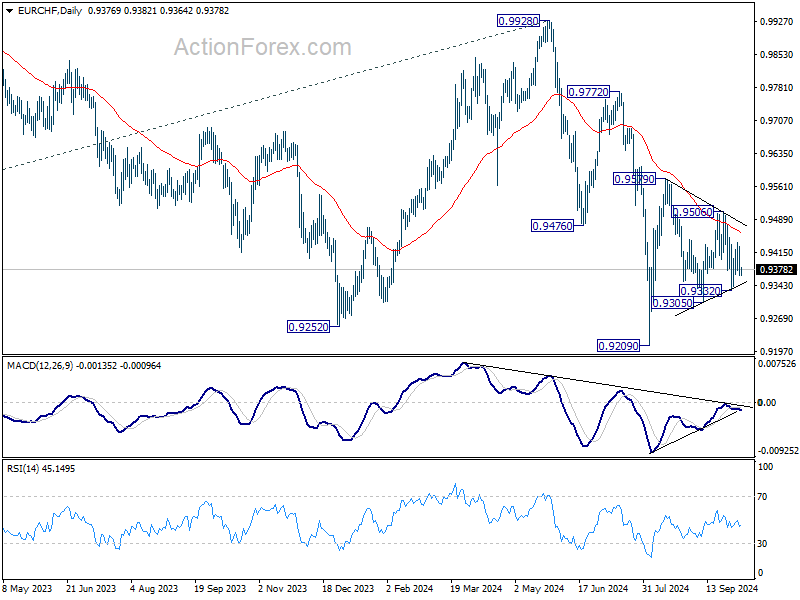
Intraday bias in EUR/CHF stays neutral and outlook is unchanged. For now, the favored case is that rise from 0.9209 low is not finished yet. Break of 0.9506 will turn intraday bias to the upside for 0.9579 resistance and above. However, break of 0.9332 will dampen this view and bring deeper decline through 0.9305 support instead.
In the bigger picture, medium term corrective pattern from 0.9407 (2022 low) might have completed with three waves to 0.9928. Decisive break of 0.9252 (2023 low) will confirm long term down trend resumption. Next target will be 61.8% projection of 1.1149 to 0.9407 from 0.9928 at 0.8851. For now, outlook will stay bearish as long as 0.9928 resistance holds, even in case of strong rebound.
GBP/JPY Daily Outlook
Daily Pivots: (S1) 192.94; (P) 194.28; (R1) 195.23; More...
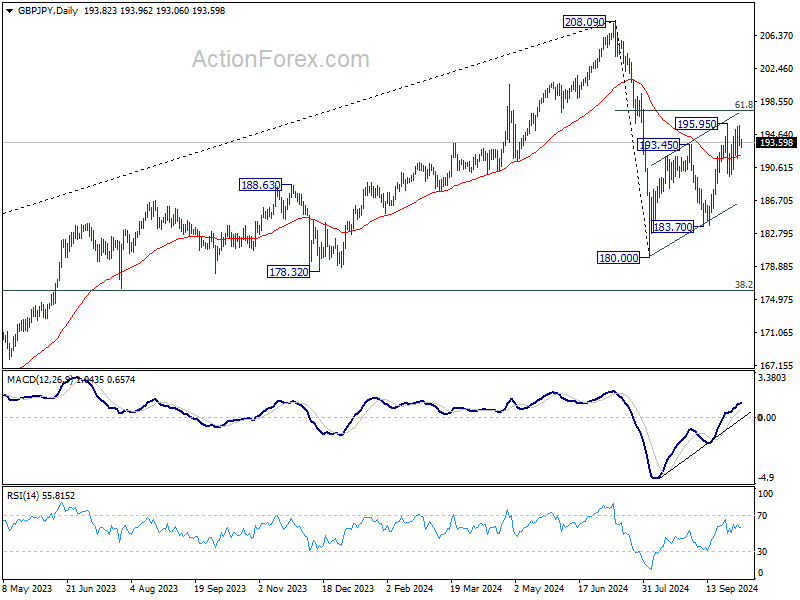
Intraday bias in GBP/JPY stays neutral at this point. On the upside break of 195.95 will resume whole rise from 180.00 to 61.8% retracement of 208.09 to 180.00 at 197.35 next. On the downside, break of 189.54 will turn bias back to the downside for 183.70 support instead.
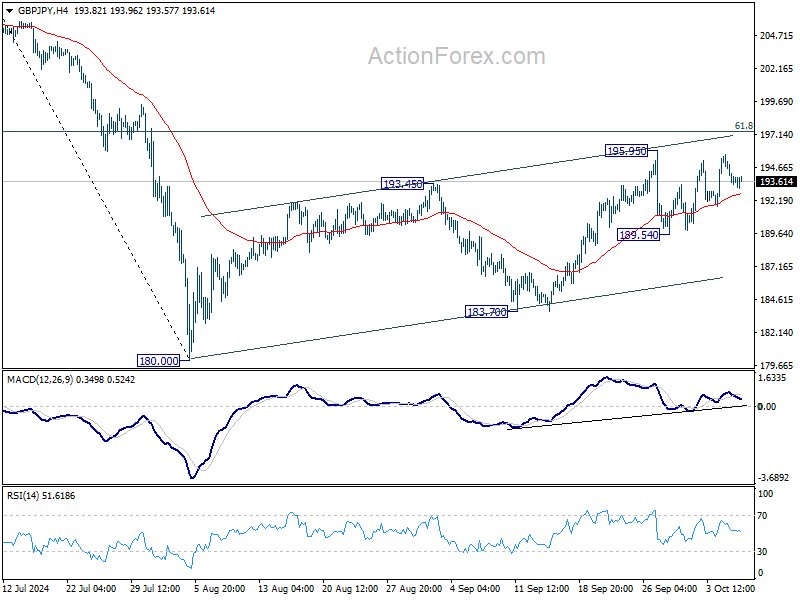
In the bigger picture, price actions from 208.09 are seen as a correction to whole rally from 123.94 (2020 low). The range of consolidation should be set between 38.2% retracement of 123.94 to 208.09 at 175.94 and 208.09. However, decisive break of 175.94 will argue that deeper correction is underway.
EUR/JPY Daily Outlook
Daily Pivots: (S1) 162.08; (P) 162.83; (R1) 163.37; More....
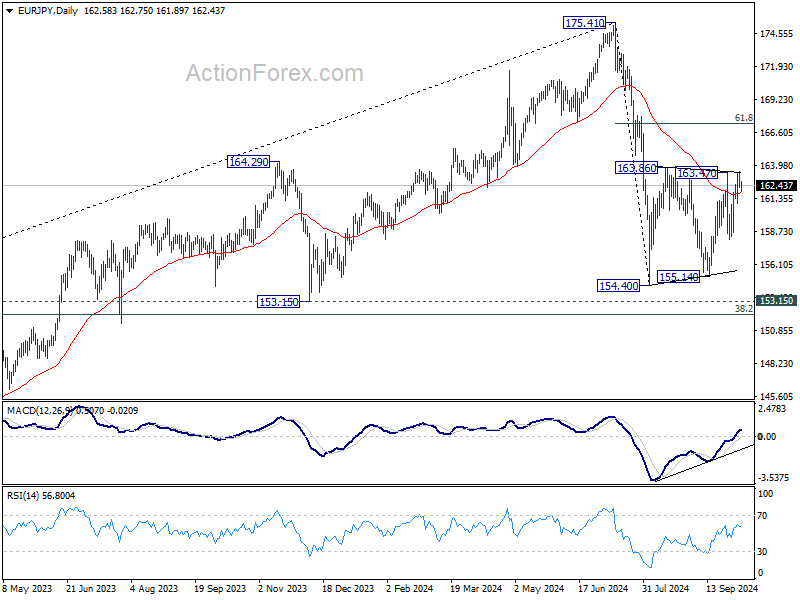
Intraday bias in EUR/JPY remains neutral and outlook is unchanged. On the upside, break of 163.47 resistance will resume the rebound from 154.40 to 61.8% retracement of 175.41 to 154.40 at 167.38. On the downside, break of 158.09 will bring deeper fall back to 154.40/155.14 support zone instead.
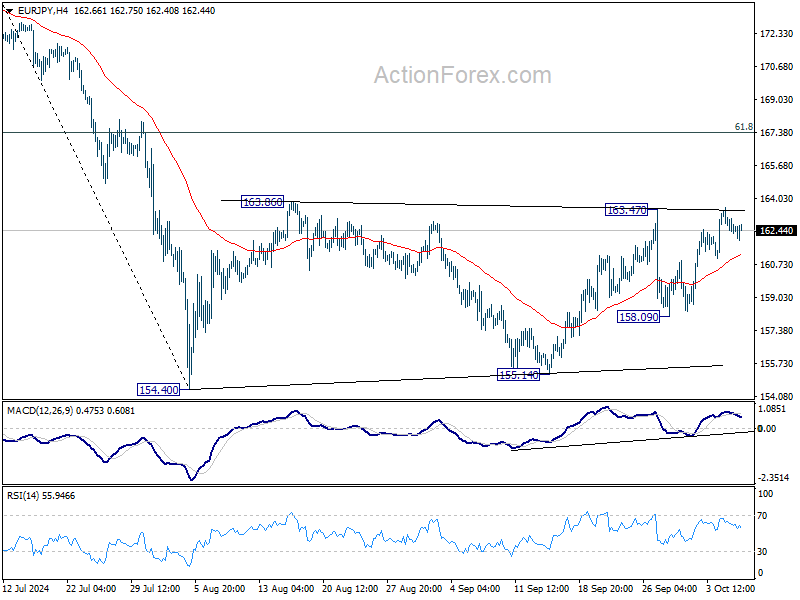
In the bigger picture, price actions from 175.41 are seen as correction to rally from 114.42 (2020 low). The range of consolidation should have been set between 38.2% retracement of 114.42 to 175.41 at 152.11 and 175.41 high. However, decisive break of 152.11 would argue that deeper correction is underway.
EUR/GBP Daily Outlook
Daily Pivots: (S1) 0.8363; (P) 0.8381; (R1) 0.8407; More...
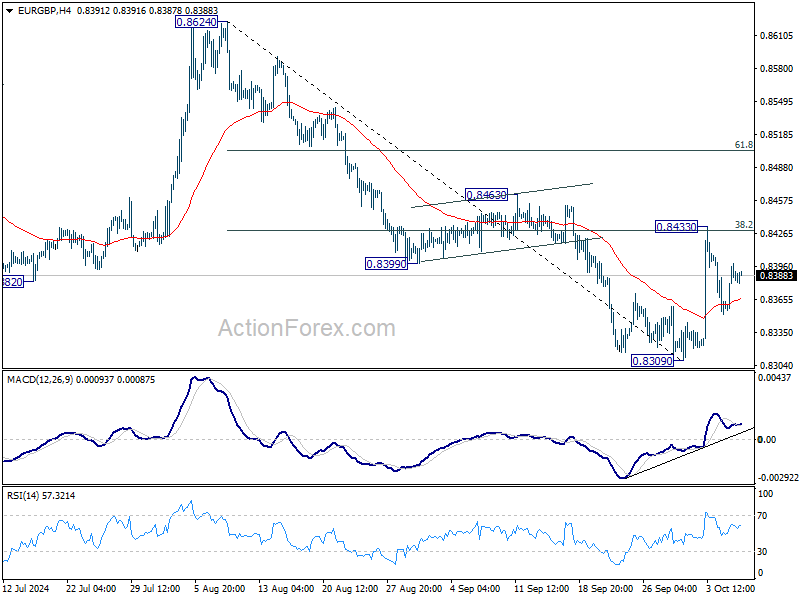
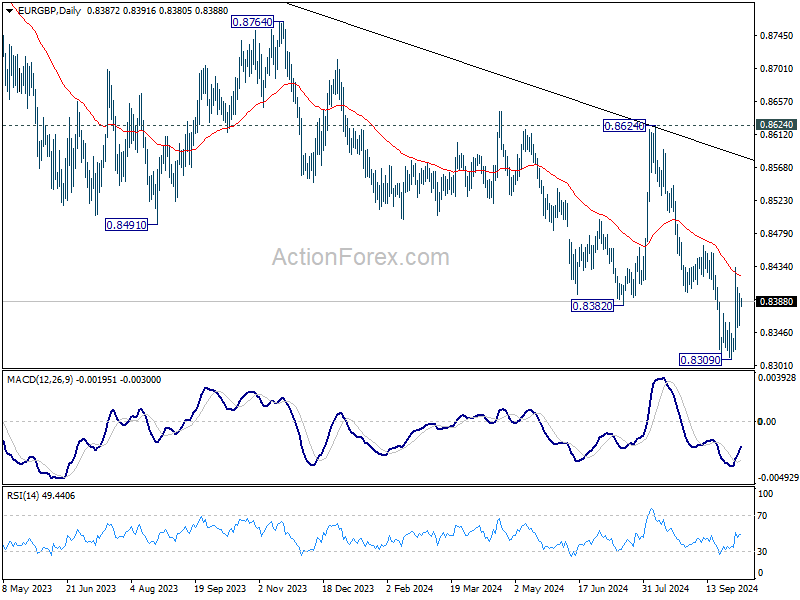
Intraday bias in EUR/GBP stays neutral at this point. Also, near term outlook remains bearish. On the downside, break of 0.8309 will resume larger down trend to 0.8201 key support next. However, decisive break of 38.2% retracement of 0.8624 to 0.8309 at 0.8429 will pave the way to 61.8% retracement at 0.8504 and possibly above.
In the bigger picture, down trend from 0.9267 (2022 high) is in progress. Next target is 0.8201 (2022 low), but strong support should be seen there to bring rebound. However, outlook will remain bearish as long as 0.8624 resistance holds even in case of strong rebound.
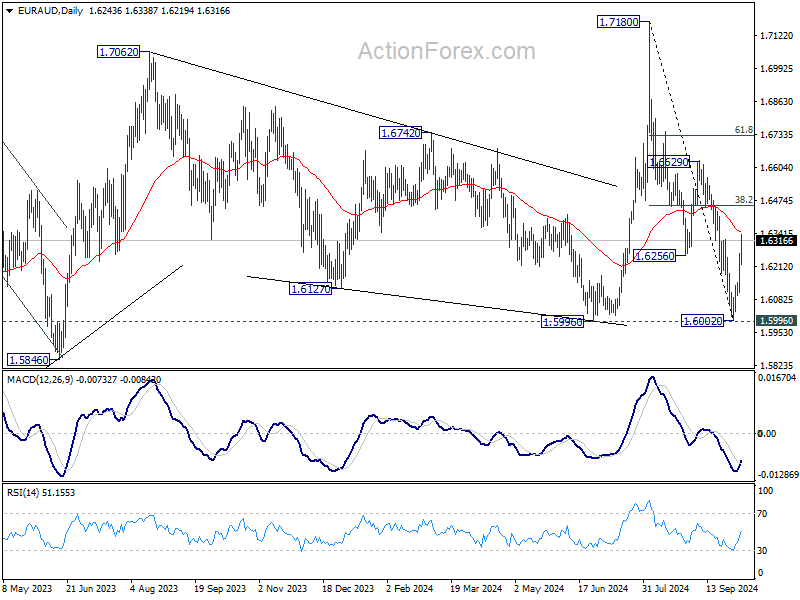
EUR/AUD Daily Outlook
Daily Pivots: (S1) 1.6144; (P) 1.6204; (R1) 1.6302; More...
EUR/AUD's strong break of 1.6184 resistance confirms short term bottoming at 1.6002, after defending 1.5996 support. Intraday bias is back on the upside for 38.2% of 1.7180 to 1.6002 at 1.6452. Decisive break there will strengthen the case that whole corrective fall from 1.7180 has completed with three waves down to 1.6002. Further rally should then be seen to 61.8% retracement at 1.6730 next.
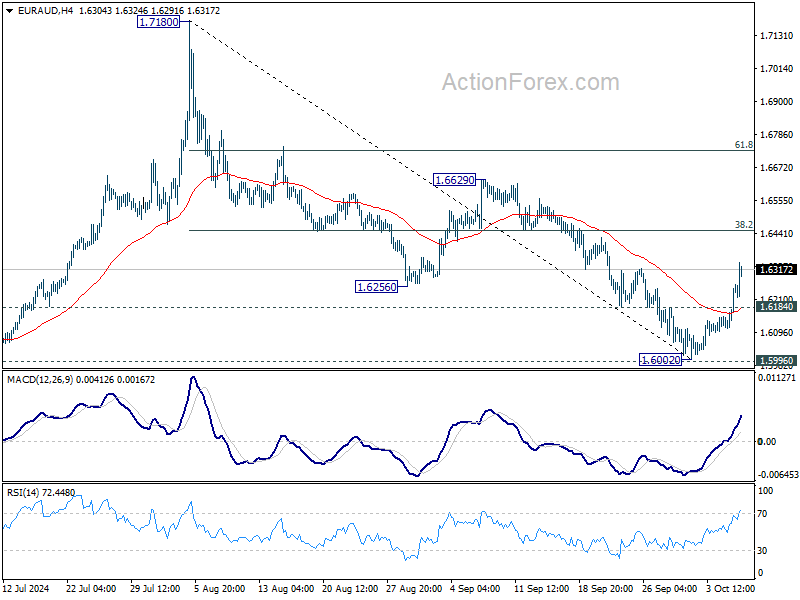
In the bigger picture, as long as 1.5996 support holds, up trend from 1.4281 (2022 low) is still expected to resume at a later stage. However, decisive break of 1.5996 will argue that the medium term trend has reversed and turn outlook bearish.
Aussie Leads Risk-Driven Declines, HSI Sinks as China Stimulus Falls Short
Hong Kong markets experienced another day of intense volatility, with benchmark HSI plunging over -5% during the morning session as traders rushed to lock in profits from the recent rally. The sell-off came as disappointment spread among investors after China's National Development and Reform Commission failed to deliver concrete details on further stimulus measures, following weeks of anticipation. China's stock market, which reopened after the Golden Week holiday, initially surged by more than 10%, but momentum fizzled, leaving gains halved by the session’s end.
The state planner’s chairman, Zheng Shanjie, made several pledges to support the struggling property market and bolster domestic demand. However, the market's reaction turned sour as the announcement lacked significant new stimulus initiatives. A senior official added that a CNY 100B investment plan for 2025 would be unveiled by the end of this month, but that reassurance fell short of calming investor concerns. Without fresh, larger-scale measures, sentiment remains fragile.
Australian Dollar was notably hit in the wake of the risk-off mood, leading declines across commodity currencies. Despite positive domestic data showing strong rebound in consumer sentiment and improving business confidence, the Aussie couldn’t escape the regional downturn. RBA's meeting minutes also confirmed that the central bank was not yet close to considering a rate cut. However, optimism around domestic fundamentals was easily overshadowed by the souring risk sentiment across Asia, pulling the Aussie lower.
In the currency markets, Euro stood out as the strongest performer for the day so far, followed by Yen and British Pound, as investors shifted away from riskier assets. Dollar was on the softer side, with traders taking a more cautious stance ahead of key US inflation data later this week. Overall, the focus was primarily on selling off commodity-linked currencies amid the risk aversion.
Technically, US 10-year yield extended the rebound from 3.603 and closed above 4% mark overnight. For now, further rally is expected as long 55 D EMA (now at 3.885) holds. Next target is 38.2% retracement of 4.997 to 3.603 at 4.135. Strong resistance could be seen there to limit upside, at least first attempt. However, decisive break there will affirm that whole correction from 4.997 has completed with three wave down to 3.603. This development would have bullish implications for yields and will be a focal point as US CPI data release approaches this week.
In Asia, at the time of writing, Nikkei is down -1.25%. Hong Kong HSI is down -5.58%. China Shanghai SSE is up 4.81%. Singapore Strait Times is flat. Japan 10-year JGB yield is up 0.004 at 0.930. Overnight, DOW fell -0.94%. S&P 500 fell -0.96%. NASDAQ fell -1.18%. 10-year yield rose 0.045 to 4.026.
RBA minutes: Inflation vigilance remains key focus
Minutes from RBA's September meeting revealed the consensus to keep the cash rate unchanged, as members felt there had been no significant changes since the previous meeting to justify a shift in policy.
Members discussed scenarios that could lead to policy being "held restrictive for a prolonged period or tightened further". One scenario involved stronger-than-expected "consumption growth", driven by rising household disposable income. Another involved more "constrained" than expected "aggregate supply" outlook. Financial conditions could turn out to be "insufficiently restrictive".
Conversely, they acknowledged scenarios where policy could become less restrictive, such as the economy proved to be "significantly weaker than expected". Or, "inflation proved less persistent than assumed", even without significant economic weakness.
The board reiterated their vigilance to "upside risks to inflation" and emphasized that policy will remain sufficiently restrictive until inflation is clearly moving toward target. They reiterated that future rate changes could not be "ruled in or ruled out" based on current data, leaving the door open for adjustments if necessary.
Australian Westpac consumer sentiment hits 2.5-year high as rate hike fears ease
Australia's Westpac Consumer Sentiment surged by 6.2% yoy in October to 89.8, marking the highest reading since RBA began its tightening cycle two and a half years ago.
Westpac noted that consumer sentiment has been buoyed by interest rate cuts overseas and improving inflation conditions domestically. "Consumers are no longer fearful that the RBA could take interest rates higher," Westpac commented.
In particular, the Mortgage Rate Expectations Index, which tracks expectations for variable mortgage rates over the next 12 months, saw a significant drop of -14.1% mom to 106.4. The index has now declined by one-third since July, as households feel less pressure from future rate increases.
Westpac anticipates that RBA's cash rate target will remain unchanged for the rest of the year. While Q3 CPI data, due on October 30, is expected to show inflation tracking lower, it may not be enough for RBA to "shift to an explicit easing bias" at the November meeting. However, Westpac believes the Board could begin easing its "hawkish hold" and adopt a more neutral policy stance as inflation pressures show signs of abating.
Australia's NAB business confidence improves to -2, inflation pressures still high despite easing costs
Australia’s NAB Business Confidence improved in September, rising from -5 to -2. Business conditions also increased from 4 to 7, with key components such as trading conditions rising from 8 to 12, profitability up from 2 to 5, and employment conditions also climbing from 1 to 5.
A key positive development was the continued easing in input cost pressures. Labour cost growth slowed to 1.7% in quarterly equivalent terms, down from 1.8% in August. Purchase cost growth eased to 1.2%, from 1.6%.
NAB’s Head of Australian Economics, Gareth Spence, noted that while business conditions have been trending lower over the past 24 months due to slower economic growth, capacity utilization remains significantly above its long-run average.
Spence remarked, “This remains an important dynamic for the RBA where, despite slow growth, inflation remains too high, suggesting that the balance of supply and demand in the economy is yet to fully normalize.”
Japan's real wages fall -0.6% yoy in Aug as inflation outpaces wage growth
Japan's real wages declined by -0.6% yoy in August, marking the first drop in three months. Nominal wages rose for the 32nd consecutive month, increasing by 3.0% yoy, slightly missed market expectations of 3.1% .
The wage growth was not enough to offset inflationary pressures. The CPI used to calculate real wages, which includes fresh food prices but excludes owners' equivalent rent, surged by 3.5% yoy in August, the highest increase since October 2023.
On a positive note, base wages (excluding bonuses and overtime) saw a significant 3.0% yoy increase, the largest rise in nearly 32 years. Overtime pay grew by 2.6% yoy. However, these gains were still outpaced by inflation.
In other data, household spending fell -1.9% yoy in August, but the decline was less severe than the market's expected drop of -2.6%.
Fed's Musalem urges patience as Kashkari flags shifting balance of risks
In a speech overnight, St. Louis Fed President Alberto Musalem noted last week's employment report, despite exceeding expectations, did not prompt him to alter his baseline outlook for the economy. He added that both inflation and the labor market are currently in a "good place," with risks to the Fed's dual mandate—price stability and full employment—"roughly balanced."
Nevertheless, Musalem expressed caution, arguing that the "costs of easing too much too soon" would outweigh the risks of easing too little. He added that should maintain its approach of "gradual reductions" in interest rates over time, highlighting that "patience" has been key to Fed’s progress on inflation. He maintained that this approach "has served the FOMC well" but was careful not to commit to any specifics regarding the size or timing of future rate cuts.
Separately, Minneapolis Fed President Neel Kashkari echoed Musalem’s sentiment regarding the resilience of the labor market, noting, “It looks like it is still a strong labor market.”
Kashkari acknowledged that traditionally, Fed’s aggressive rate hikes would have led to more significant weakness in employment, but so far, that hasn’t materialized. "We have not seen that, so that's a really good fact that the job market has stayed strong while inflation has come down," Kashkari said.
However, Kashkari did caution that the balance of risks is now shifting "away from higher inflation towards maybe higher unemployment".
ECB's Cipollone sees slower growth and faster inflation deceleration
ECB Executive Board member Piero Cipollone suggested in an interview that growth may come in "a little bit slower" than previously expected. Weak PMI data is also raising concern. The "signals coming from the real side of the economy are a little bit weak", he added.
Cipollone also noted that inflation is "decelerating faster" than anticipated. "So we will get all this information and reassess the situation on the next monetary policy meeting," he said.
Separately, Governing Council member Robert Holzmann emphasized that, while inflation is "on the right track," core inflation remains problematic. He attributed much of the recent inflation drop to lower energy costs but warned that the underlying inflation picture still "doesn't look so good." Holzmann, who backed the September rate cut, cautioned against assuming that further rate cuts are imminent.
Looking ahead
Germany industrial production and France trade balance will be released in European session. Later in the day, both the US and Canada will publish trade balance too.
EUR/AUD Daily Outlook
Daily Pivots: (S1) 1.6144; (P) 1.6204; (R1) 1.6302; More...
EUR/AUD's strong break of 1.6184 resistance confirms short term bottoming at 1.6002, after defending 1.5996 support. Intraday bias is back on the upside for 38.2% of 1.7180 to 1.6002 at 1.6452. Decisive break there will strengthen the case that whole corrective fall from 1.7180 has completed with three waves down to 1.6002. Further rally should then be seen to 61.8% retracement at 1.6730 next.
In the bigger picture, as long as 1.5996 support holds, up trend from 1.4281 (2022 low) is still expected to resume at a later stage. However, decisive break of 1.5996 will argue that the medium term trend has reversed and turn outlook bearish.
RBA minutes: Inflation vigilance remains key focus
Minutes from RBA's September meeting revealed the consensus to keep the cash rate unchanged, as members felt there had been no significant changes since the previous meeting to justify a shift in policy.
Members discussed scenarios that could lead to policy being "held restrictive for a prolonged period or tightened further". One scenario involved stronger-than-expected "consumption growth", driven by rising household disposable income. Another involved more "constrained" than expected "aggregate supply" outlook. Financial conditions could turn out to be "insufficiently restrictive".
Conversely, they acknowledged scenarios where policy could become less restrictive, such as the economy proved to be "significantly weaker than expected". Or, "inflation proved less persistent than assumed", even without significant economic weakness.
The board reiterated their vigilance to "upside risks to inflation" and emphasized that policy will remain sufficiently restrictive until inflation is clearly moving toward target. They reiterated that future rate changes could not be "ruled in or ruled out" based on current data, leaving the door open for adjustments if necessary.
(RBA) Minutes of the Monetary Policy Meeting of the Reserve Bank Board
Hybrid – 23 and 24 September 2024
Members participating
Michele Bullock (Governor and Chair), Andrew Hauser (Deputy Governor), Carolyn Hewson AO, Steven Kennedy PSM, Iain Ross AO, Elana Rubin AM, Carol Schwartz AO, Alison Watkins AM
Members had granted leave of absence to Ian Harper AO, in accordance with section 18A of the Reserve Bank Act 1959.
Others participating
Sarah Hunter (Assistant Governor, Economic), Brad Jones (Assistant Governor, Financial System), Christopher Kent (Assistant Governor, Financial Markets)
Anthony Dickman (Secretary), David Norman (Deputy Secretary)
Meredith Beechey Osterholm (Future Hub), Susan Black (Acting Head, Domestic Markets Department), Andrea Brischetto (Head, Financial Stability Department), Sally Cray (Chief Communications Officer), Michael Plumb (Head, Economic Analysis Department), Penelope Smith (Head, International Department)
Economic conditions
Members began their discussion by noting that the economic data received since the previous meeting had been broadly in line with the staff’s expectations.
Recent data on inflation had been consistent with a further gradual easing in underlying inflationary pressures. Looking ahead, monthly CPI data for August – to be released the day after the meeting – were expected to show a sharp decline in headline inflation, partly because of federal and state government cost-of-living relief. But underlying inflation was expected to remain above target. Inflation for some components had remained high and persistent, but the easing in the rate of growth in advertised rents over the preceding three months was expected to feed through gradually to lower rent inflation in the CPI.
Growth in GDP in the June quarter had been in line with the staff’s expectations. However, the composition of that growth suggested somewhat less underlying momentum in aggregate demand than the staff had assumed. Notably, household consumption had been significantly weaker than expected, while the offsetting stronger-than-expected outcomes were in components that tended to be more volatile from quarter to quarter. Members observed that weak growth in output was closing the gap between aggregate demand and the economy’s estimated supply capacity, but that the two were not yet aligned.
Members discussed the implications of the weaker-than-expected outcome for household consumption in the June quarter. This was seen to have reflected a combination of a genuine slowing in momentum and the unwinding of one-off spending in the March quarter. Bank transaction data suggested that the recent weakness in household spending had been broadly based across different types of households, including those without mortgages. Strong growth in government consumption – which includes the provision of services to households – meant that overall consumption growth had been more resilient than implied by household consumption alone but was still below its pre-pandemic average.
A key question was how spending was evolving in the September quarter. The staff had previously forecast household consumption to strengthen in response to a recovery in real incomes, including because of the implementation of the Stage 3 tax cuts in July. Members considered whether this forecast was still consistent with available timely indicators of household spending, including the signals derived from bank transaction data and retail sales. These suggested that growth in spending had been weak in July but had strengthened somewhat in August. Retailers in the RBA’s liaison program had reported that conditions had remained stable over prior months and were generally expected to stay that way over coming months. Based on this information, members judged that it was still reasonable to expect a pick-up in consumption growth over the second half of the year, but it was too soon to form firm views based on these partial indicators and there was some risk that the pick-up could be somewhat slower than previously expected. Members also noted that the official statistical treatment of the cost-of-living subsidies provided to households would have the effect of reallocating measured spending in the September quarter from household to public consumption.
Turning to the prospects for trade, members noted that global economic indicators had been somewhat weaker over preceding months. The outlook for the Chinese economy had softened and this had been reflected in weaker demand for iron ore and lower commodity prices, despite the earlier easing of monetary policy. In many advanced economies, conditions in labour markets had eased materially and job vacancies had returned to pre-pandemic levels, unlike in Australia. Inflation had also declined in these economies and central banks had become more confident of returning inflation sustainably to target. In that context, some central banks – including the US Federal Reserve – had focused on downside risks to labour markets in recent communications.
The cap on international student commencements to be applied to the higher education and vocational education and training sectors in Australia from 2025 was expected to weigh on services exports. Members noted that the cap was in addition to the earlier tightening in requirements for student visa applicants, which had already seen a fall in student visa grants. However, the implications of lower student arrivals for the balance between aggregate demand and supply, and hence for the inflation outlook, were less clear. Lower numbers of international student arrivals would be likely to reduce aggregate demand (including for housing), but also lower growth in population and therefore the economy’s supply capacity. The implications of these various effects would be assessed more carefully as part of the subsequent forecast update.
Members judged that labour market conditions in Australia were still tight relative to both full employment and conditions in other economies. The share of unemployed people finding jobs was high and the share of workers losing their jobs was very low. Conditions had nonetheless continued to ease as expected and indicators of future labour market conditions suggested that would continue. The unemployment rate had increased a little over preceding months as strong growth in the supply of labour (including through higher participation) was only partially absorbed by solid employment growth. Members noted that the rise in participation reflected a combination of jobs being readily available and the effect of financial pressures from the higher cost of living.
Members considered medium-term developments in labour productivity growth, which remained subdued. In part, that reflected a rising share of employment in the non-market sector, where measured productivity had declined over prior years. However, productivity outcomes had also been weak in a range of market industries, a trend evident in many other economies. Overall, the information received from the June quarter national accounts had reinforced concerns about future growth in supply. In turn, this could have implications for the sustainable pace of wages growth. Members noted that wages growth had continued to ease in the June quarter from high levels, broadly as expected.
Financial conditions
Members commenced their discussion of financial conditions by noting that several advanced economy central banks had reduced their policy rates since the previous meeting, in response to easing labour market conditions and progress in returning inflation sustainably to target; they had also communicated that further policy easing was likely. Market participants expected policy rates to reach central bank estimates of neutral levels by around the end of 2025. An exception was the Bank of Japan, which had communicated that it would be appropriate to raise its policy rate further from current low levels if underlying inflation increased as forecast.
Financial market conditions had been calmer following the bout of extreme volatility around the time of the previous meeting. However, several of the factors that had contributed to the volatility remained in place, such as elevated risk-taking and leveraged positions.
Members noted that financial market pricing across a range of asset classes in advanced economies was consistent with expectations of a soft economic landing. Sovereign bond yields in most advanced economies had declined further since the August meeting, reflecting both an easing in expectations for policy rates and a decline in inflation expectations. Other measures of financial conditions had also eased as volatility subsided and risk premia declined. Corporate bond yields in the United States and European countries had declined to year-to-date lows, including because of narrower spreads to sovereign bonds.
In China, weakness in the property sector had continued to weigh on credit demand and economic activity. Authorities had intervened to lean against declines in longer term government bond yields and the renminbi had appreciated alongside a narrowing of China–US interest rate differentials.
The Australian dollar trade-weighted index had traded within the range observed since early 2022, despite some volatility around the time of the August meeting. The exchange rate had been affected by a widening in yield differentials arising from market participants’ expectations that other central banks would reduce their policy rates by more than the RBA. The effect of this on the exchange rate had been offset somewhat by declines in commodity prices.
Members judged that Australian financial conditions remained restrictive overall but had eased somewhat over preceding months. Market expectations for the path of the cash rate were materially lower than a few months earlier, and bond yields and some lending and deposit rates had declined in tandem. Housing credit growth had also gradually increased, and business credit growth was above its average pace since the global financial crisis. Funding conditions more generally for Australian financial and non-financial corporations remained favourable. Members discussed the implications of this for future business investment and concluded that it seemed unlikely financial conditions would be a binding constraint on investment for most businesses.
While market expectations for the path of the cash rate were lower than a few months earlier, members noted that they had risen in response to the Governor’s comments that, based on data to hand at the August meeting, the Board did not expect to lower rates in the near term. Market pricing suggested that participants expected the RBA to start cutting the cash rate from around late 2024 or early 2025, but at a more gradual pace than that expected in several other advanced economies. That was consistent with the fact that policy rates in most other advanced economies had been increased earlier and to more restrictive levels than in Australia, and that inflation appeared to be returning sustainably to target more quickly in those economies. Market expectations were nevertheless for the stance of monetary policy in those countries (as measured by gaps between the policy rate and central bank estimates of the neutral interest rate) to be more restrictive than in Australia until around late 2025.
Financial stability assessment
Members discussed the staff’s semi-annual assessment of financial stability risks. In the context of an easing in inflation globally and an uncertain economic outlook, the staff’s assessment was that vulnerabilities in the global financial system remain. Three vulnerabilities stood out as having the potential to affect financial stability in Australia significantly, namely:
- increased complexity and interconnectedness in the financial system, in part reflecting digitalisation and rapid technological development, had created operational vulnerabilities and central points of failure
- low market risk premia had raised the prospect of a disorderly adjustment in financial asset prices, including if expectations for a soft landing in the global economy were not realised and particularly in the context of rising government debt and the absence of medium-term fiscal frameworks
- longstanding vulnerabilities in the Chinese financial system – affecting banks, non-banks and local governments – had been exacerbated by the ongoing weakness in the Chinese real estate sector.
Members observed the potential for global threats originating from outside the financial system, such as geopolitical risks and climate change, to interact with these vulnerabilities with adverse effects. For example, heightened geopolitical tensions had increased the prospect of cyber-attacks that could have systemic implications. Members noted that the RBA is working with market participants and the other agencies of the Council of Financial Regulators to strengthen the operational resilience of the Australian financial system.
Domestically, members recognised that financial pressures from persistent inflation and restrictive monetary policy meant many households were having to make difficult adjustments to their spending and financial arrangements. At the same time, risks to the Australian financial system from lending to households and businesses remained contained. In part, that reflected the fact that banks had maintained prudent lending standards and built substantial capital over recent years, leaving them well positioned to continue supporting the economy through credit provision. But it also reflected the fact that the share of borrowers experiencing severe financial stress had remained small, with housing loan arrears having increased only gradually from low levels. The increase was greatest for highly leveraged borrowers, but these comprised a very small share of lending. Very few borrowers were in negative equity.
Members observed that borrowers’ resilience had been supported by prevailing savings buffers and the ongoing strength in the labour market. Most borrowers had maintained or added to their mortgage prepayment buffers over the preceding year; that said, there was a range of experiences and some borrowers were regularly drawing on their savings. High-income borrowers were the only group that in aggregate were running down their prepayment buffers, but their buffers remained large and were declining partly to fund discretionary consumption. Most borrowers were still likely to have spare cash flow under a range of plausible scenarios, including one in which there was a marked deterioration in the labour market. A more sustained reduction in inflation would also help to ease financial pressures.
The strong financial position of most businesses prior to the slowing in the economy had supported their ability to navigate the recent period. Members noted that the sharp increase in business insolvencies – particularly for small businesses and in the hospitality sector – partly reflected a period of catch-up following the removal of pandemic-era support. The cumulative level of insolvencies was still below the pre-pandemic trend, and most insolvencies so far had involved small businesses with little debt, limiting the broader spillovers to lenders. The share of banks’ business loans in arrears had remained low.
Members discussed the expansion of business lending by non-banks, as favourable funding conditions had enabled them to claim market share from banks. While there was limited information about the quality of this lending, its small size limited systemic risks. Elsewhere in the non-bank sector, the significant growth of the superannuation sector had increased its importance to the smooth functioning of the financial system. While financial stability risks were limited by most funds having a defined contribution structure in which leverage was restricted, the growing size of the industry underscored the importance of maintaining strong liquidity risk management practices.
Members agreed that financial stability concerns were not a constraint on monetary policy at the time of the meeting. However, looking ahead, they discussed the potential for financial sector vulnerabilities to build if easier financial conditions were to lead higher risk borrowers to take on excessive debt and/or lenders to compete more aggressively by lowering lending standards. Members noted the RBA Review’s recommendation that decisions about monetary and macroprudential policy should be coordinated in such a situation.
Review of the Term Funding Facility
Members discussed the staff review of the Term Funding Facility (TFF), which was one component of the monetary policy package to support the Australian economy during the COVID-19 pandemic. The review concluded that the TFF had met its policy goals, which were to: reinforce the benefits to the economy of a lower cash rate by reducing the funding costs of banks and, in turn, interest rates paid by borrowers; and encourage banks to support businesses during a difficult period. Members agreed that the TFF had contributed effectively to restoring confidence in financial markets, keeping credit flowing and stimulating aggregate demand. They agreed that a facility of this type should remain one of the policy options to be considered if future circumstances warranted the use of unconventional monetary policy.
Members discussed the lessons from the experience with the TFF. They noted the importance of effective contingency planning ahead of considering the use of unconventional monetary policy tools, including ensuring operational readiness, effective risk management and appropriate governance. Members also observed the trade-offs that could be considered in the design of any future scheme. For instance, the fixed rate feature of the TFF was judged at the time to be important to ensure consistency with other elements of the monetary policy package deployed in response to the pandemic, despite bringing greater financial risk to the RBA.
Nearly half of the financial losses stemming from the TFF were because of its extension in September 2020. Members discussed whether that decision was appropriate, given the information available at the time. They highlighted: the international evidence supporting the need for strong action when interest rates are near zero; the value of coordinating with fiscal responses in such circumstances; the extreme uncertainty about the impact of the virus on the economy and of the impending end of the JobKeeper scheme at the time; and the way the TFF reinforced other elements of the monetary policy package. On the other hand, the lack of drawdown by banks until close to the September 2020 deadline signalled that they might not have needed additional funding. In addition, the potential implications for the RBA’s finances of the TFF extension had been subject to only limited stress testing. Members concluded that these observations emphasised the importance of considering a wide range of scenarios when making any future policy decisions involving unconventional monetary policy measures.
The Board agreed to publish the review, which would be accompanied by a speech by the Assistant Governor (Financial Markets).
Considerations for monetary policy
Turning to considerations for the immediate policy decision, members noted that the information received since the previous meeting had been mixed. Taken together, the information had not materially altered their assessment of the economic outlook as of this meeting. Underlying inflation was still too high and, in quarterly terms, had fallen very little over the preceding year.
Output growth remained weak: GDP growth in the June quarter had been in line with expectations but household consumption had been notably weaker than expected. The staff still judged it as likely that consumption growth would pick up alongside the expected recovery in real disposable income in the second half of the year. It was too soon to judge how rapidly this would occur, though higher frequency data suggested there was a risk that it could be delayed somewhat.
Risks around the outlook for Australia’s exports had shifted to the downside since the prior meeting. In part, this reflected a greater prospect of slower global output growth, given further increases in unemployment rates in some countries and the weakness in the Chinese economy. Members observed that services exports were also likely to be weaker than forecast in August because of the various policy measures relating to overseas student numbers. The implications of this for inflation were less clear though, given the potential offsetting implications for labour supply.
Growth in employment had remained solid over prior months, including in comparison with other economies. The unemployment rate had risen gradually but conditions in the labour market still appeared to be tighter than those consistent with sustainable full employment. Members judged that the level of aggregate demand was still above the level of aggregate supply. Weak productivity growth was constraining the economy’s potential growth rate.
Financial conditions had eased over prior months, as cash rate expectations and bond yields declined and equity prices rose. Credit growth had picked up and banks were well placed to support the economy. Members observed that many households were experiencing financial pressure but only a small share of households and firms were not able to service their loans. The exchange rate had appreciated a little but, in trade-weighted terms, was within its range of recent years.
Taken together, members felt that not enough had changed since the previous meeting to alter their assessment that the current level of the cash rate best balanced the risks to inflation and the labour market. They therefore agreed that it was appropriate to leave the cash rate target unchanged at this meeting.
Looking ahead, members reiterated that the data and the evolving assessment of risks would guide their future decisions on what path of interest rates would bring inflation to target within a reasonable timeframe, while preserving the gains in the labour market.
Members then discussed scenarios in which future monetary policy might need to be held restrictive for a prolonged period or tightened further. One of these was if consumption growth were to pick up materially in response to the recovery in real household disposable income that was likely to have begun around mid-year. If that were to occur, labour market outcomes could be stronger than forecast and inflation would return to target more slowly. Another was if the outlook for aggregate supply proved to be more constrained than currently expected – for instance, if the economy’s current supply potential had been overestimated or if future productivity growth turned out to be weaker than assumed. Members also considered a formal analysis in which the economy’s supply capacity was more limited than currently assumed. In this case, the cash rate might need to be noticeably higher than the market path underpinning the August forecasts, in order to bring inflation sustainably back to target by 2026.
Members observed that monetary policy could need to be tightened, even if the Board’s judgements about consumption, the labour market and supply potential prove correct, should present financial conditions turn out to be insufficiently restrictive to return inflation to target. Members noted that the easing in financial conditions over prior months and the pick-up in credit growth made this scenario somewhat more plausible, as did the observation that banks were well placed to facilitate any strengthening in credit demand.
On the other hand, members observed that there were scenarios in which future financial conditions might need to be less restrictive than they were at present. One such scenario was if the economy proved to be significantly weaker than expected and this placed more downward pressure on underlying inflation than expected. This could occur if households saved a significantly larger proportion of their incomes than currently assumed, perhaps because of earlier declines in real income and/or more persistent uncertainty. It could also occur if the labour market weakened more sharply than forecast. Another scenario was if inflation proved less persistent than assumed, even without weaker-than-expected activity. This could occur, for instance, if rent inflation fell more rapidly, falling petrol or other commodity prices materially reduced firms’ cost base or the decline in discretionary spending flowed through materially more quickly to services inflation.
Members noted that each of these outcomes was conceivable given the considerable uncertainty about the economic outlook. Therefore, future financial conditions might need to be either tighter or looser than at present to achieve the Board’s objectives. Members agreed that, while it was important to take account of economic developments abroad, it was not necessary for the cash rate target to evolve in line with policy rates in other economies since Australian inflation was higher, the labour market stronger and monetary policy less restrictive than in many other advanced economies. The exchange rate could also adjust as interest rate differentials between Australia and other economies evolved.
In finalising the Board’s statement, members agreed that it was important to convey that the Board remained vigilant to upside risks to inflation. They also affirmed that monetary policy would need to be sufficiently restrictive until members were confident that inflation was moving sustainably towards the target range and, based on the information available at the time of the meeting, that it was not possible to either rule in or rule out future changes in the cash rate target at this time. Members would rely upon the data and the evolving assessment of risks to guide the Board’s decisions. Returning inflation to target remains the Board’s highest priority and it will do what is necessary to achieve that outcome.
The decision
The Board decided to leave the cash rate target unchanged at 4.35 per cent, and the interest rate on Exchange Settlement balances unchanged at 4.25 per cent.
Australia’s NAB business confidence improves to -2, inflation pressures still high despite easing costs
Australia’s NAB Business Confidence improved in September, rising from -5 to -2. Business conditions also increased from 4 to 7, with key components such as trading conditions rising from 8 to 12, profitability up from 2 to 5, and employment conditions also climbing from 1 to 5.
A key positive development was the continued easing in input cost pressures. Labour cost growth slowed to 1.7% in quarterly equivalent terms, down from 1.8% in August. Purchase cost growth eased to 1.2%, from 1.6%.
NAB’s Head of Australian Economics, Gareth Spence, noted that while business conditions have been trending lower over the past 24 months due to slower economic growth, capacity utilization remains significantly above its long-run average.
Spence remarked, “This remains an important dynamic for the RBA where, despite slow growth, inflation remains too high, suggesting that the balance of supply and demand in the economy is yet to fully normalize.”