Sample Category Title
Rising Treasury Yields Attract Dollar Interest
The dollar index has been on an upward trajectory since late September. Still, the currency market has been late in joining the move in US long-term bonds, where yields are rising following the Federal Reserve’s decisive easing. The idea behind this dynamic, while atypical, is quite simple: decisive interest rate cuts will boost economic growth and inflation in the long run.
Normally, bolder-than-expected monetary easing is a bearish factor. Hence, the typical reaction of the dollar index, which in the second half of September tested the psychological 100 level, below which it spent five days in July 2023 and has not traded consistently below since April 2022.
As is often the case, sustained one-way movements in the government bond market, the so-called smart money, cause other markets to follow the trend. Rising yields have reinvigorated dollar buying, accounting for the 2.5% rise in the DXY in just over a week.
10-year yields have risen above 4% from a local low of 3.6% last month. Technically, yields remain in a downtrend until they break above the 4.4-4.5% range. The market may not encounter significant resistance to these levels, but a break above 4.5% could trigger a strong deleveraging process.
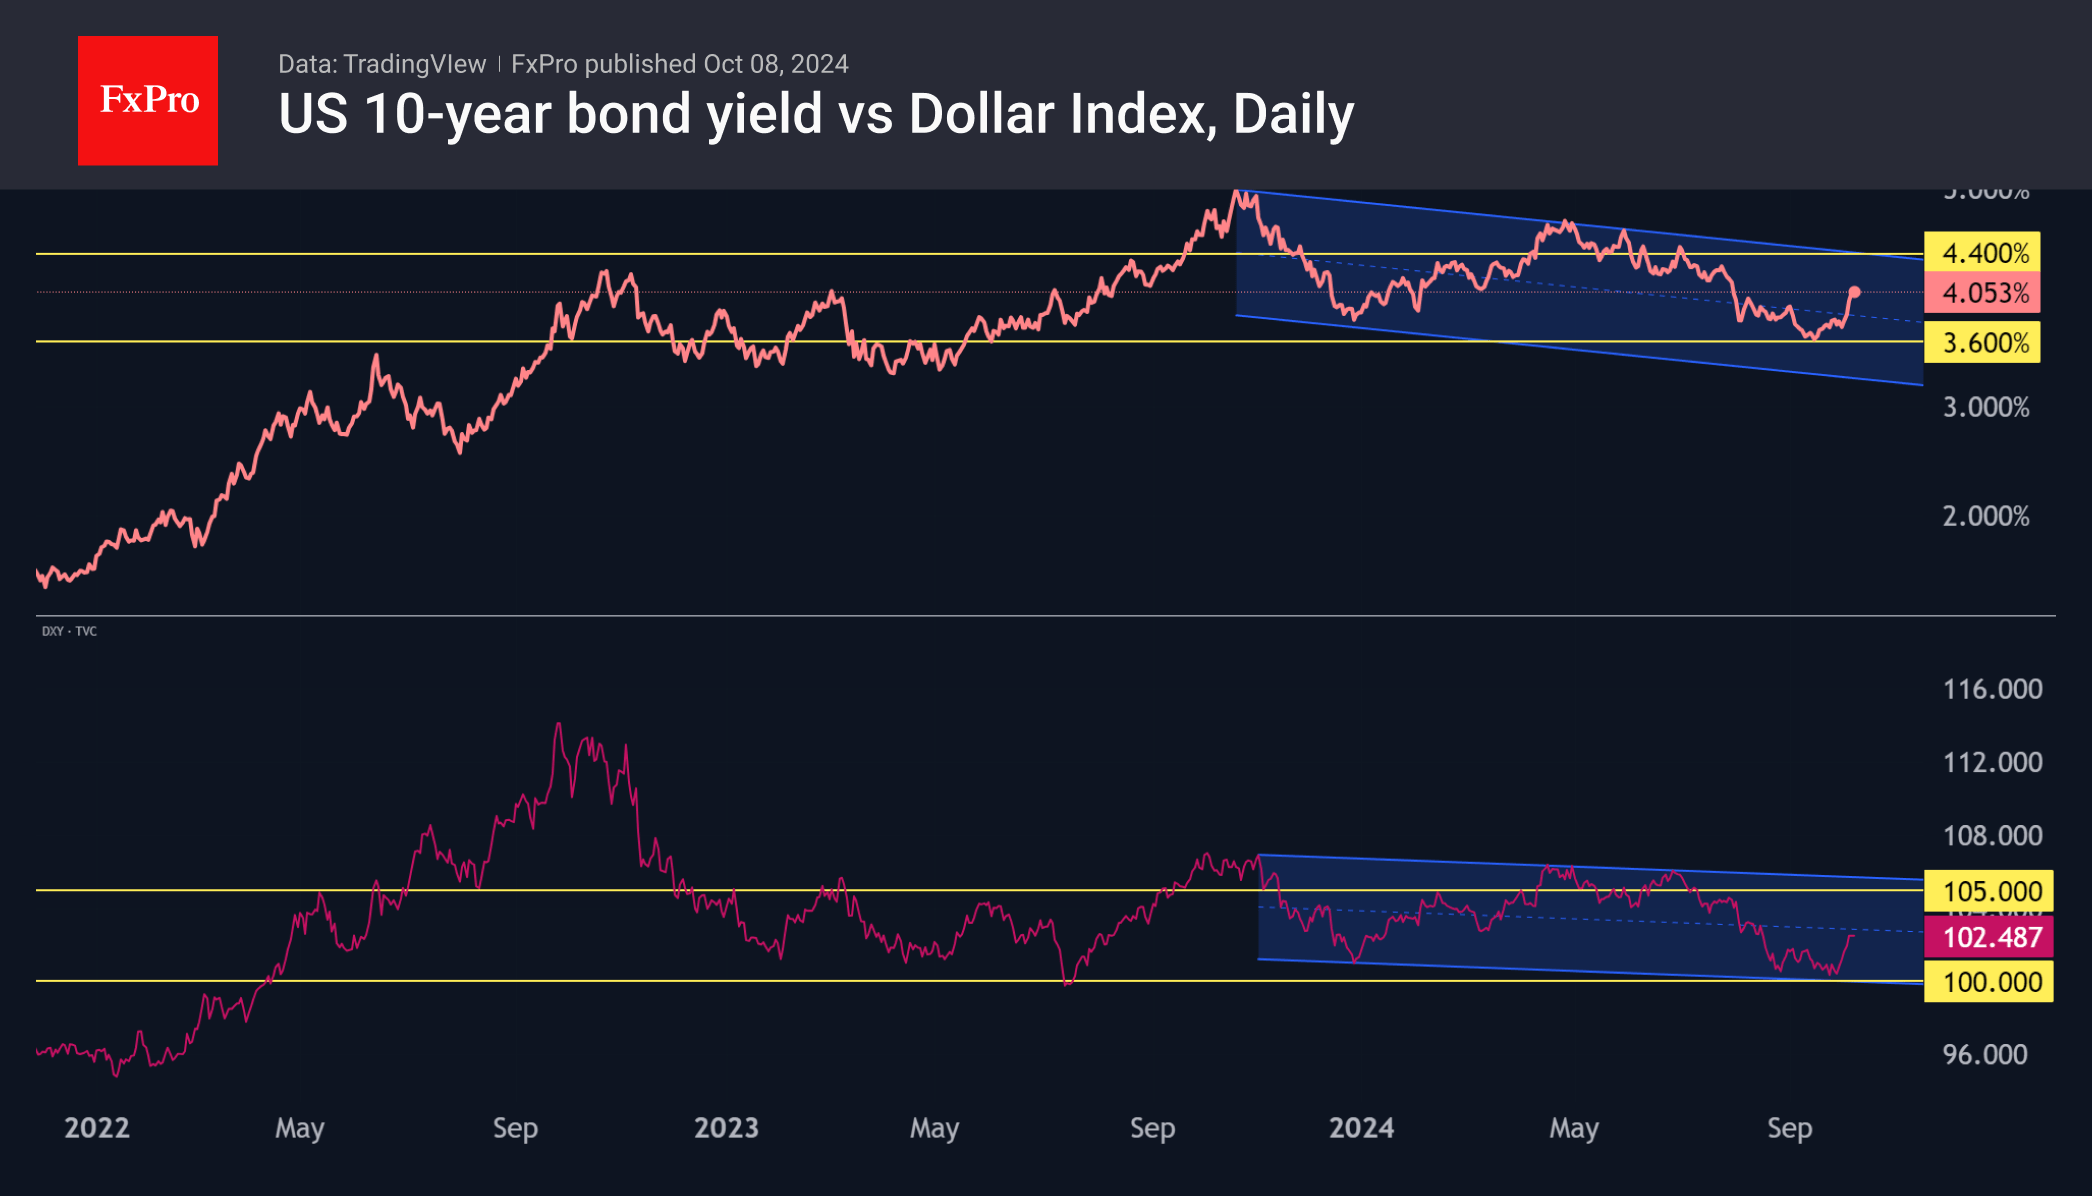
Similarly, the dollar index has light resistance to 105. However, a break above would break the multi-month trend and could strongly accelerate the USD.
For now, the US equity market is in a wait-and-see mode, distracted by the start of the reporting season and hovering near the highs. However, a further rise in yields could well trigger a sell-off in equities, like what happened from July to October 2023.
NZD/USD – RBNZ Poised to Cut, But How Much?
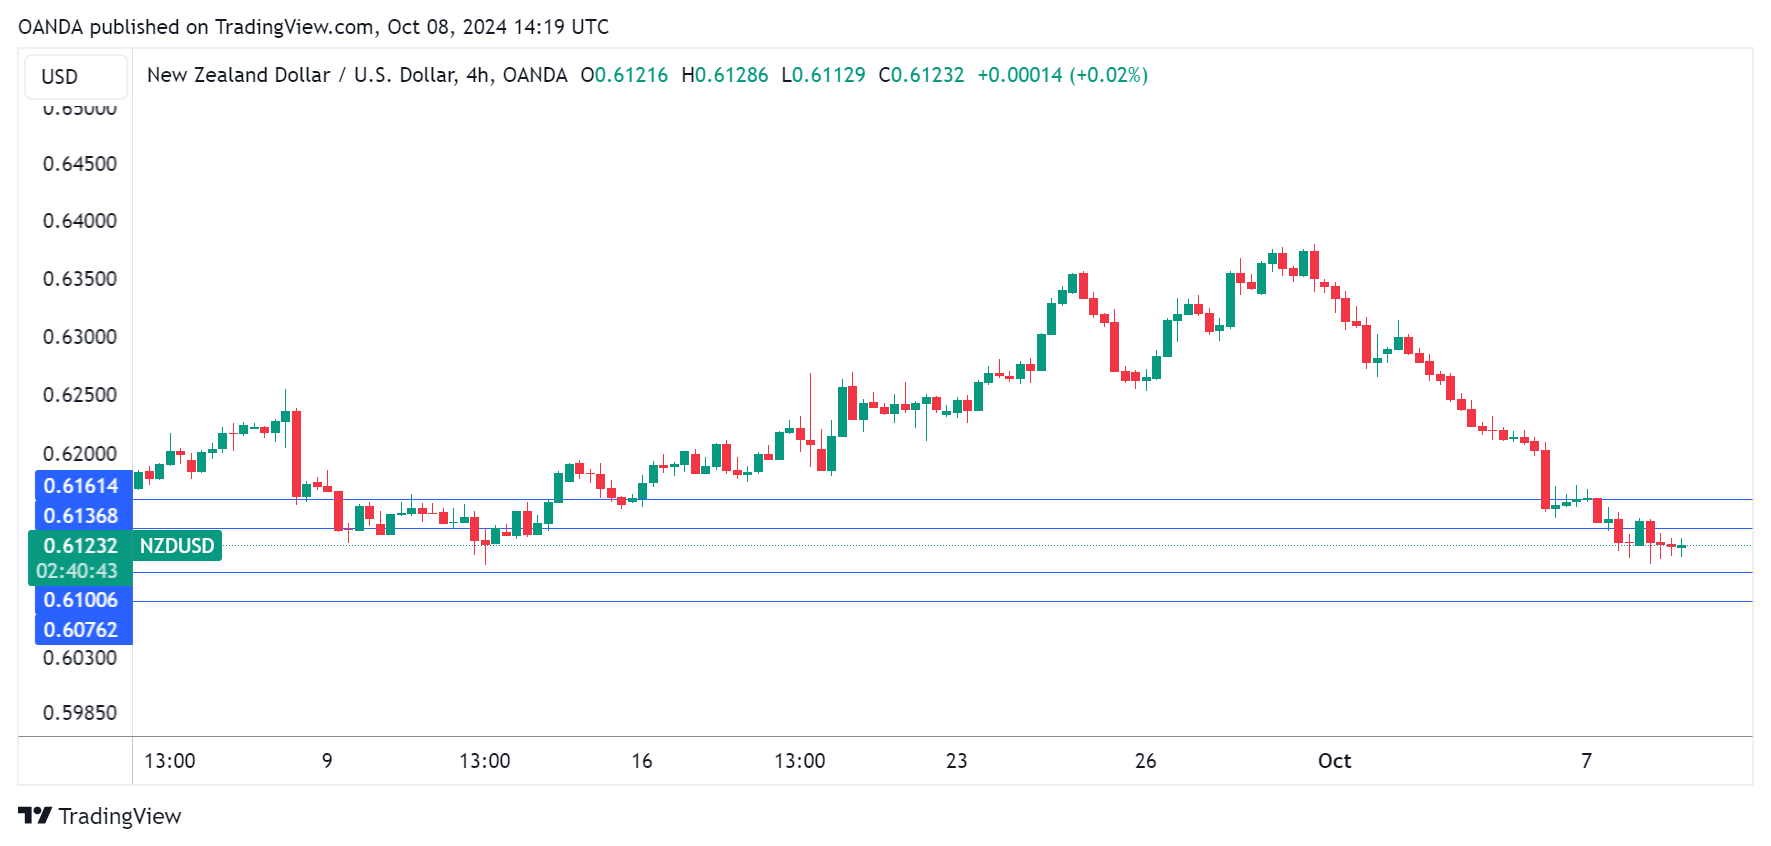
The New Zealand dollar is down for a sixth straight day and has fallen 3.6% during that time. NZD has stabilized on Tuesday and is trading at 0.6120 in the North American session, down 0.07% on the day.
RBNZ expected to chop rates by 50 bps
The Reserve Bank of New Zealand meets on Wednesday and is widely expected to a cut rates, but by how much? The markets have priced in an oversize rate cut of 50 basis points, but a modest cut of 25 bps cannot be ruled out.
The RBNZ joined the rate-cutting club of major central banks in August after holding rates for over a year. The August cut which brought the cash rate down to 5.25%, marked the first rate cut in over four years. That move surprised the markets as the central bank had projected its first rate cut would not take place until mid-2025.
Why would the RBNZ slash by 50 bps? Elevated interest rates have weighed on economic activity and GDP contracted by 0.2% in the second quarter. Inflation eased to 3.3% in the second quarter, closer to the RBNZ’s upper band of the 1-3% target range.
The RBNZ’s latest projections have inflation falling to 2.3% in Q3. The inflation report won’t be released until next week and if the RBNZ chops rates by 50 bps and inflation is higher than the RBNZ estimate, it will put the central bank in an awkward position.
Another factor which supports a 50-bps cut is that the Federal Reserve lowered rates by 50 bps in September, which allows the RBNZ to do the same without risking a sharp decline in the value of the New Zealand dollar.
NZD/USD Technical
- NZD/USD is testing resistance at 0.6137 and 0.6161
- There is support at 0.6100 and 0.6076
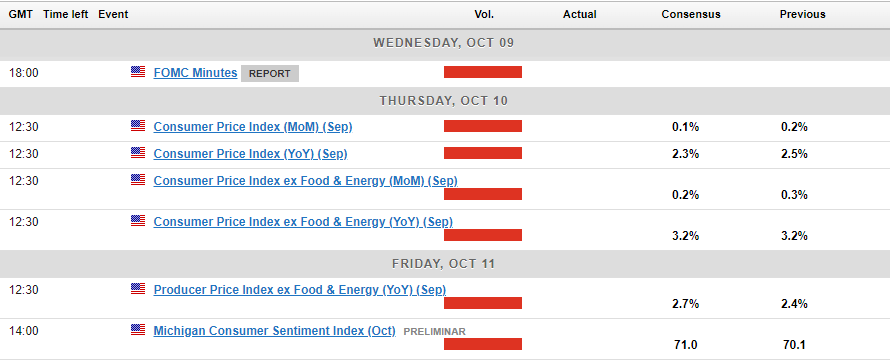
As Investors Scale Back Fed Cut Bets, US CPI Data Enters the Spotlight
- US NFP data eliminate chances of another 50bps rate cut
- Spotlight turns to US CPI numbers for September
- PMI data corroborate the notion for sticky underlying inflation
- The data comes out on Thursday, at 12:30 GMT
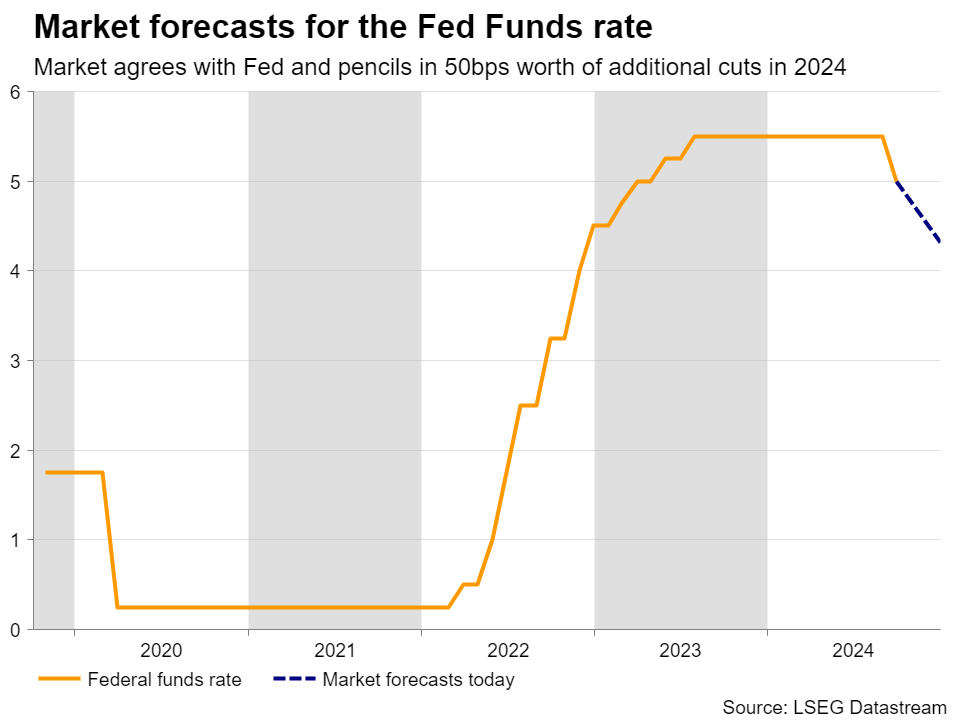
Bets of 50bps cut in November disappear
The dollar’s engines received more fuel on Friday, with the catalyst this time around being the robust US employment data for September. The report revealed that nonfarm payrolls increased by the most in six months, with the unemployment rate dropping to 4.1% from 4.2% and average hourly earnings accelerating.
The jobs numbers came on top of other robust data relating to the labor market, such as the better-than-expected ADP and JOLTS job openings reports, corroborating the view expressed by Fed Chair Powell and several of his colleagues that quarter-point reductions may be warranted from here onwards.
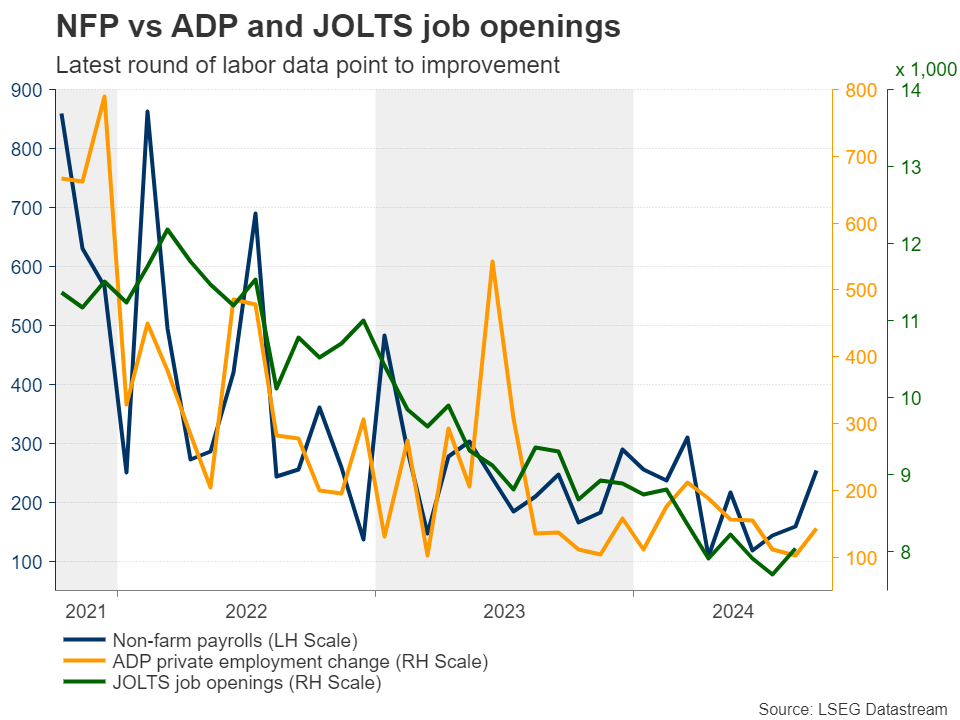
Indeed, with investors aware of how much emphasis the Fed puts on the labor market nowadays, the case for a back-to-back 50bps cut in November was taken out of the equation, with Fed funds futures now pointing to a 90% probability of a quarter-point reduction and 10% for no action at all. The total number of basis points worth of reductions by the end of the year was reduced to 50 to match the Fed’s dot plot.
Spotlight to fall on CPI inflation
With investors now in full agreement with the Fed, attention this week will fall on the minutes of the latest FOMC decision and the US CPI data for September, due out on Wednesday and Thursday, respectively.
Nonetheless, given that the financial world already knows what policymakers are planning to do, the minutes are unlikely to shake the markets. So, barring any other developments, like a major escalation in Middle East tensions, the highlight for dollar traders may be Thursday’s inflation data.
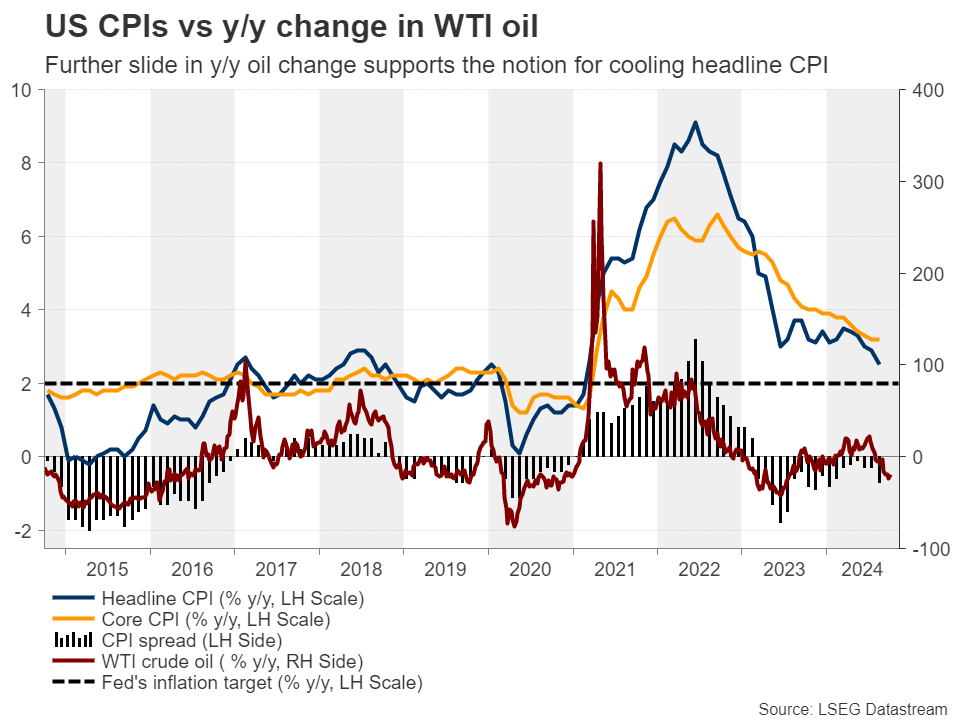
The headline CPI rate is forecast to have declined to 2.3% y/y from 2.5%, while the core rate is anticipated to have held steady at 3.2% y/y. According to the S&P Global PMIs, prices charged by businesses rose at the fastest rate in six months, and although the ISM manufacturing survey revealed a slide, the non-manufacturing report confirmed the notion of accelerating price pressures.
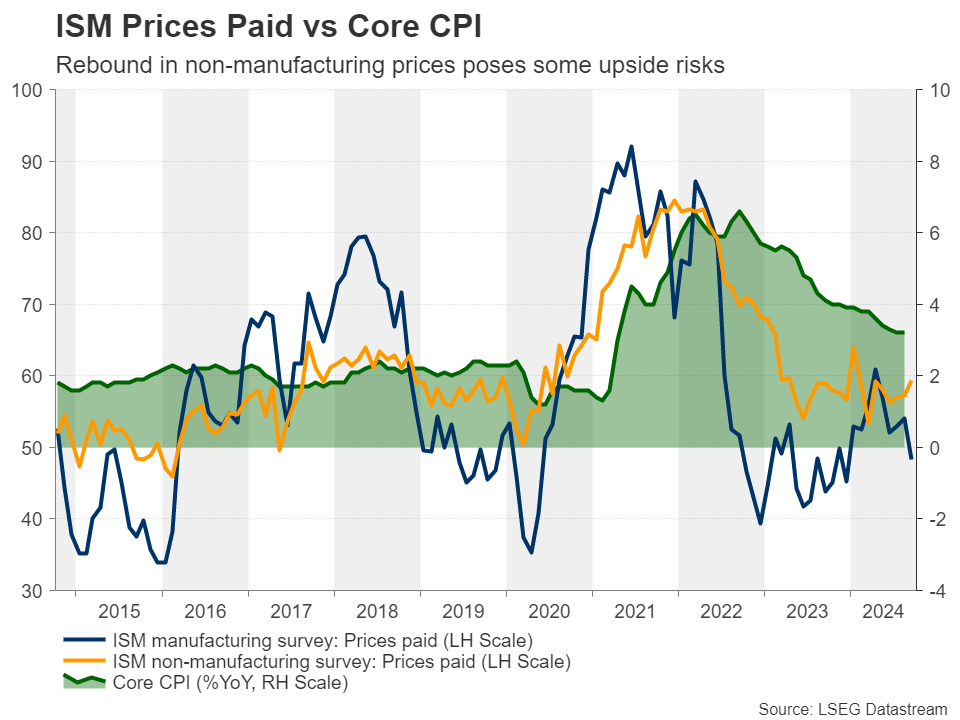
This validates the case for sticky underlying price pressures, while the slide in the year-on-year change in WTI crude oil supports the notion for a continued decrease in the headline rate. However, the latest rebound in oil prices poses upside risks to the headline rate for the months to come.
Sticky underlying inflation to further fuel the dollar
Having all that in mind, such results are likely to confirm that there is no need for the Fed to proceed with another round of aggressive easing, which may allow the US dollar to extend its gains. Nonetheless, it is worth mentioning that ahead of the next FOMC decision, investors will have to digest several more releases and events, including another NFP report and, of course, the outcome and pre-outcome speculation of the US election.
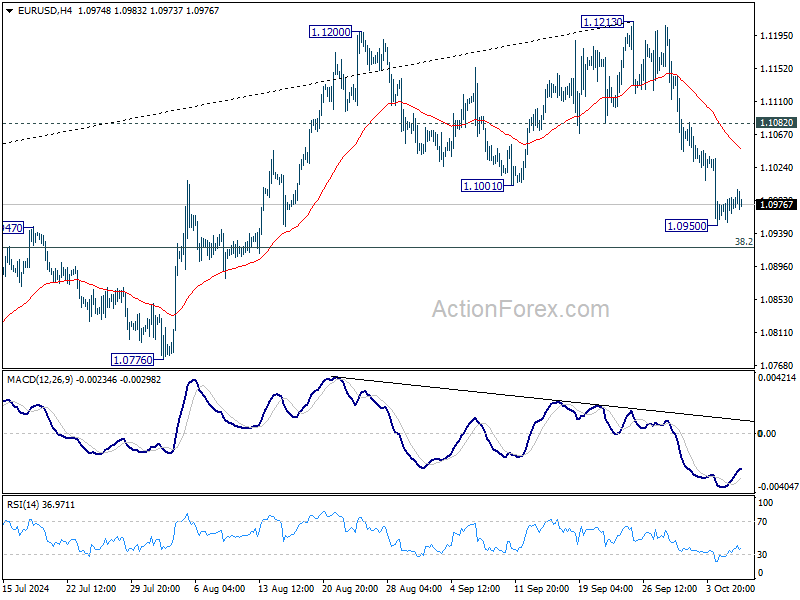
Euro/dollar completes a double top formation
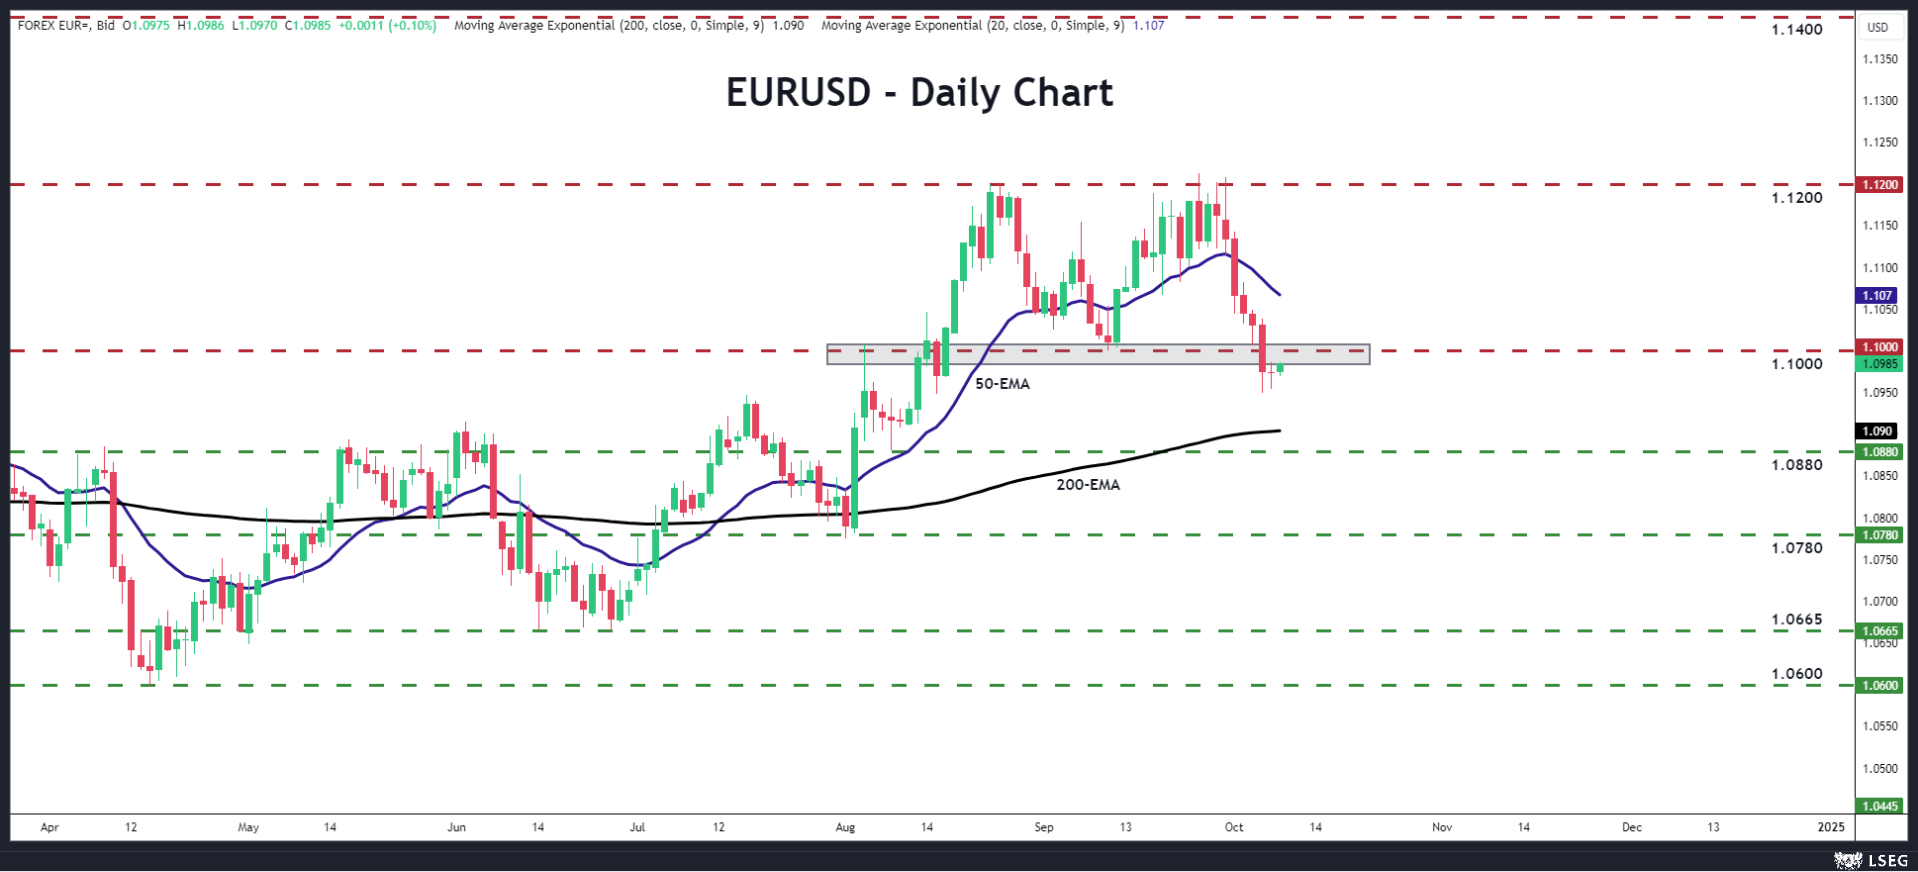
From a technical standpoint, euro/dollar tumbled on Friday and closed the week below the key round figure of 1.1000. This signaled the completion of a double top formation on the daily chart and further declines may suggest that the short-term outlook has indeed turned bearish.
If the bears reclaim control soon, they could dive towards the low of August 8, at around 1.0880, the break of which could carry larger bearish implications, perhaps setting the stage for declines towards the 1.0780 zone, marked by the lows of August 1 and 2.
On the upside, a rebound back above 1.1000 may cancel the double top completion and turn the picture back to neutral. For the outlook to be considered positive, a recovery all the way up and above the 1.1200 barrier may be needed.
Sunset Market Commentary
Markets
It look that a rather guarded reaction of Chinese investors this morning to recently announced stimulus would set the stage for some kind of a risk-off correction. European equities (EuoStoxx 50 ) opened 1.0% lower. Yields eased a few basis points. However, the intraday momentum again changed in the run-up the US trading session. Yields reversed most of the early decline. US investors apparently still are focused on the potential impact of a ‘no-landing scenario’ for the US economy. US yields currently show daily changes between -1.0 bps (2-y) and +2.5 bps (30-y). US eco data were few and very close to expectations (NFIB small business confidence and US trade balance). Fed Board member Adriana Kugler indicated a balanced approach on further Fed easing, but even after the strong payrolls repeated that the Fed wants to avoid an undesirable slowdown of the labour market. The focus remains on the maximum employment side of the Fed dual mandate. In this respect she warned against giving too much weight to one single data-print. Comments suggest that the bar for the Fed not continuing with steps of at least 25 bps remains high. Later today, we look out at investor appetite for a $58 bln 3-y Treasury Note auction after the recent rise in yields. German yields show no clear directional trend, changing less than 1.5 bps across the curve in a daily perspective. After yesterday’s correction, US equities again opened in positive territory (S&P 500 +0.37%). European indices reversed part of their early decline (EuroStoxx 50 -0.45%). Brent oil ($79.5 p/b) is trading off the ST peak levels ($81+) reached late yesterday.
Moves in the major USD cross rates are modest. Intraday, the greenback to a large extent followed the dynamics of US yields. DYX (102.45) keeps the post-payrolls top (102.68) within reach. Similar narrative for EUR/USD (1.0975) and USD/JPY (148.10). Sterling this morning briefly weakened to revisit the EUR/GBP 0.84 barrier despite decent BRC retail sales (+1.7% Y/Y). Sterling captured a better momentum later (currently EUR/GBP 0.8378). Markets and analysts are becoming ever more focused on the first budget of the new Labour government scheduled for October 30 (FT article today). To the extent that especially higher LT UK yields mirror market caution on the ability of the new government to balance its plans to revive growth against the need for fiscal consolidation, this kind of rate support won’t help sterling.
News & Views
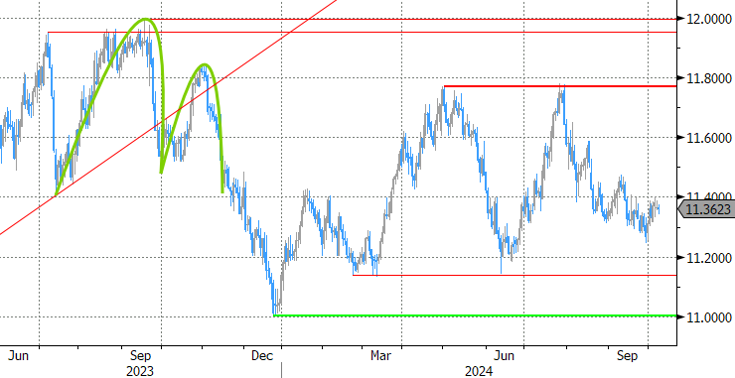
Swedish September inflation figures printed almost fully in line with consensus. Headline CPI rose by 0.2% M/M with the Y/Y-figure slowing from 1.9% to 1.6%. The Swedish Riksbank’s preferred CPIF gauge (using fixed mortgage payments), accelerated to 0.3% M/M. On an annual basis, CPIF inflation also slowed, from 1.2% to 1.1%. Core CPIF (excluding energy) showed the only small upward surprise, rising by 0.4% M/M (2% Y/Y from 2.2%). It’s the first time that Sweden statistics releases preliminary inflation readings. More detailed information and definitive figures will be available on October 15. Headline numbers won’t derail the Swedish Riksbank from cutting the policy rate (currently 3.25%) at this year’s two remaining policy meetings. The central bank in September even suggested that a cut of 50 bps is possible. EUR/SEK isn’t going anywhere today, treading water at 11.35.
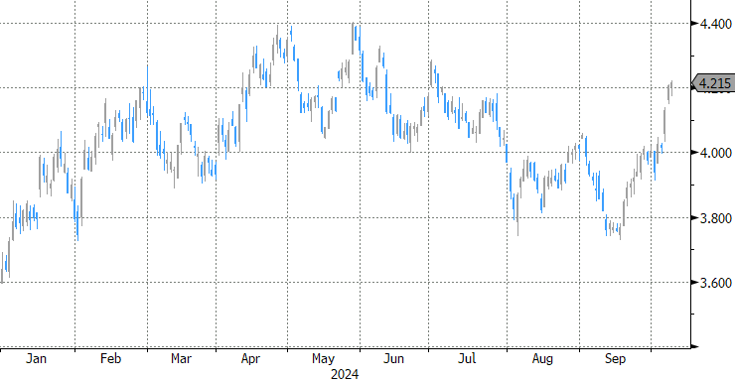
National Bank of Poland policymaker Janczyk confirmed recent vibes that the central bank is working towards the March 2025 policy meeting as a potential game changer in its current higher-for-longer approach. If forecasts at that meeting confirm current assumptions of a sustained disinflation trend in the Q2 and Q3 2025, then the path to cutting rates will be open. Janczyk expects Polish inflation to peak at slightly below 7% in March or April. He added that the timing of cuts is now more to be found in the government’s fiscal policy than in monetary policy, echoing similar remarks by NBP governor Glapinski at last week’s press conference. The Polish zloty joins a CEE-wide rebound today with EUR/PLN slipping from 4.3230 towards 4.31.
Graphs
EUR/SEK: CPI data allow Riksbank to maintain its ‘aggressive’ easing bias. Krone hardly reacts.
UK 10-y yield rebounds sharply, at least partially due to market uncertainty on the UK’s fiscal position.
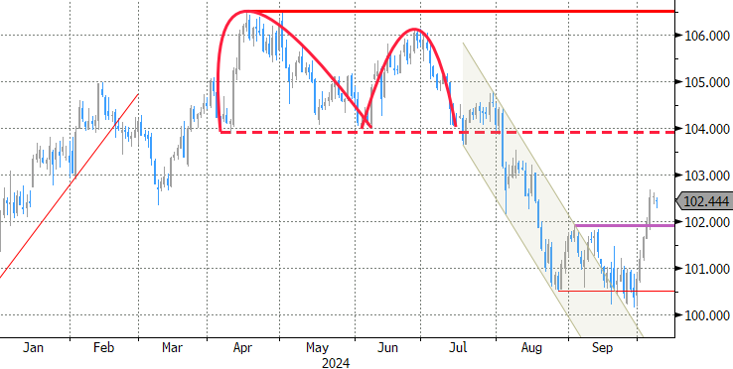
DXY (TW USD index): dollar maintains most of post-payrolls’ gains.
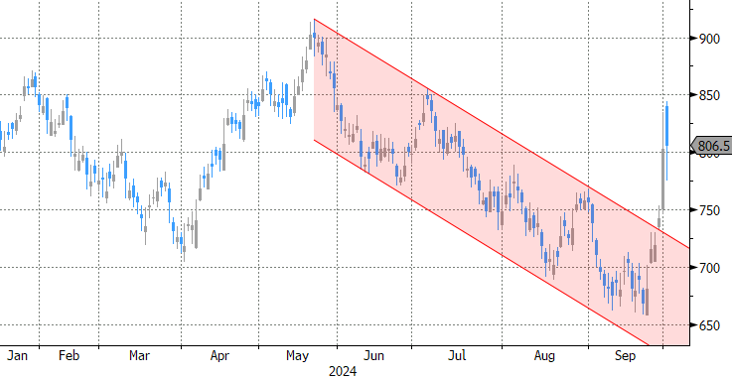
Iron ore future contract (DCE): Iron ore eases as investors aren’t convinced on China’s (fiscal) stimulus.
USD/CHF Technical Outlook: Confluence Area Hints at Bullish Breakout
- USD/CHF is poised for a potential bullish move following a recent breakout, supported by a confluence of technical and fundamental factors.
- The Swiss National Bank’s preference for a weaker CHF and the repricing of Fed rate cut expectations contribute to the bullish outlook.
- Upcoming US CPI and PPI data releases could further fuel the USD rally and drive USD/CHF to new highs.
USD/CHF is eyeing an extended move to the upside following a breakout last week. A brief pullback yesterday has set the stage for a move, will geopolitical risk reignite interest in the CHF and hamper the move?
Fundamental Overview
Considering the current economic and fundamental landscape, things have clearly shifted from a week ago. In its latest meeting, the Swiss National Bank indicated a preference for a weaker CHF, following feedback from several Swiss companies that the industry would benefit from such a move.
The Central Bank which is known for FX intervention in the past has been touted to do so again if CHF gains continue. The recent geopolitical tension has certainly piqued the interest of those touting for FX intervention.
The recent rally in the USD and repricing of rate cut expectations has changed the picture slightly. Markets are pricing in a little less than 50 bps of cuts for the rest of the year from the Federal Reserve and this bodes well for further upside in USD/CHF.
The geopolitical risk is an interesting one as the US Dollar also benefits from safe haven appeal. Thus there is a chance that a rise in geopolitical risk could see USD gains balance out any gains by the CHF making any rise in geopolitical tensions irrelevant when it comes to USD/CHF.
US Data Ahead
This week, US data ahead brings the US CPI and PPI releases which could add some fuel to USD/CHF.There has been growing chatter after the US Jobs report that a rise in inflation may rear its ugly head in the near future. The recent rise in Oil prices on the back of geopolitical risk could play its part if Oil prices remain elevated.
This week however, any uptick in inflationary pressure could further aid the US Dollar rally and thus propel the USD/CHF pair to fresh highs. Fed policymakers should also be eyed as any comments around rates may spur on some volatility as well.
Technical Analysis
From a technical standpoint, USD/CHF was stuck in a period of consolidation for two weeks before breaking out on October 4. Since then the pair has broken above the inner descending trendline.
A pullback yesterday which retested the trendline sets the stage for a move higher. The confluences are too hard to ignore at this stage with overarching fundamentals lending support to this setup.
Immediate resistance to the upside rests at 0.8633 and before the 100-day MA comes into focus at 0.8744. The 100-day MA rests just below a key area of resistance and the outer descending trendline around 0.8750.
Dropping down to a four-hour (H4) chart and a H4 candle close below the swing low at 0.8500 would invalidate the bullish setup.
USD/CHF Daily Chart, October 8, 2024
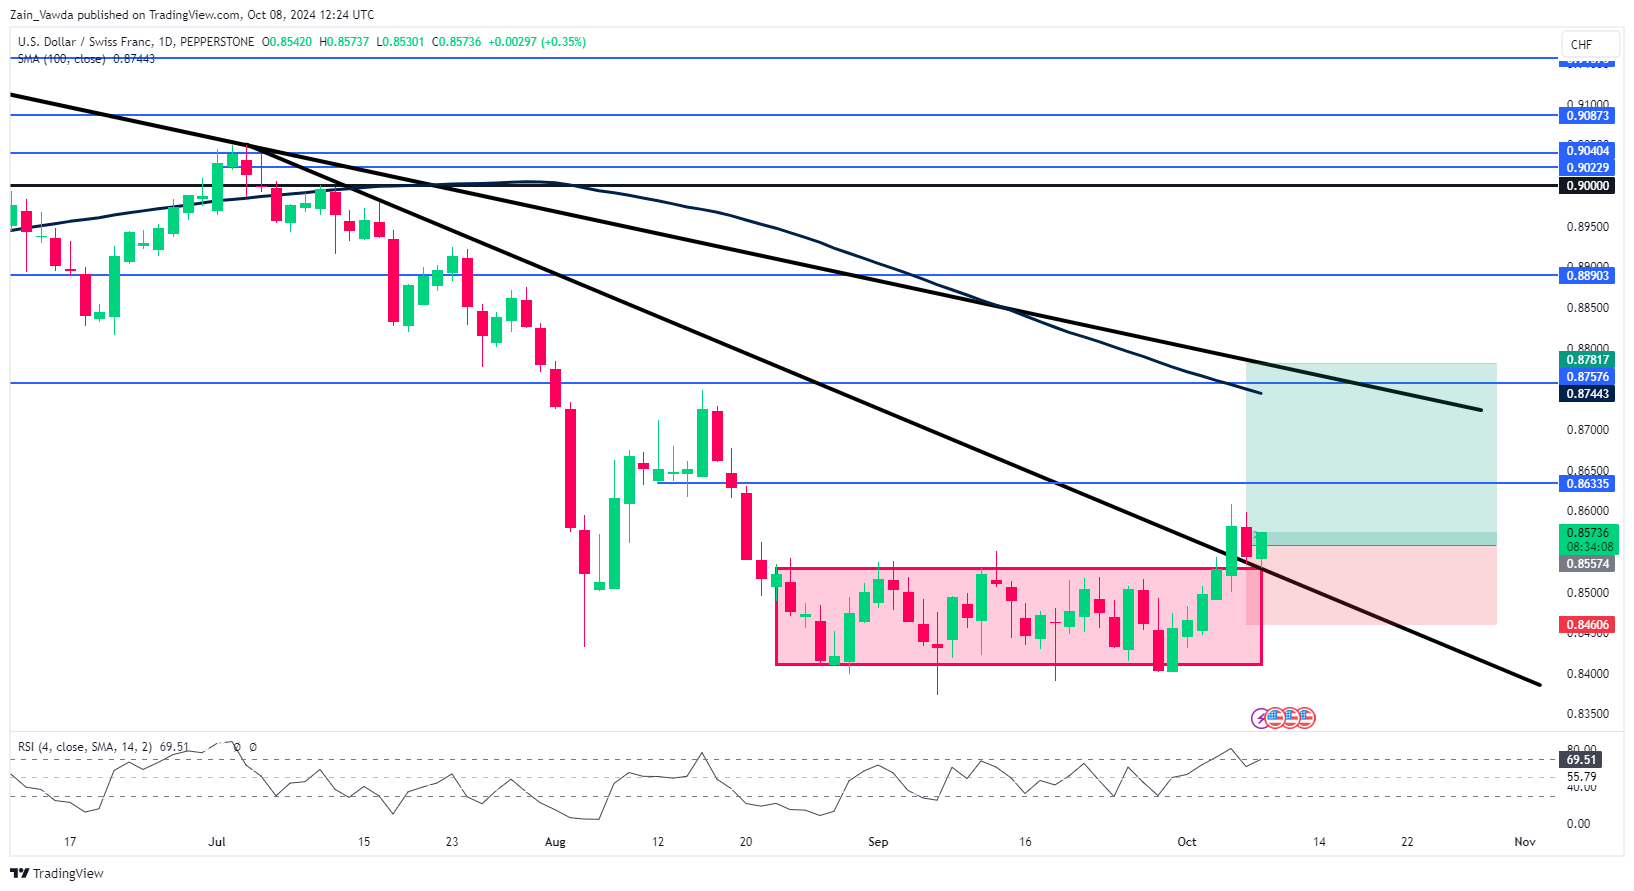
Source: TradingView (click to enlarge)
Support
- 0.8535
- 0.8500
- 0.8400
Resistance
- 0.8633
- 0.8757
- 0.8890
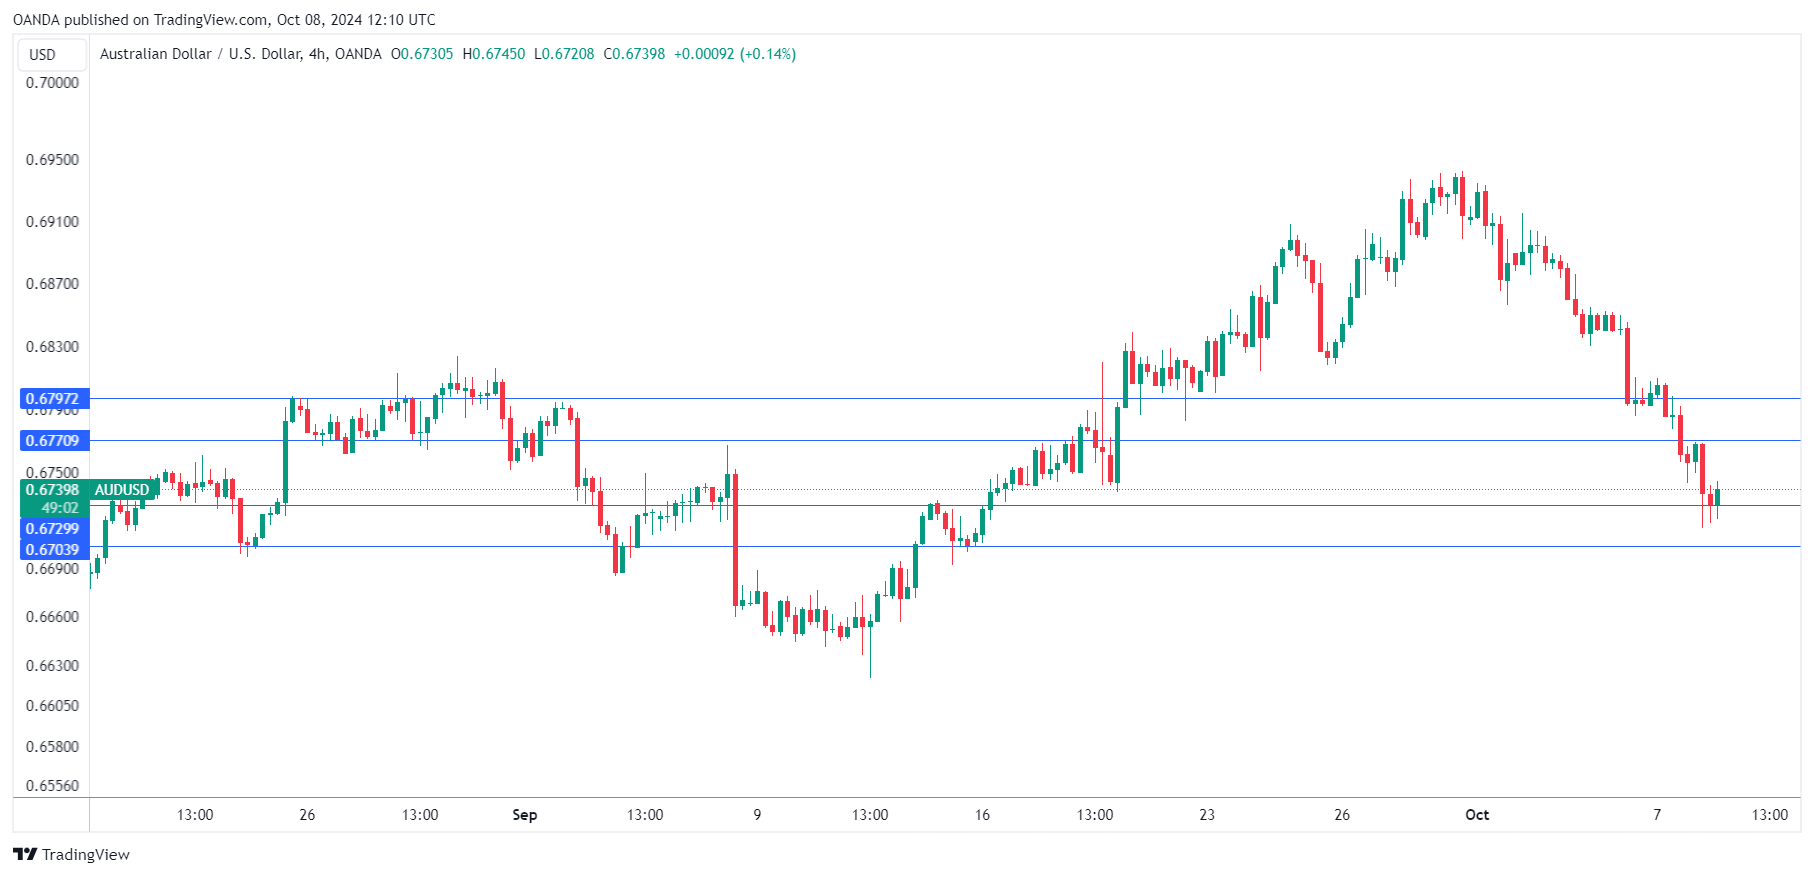
Australian Dollar Lower, RBA Keeps Options Open
The Australian dollar has extended its losses for a sixth straight day and is down 2.5% during that period. In the European session, AUD/USD is trading at 0.6736, down 0.29%.
RBA minutes: Board considered scenarios for raising and lowering rates
The Reserve Bank of Australia released the minutes of its September meeting on Tuesday. The Board noted that underlying inflation remained too high and members remained “vigilant to upside risks to inflation”. Board members felt that maintaining the cash rate at 4.35% was appropriate in order to balance the risks of inflation and the strong labor market.
The Board said that it had devised scenarios for lowering, holding or raising rates due to the “uncertain economic outlook”. Monetary policy going forward would depend on inflation levels and the strength of the economy. Notably, the Board said that the RBA’s cash rate would not have to “evolve in line” with the rates in other countries. This was a clear attempt to dampen expectations of a rate cut due to the fact that other major central banks have embarked on a rate-cutting cycle.
The bottom line is that the RBA, which meets on November 5, hasn’t made up its mind about rate policy and all possibilities remain on the table. The RBA remains very focused on data and the next rate decision could be based on next week’s employment report and the quarterly inflation at the end of the month.
In the US, it’s a quiet day with no tier-1 events and the focus will be on Fedspeak. There are a host of Federal Reserve members delivering remarks today and Wednesday and the markets will be looking for clues about the size of the next rate cut.
AUD/USD Technical
- AUD/USD is testing support at 0.6730. Next, there is support at 0.6703
- There is resistance at 0.6770 and 0.6797
EUR/USD Mid-Day Outlook
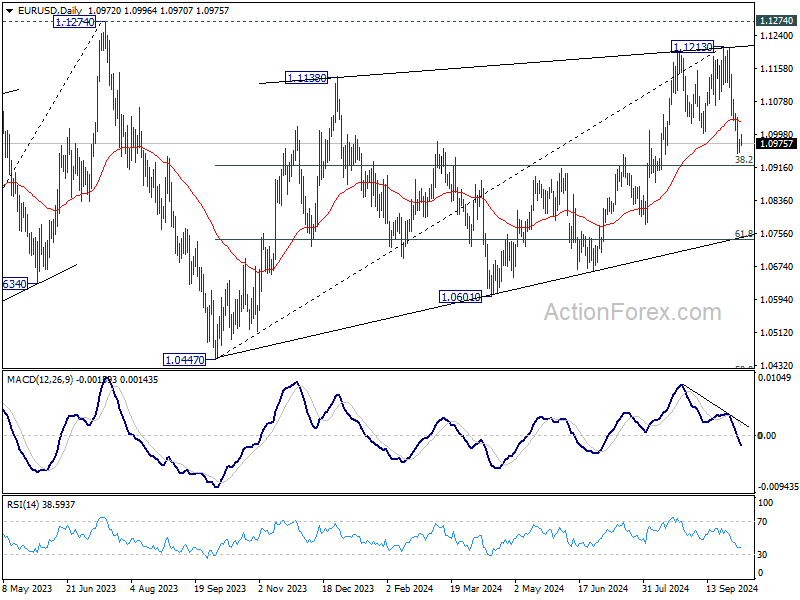
Daily Pivots: (S1) 1.0956; (P) 1.0972; (R1) 1.0989; More....
Intraday bias in EUR/USD is turned neutral first with current recovery. Fall from 1.1213 short term top is expected to continue as long as 1.1082 resistance holds. Below 1.0950 will target 38.2% retracement of 1.0447 to 1.1213 at 1.0920. Sustained break there will argue that fall from 1.1213 is the third leg of the corrective pattern from 1.1274. In this case, deeper decline would be seen to 61.8% retracement at 1.0740 next.
In the bigger picture, rejection by 1.1274 resistance suggests that corrective pattern from 1.1274 (2023 high) is not completed yet. Instead, decline from 1.1213 might be another falling leg. Sustained break of 55 W EMA (now at 1.0877) will validate this case, and bring deeper fall towards 1.0447 support again.
GBP/USD Mid-Day Outlook
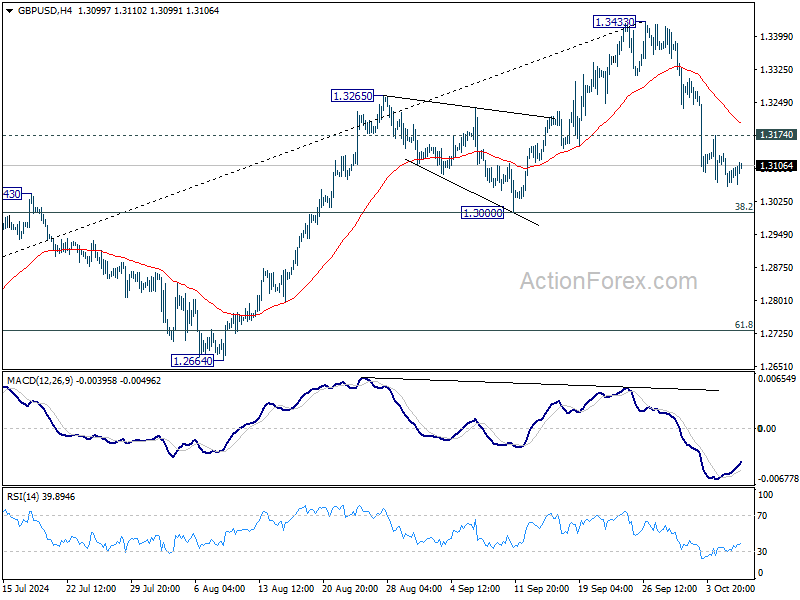
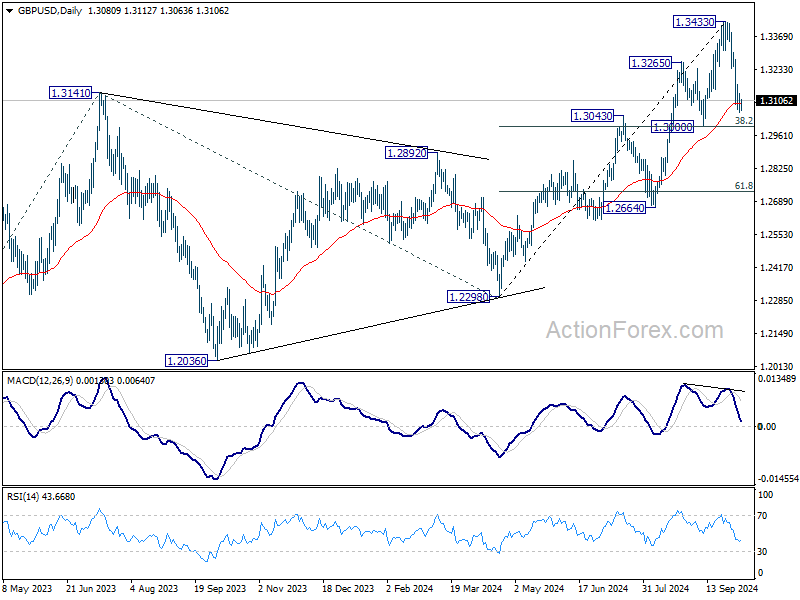
Daily Pivots: (S1) 1.3050; (P) 1.3092; (R1) 1.3126; More...
While GBP/USD's corrective fall from 1.3433 might extend lower, strong support should be seen from 1.3000 cluster support (38.2% retracement of 1.2298 to 1.3433 at 1.2999) to contained downside. Above 1.3174 minor resistance will turn bias back to the upside for stronger rebound. However, decisive break of 1.3000 will carry larger bearish implications.
In the bigger picture, as long as 1.3000 support holds, the up trend from 1.0351 (2022 low) is still in progress. Next target is 61.8% projection of 1.0351 to 1.3141 from 1.2298 at 1.4022. However, considering mild bearish divergence condition in D MACD, decisive break of 1.3000 will argue that a medium term top is already in place, and bring deeper fall back to 1.2664 support next.
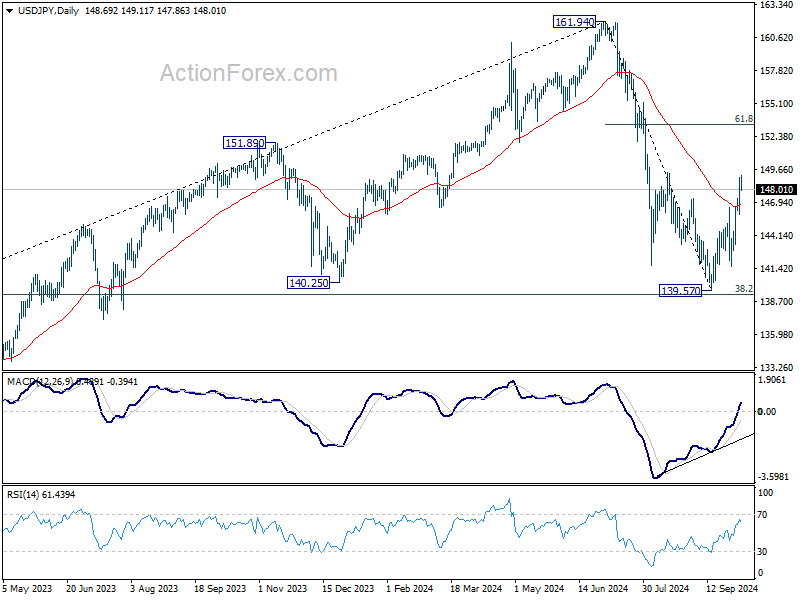
USD/JPY Mid-Day Outlook
Daily Pivots: (S1) 147.65; (P) 148.39; (R1) 148.93; More...
Intraday bias in USD/JPY is turned neutral first with current retreat. But further rally is expected as long as 141.63 support holds. Rise from 139.57 is seen as the second leg of the corrective pattern from 161.94. Break of 149.35 resistance will target 61.8% retracement of 161.94 to 139.57 at 153.39 next.
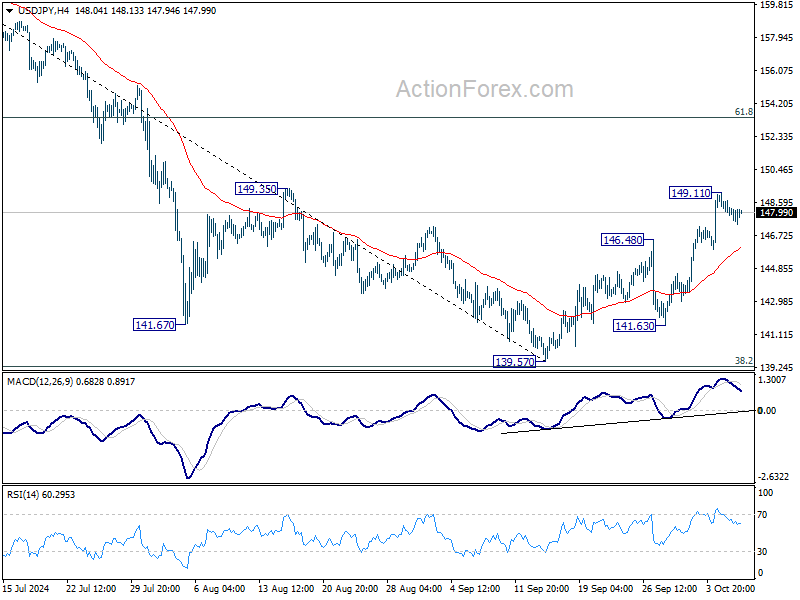
In the bigger picture, price actions from 161.94 are seen as a corrective pattern to rise from 102.58 (2021 low). The range of medium term consolidation should now be set between 38.2% retracement of 102.58 to 161.94 at 139.26 and 161.94. Nevertheless, sustained break of 139.26 would open up deeper medium term decline to 61.8% retracement at 125.25.