Sample Category Title
USD/CHF Mid-Day Outlook
Daily Pivots: (S1) 0.8520; (P) 0.8559; (R1) 0.8584; More…
USD/CHF recovered today but stays below 0.8606 temporary top. Intraday bias remains neutral at this point. Further rise is in favor as long as 0.8499 minor support holds. Above 0.8606 will target 38.2% retracement of 0.9223 to 0.8374 at 0.8698. Sustained break there will argue that fall from 0.9223 has completed after defending 0.8332 low. Next target will be 61.8% retracement at 0.8899. On the downside, break of 0.8499 will turn bias back to the downside for retesting 0.8374 low instead.
In the bigger picture, price actions from 0.8332 (2023 low) are currently seen as a medium term corrective pattern, with fall from 0.9223 as the second leg. Strong support could be seen from 0.8332 to bring rebound. Yet, overall outlook will continue to stay bearish as long as 0.9243 resistance holds. Firm break of 0.8332, however, will resume larger down trend from 1.0146 (2022 high).
Swiss Franc Down in Mixed Markets, Kiwi Awaits RBNZ Cut
Movements in the currency markets today are somewhat mixed today. Commodity currencies are generally underperforming, led by a sharp decline in Australian Dollar. Investor sentiment in Asia was dampened by the lack of detailed stimulus measures from China, following the much-anticipated post-holiday announcement. This disappointment was starkly reflected in Hong Kong’s stock markets, which saw a massive -9.41% drop with record-breaking trading volume.
Swiss Franc, however, sits at the bottom of the currency performance chart despite the absence of any immediate fundamental drivers. A plausible explanation is tied to ECB’s top hawks signaling another 25bps rate cut at the next meeting. With this expectation already priced into Euro, pressure may now be shifting to SNB to respond with a larger rate cut in December to weaken the Franc.
Sterling leads the currency gains today, followed by Japanese Yen. Yen continues its rebound, boosted by Japan’s verbal intervention efforts as USD/JPY inched closer to 150 level earlier in the week. Meanwhile, Dollar remains mixed, with traders eyeing Thursday's US CPI release for further direction.
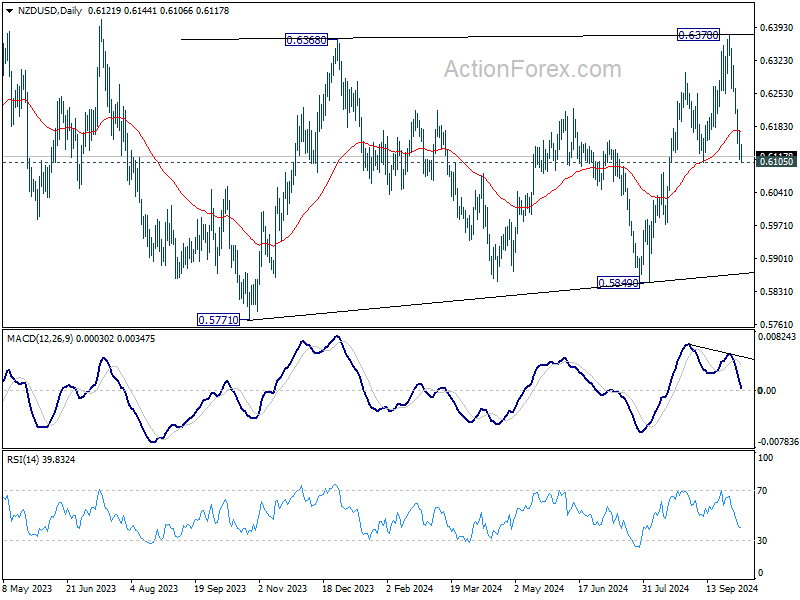
New Zealand Dollar will be in focus in the upcoming Asian session, with RBNZ widely expected to deliver a 50bps rate cut to 4.75%. In addition to weakening economy, a major reason for this pre-emptive move is risks that Q3 inflation, due next week, might undershoot the 2% target. Technically, NZD/USD is now pressing an important near term support at 0.6105. Decisive break there should confirm that rise from 0.5840 has already completed at 0.6378. Deeper decline should then be seen back to 0.5771/5849 support zone.
In Europe, at the time of writing, FTSE is down -1.01%. DAX is down -0.17%. CAC is down -0.61%. UK 10-year yield is down -0.004 at 4.213. Germany 10-year yield is up 0.001 at 2.260. Earlier in Asia, Nikkei fell -1.00%. Hong Kong HSI fell -9.41%. China Shanghai SSE rose 4.59%. Singapore Strait Times fell -0.65%. Japan 10-year JGB yield rose 0.0004 to 0.926.
Fed's Kugler: Inflation progress key, but focus on employment also needed
In a speech today, Fed Governor Adriana Kugler expressed her support on "shifting attention to the maximum-employment side" of the dual mandate, while maintaining focus on fighting inflation.
While labor market "remains resilient", Kugler emphasized, the important of "avoiding an undesirable slowdown in employment growth and economic expansion."
Regarding future rate decisions, Kugler noted that, “If progress on inflation continues as I expect, I will support additional cuts in the federal funds rate to move toward a more neutral policy stance over time."
However, she remained cautious, suggesting that if downside risks to employment rise, Fed may need to "more quickly" in easing policy to a neutral stance.
Fed's Williams: September's half-point cut not the norm
In an interview with the Financial Times, New York Fed President John Williams described the latest “dot plot” projections, which show expectations for two quarter-point rate cuts at the remaining meetings this year, as a “very good base case.” He emphasized, however, that these cuts would depend on economic data, rather than following a "preset course."
Williams also noted that the larger half-point rate cut in September was not “the rule of how we act in the future”. Instead, he explained that the focus for policymakers is to eventually move interest rates toward a neutral setting, one that neither stimulates nor restricts demand.
ECB’s Nagel open to rate cut at upcoming meeting
ECB Governing Council member and Bundesbank President Joachim Nagel, one of the central bank's leading hawks, signaled today that he is "open" to considering another interest rate cut at the next meeting.
Nagel acknowledged the "very encouraging" inflation data, while has recently dropped below ECB’s 2% target for the first time since 2021. But also highlighted that the persistent strength in core inflation suggests the ECB’s inflation battle is not yet over.
Separately, Governing Council member Martins Kazaks pointed out that recent economic data support the case for an interest rate cut in October. Though he's still concerned with the high uncertainty globally due to "wars, conflicts, and the United States presidential elections."
Another Governing Council member Bostjan Vasle acknowledged the option for a rate cut. But he stressed that such a decision would not necessarily signal another cut in December, adding that “the markets aren’t dictating our moves.”
ECB's Elderson warns of materializing growth risks
In an interview with Slovenia’s Delo newspaper, ECB Executive Board member Frank Elderson highlighted growing risks to economic growth across the Eurozone, noting that "a number of recent indicators suggest that risks of lower economic growth are already materializing."
Elderson emphasized that ECB remains data-driven, and officials will approach the upcoming October 16-17 meeting "with an open mind." He reiterated the importance of a genuine and open discussion among members, stressing that no decisions will be made in advance of reviewing the full range of economic data.
RBA minutes: Inflation vigilance remains key focus
Minutes from RBA's September meeting revealed the consensus to keep the cash rate unchanged, as members felt there had been no significant changes since the previous meeting to justify a shift in policy.
Members discussed scenarios that could lead to policy being "held restrictive for a prolonged period or tightened further". One scenario involved stronger-than-expected "consumption growth", driven by rising household disposable income. Another involved more "constrained" than expected "aggregate supply" outlook. Financial conditions could turn out to be "insufficiently restrictive".
Conversely, they acknowledged scenarios where policy could become less restrictive, such as the economy proved to be "significantly weaker than expected". Or, "inflation proved less persistent than assumed", even without significant economic weakness.
The board reiterated their vigilance to "upside risks to inflation" and emphasized that policy will remain sufficiently restrictive until inflation is clearly moving toward target. They reiterated that future rate changes could not be "ruled in or ruled out" based on current data, leaving the door open for adjustments if necessary.
Australian Westpac consumer sentiment hits 2.5-year high as rate hike fears ease
Australia's Westpac Consumer Sentiment surged by 6.2% yoy in October to 89.8, marking the highest reading since RBA began its tightening cycle two and a half years ago.
Westpac noted that consumer sentiment has been buoyed by interest rate cuts overseas and improving inflation conditions domestically. "Consumers are no longer fearful that the RBA could take interest rates higher," Westpac commented.
In particular, the Mortgage Rate Expectations Index, which tracks expectations for variable mortgage rates over the next 12 months, saw a significant drop of -14.1% mom to 106.4. The index has now declined by one-third since July, as households feel less pressure from future rate increases.
Westpac anticipates that RBA's cash rate target will remain unchanged for the rest of the year. While Q3 CPI data, due on October 30, is expected to show inflation tracking lower, it may not be enough for RBA to "shift to an explicit easing bias" at the November meeting. However, Westpac believes the Board could begin easing its "hawkish hold" and adopt a more neutral policy stance as inflation pressures show signs of abating.
Australia's NAB business confidence improves to -2, inflation pressures still high despite easing costs
Australia’s NAB Business Confidence improved in September, rising from -5 to -2. Business conditions also increased from 4 to 7, with key components such as trading conditions rising from 8 to 12, profitability up from 2 to 5, and employment conditions also climbing from 1 to 5.
A key positive development was the continued easing in input cost pressures. Labour cost growth slowed to 1.7% in quarterly equivalent terms, down from 1.8% in August. Purchase cost growth eased to 1.2%, from 1.6%.
NAB’s Head of Australian Economics, Gareth Spence, noted that while business conditions have been trending lower over the past 24 months due to slower economic growth, capacity utilization remains significantly above its long-run average.
Spence remarked, “This remains an important dynamic for the RBA where, despite slow growth, inflation remains too high, suggesting that the balance of supply and demand in the economy is yet to fully normalize.”
Japan's real wages fall -0.6% yoy in Aug as inflation outpaces wage growth
Japan's real wages declined by -0.6% yoy in August, marking the first drop in three months. Nominal wages rose for the 32nd consecutive month, increasing by 3.0% yoy, slightly missed market expectations of 3.1% .
The wage growth was not enough to offset inflationary pressures. The CPI used to calculate real wages, which includes fresh food prices but excludes owners' equivalent rent, surged by 3.5% yoy in August, the highest increase since October 2023.
On a positive note, base wages (excluding bonuses and overtime) saw a significant 3.0% yoy increase, the largest rise in nearly 32 years. Overtime pay grew by 2.6% yoy. However, these gains were still outpaced by inflation.
In other data, household spending fell -1.9% yoy in August, but the decline was less severe than the market's expected drop of -2.6%.
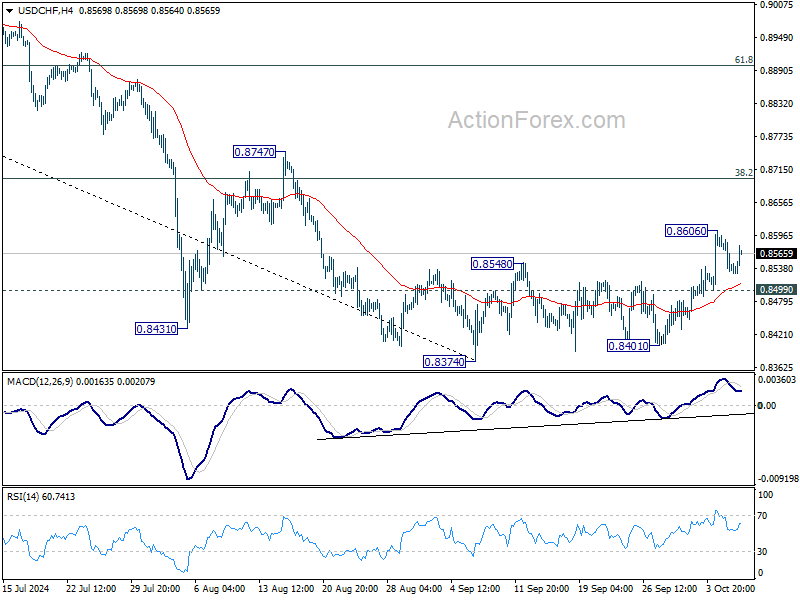
USD/CHF Mid-Day Outlook
Daily Pivots: (S1) 0.8520; (P) 0.8559; (R1) 0.8584; More…
USD/CHF recovered today but stays below 0.8606 temporary top. Intraday bias remains neutral at this point. Further rise is in favor as long as 0.8499 minor support holds. Above 0.8606 will target 38.2% retracement of 0.9223 to 0.8374 at 0.8698. Sustained break there will argue that fall from 0.9223 has completed after defending 0.8332 low. Next target will be 61.8% retracement at 0.8899. On the downside, break of 0.8499 will turn bias back to the downside for retesting 0.8374 low instead.
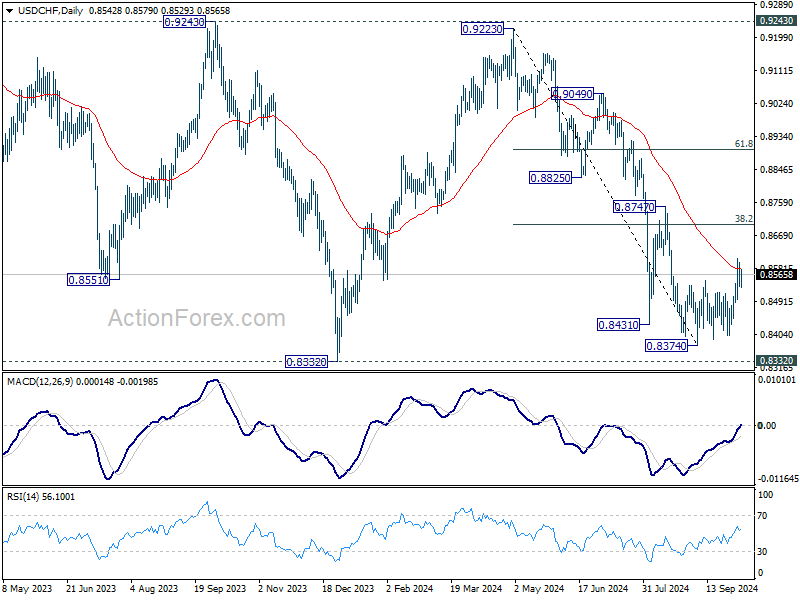
In the bigger picture, price actions from 0.8332 (2023 low) are currently seen as a medium term corrective pattern, with fall from 0.9223 as the second leg. Strong support could be seen from 0.8332 to bring rebound. Yet, overall outlook will continue to stay bearish as long as 0.9243 resistance holds. Firm break of 0.8332, however, will resume larger down trend from 1.0146 (2022 high).
ECB’s Nagel open to rate cut at upcoming meeting
ECB Governing Council member and Bundesbank President Joachim Nagel, one of the central bank's leading hawks, signaled today that he is "open" to considering another interest rate cut at the next meeting.
Nagel acknowledged the "very encouraging" inflation data, while has recently dropped below ECB’s 2% target for the first time since 2021. But also highlighted that the persistent strength in core inflation suggests the ECB’s inflation battle is not yet over.
Separately, Governing Council member Martins Kazaks pointed out that recent economic data support the case for an interest rate cut in October. Though he's still concerned with the high uncertainty globally due to "wars, conflicts, and the United States presidential elections."
Another Governing Council member Bostjan Vasle acknowledged the option for a rate cut. But he stressed that such a decision would not necessarily signal another cut in December, adding that “the markets aren’t dictating our moves.”
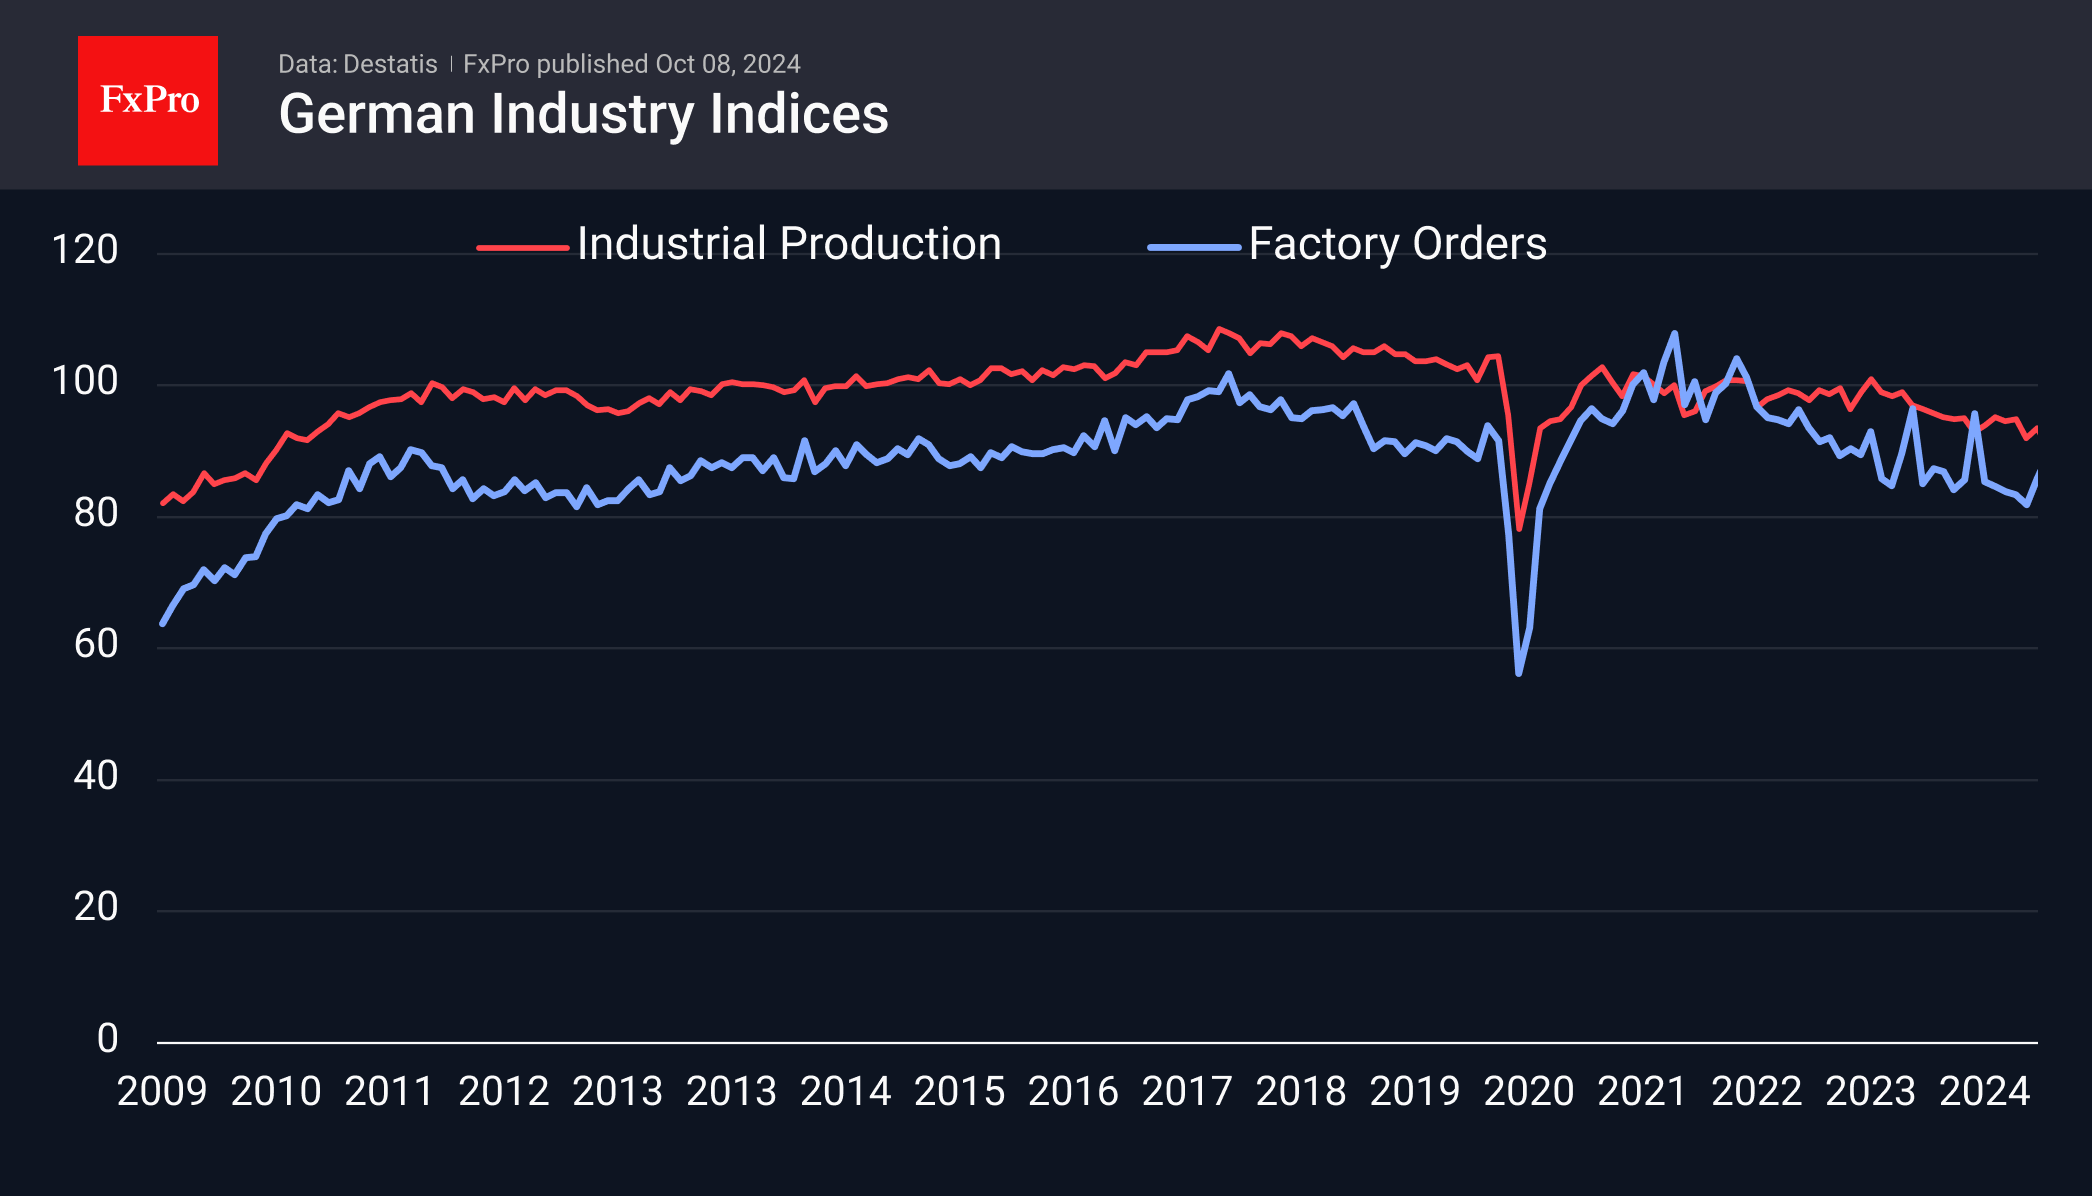
Germany’s Manufacturing Rebound Doesn’t Change the Gloomy Picture
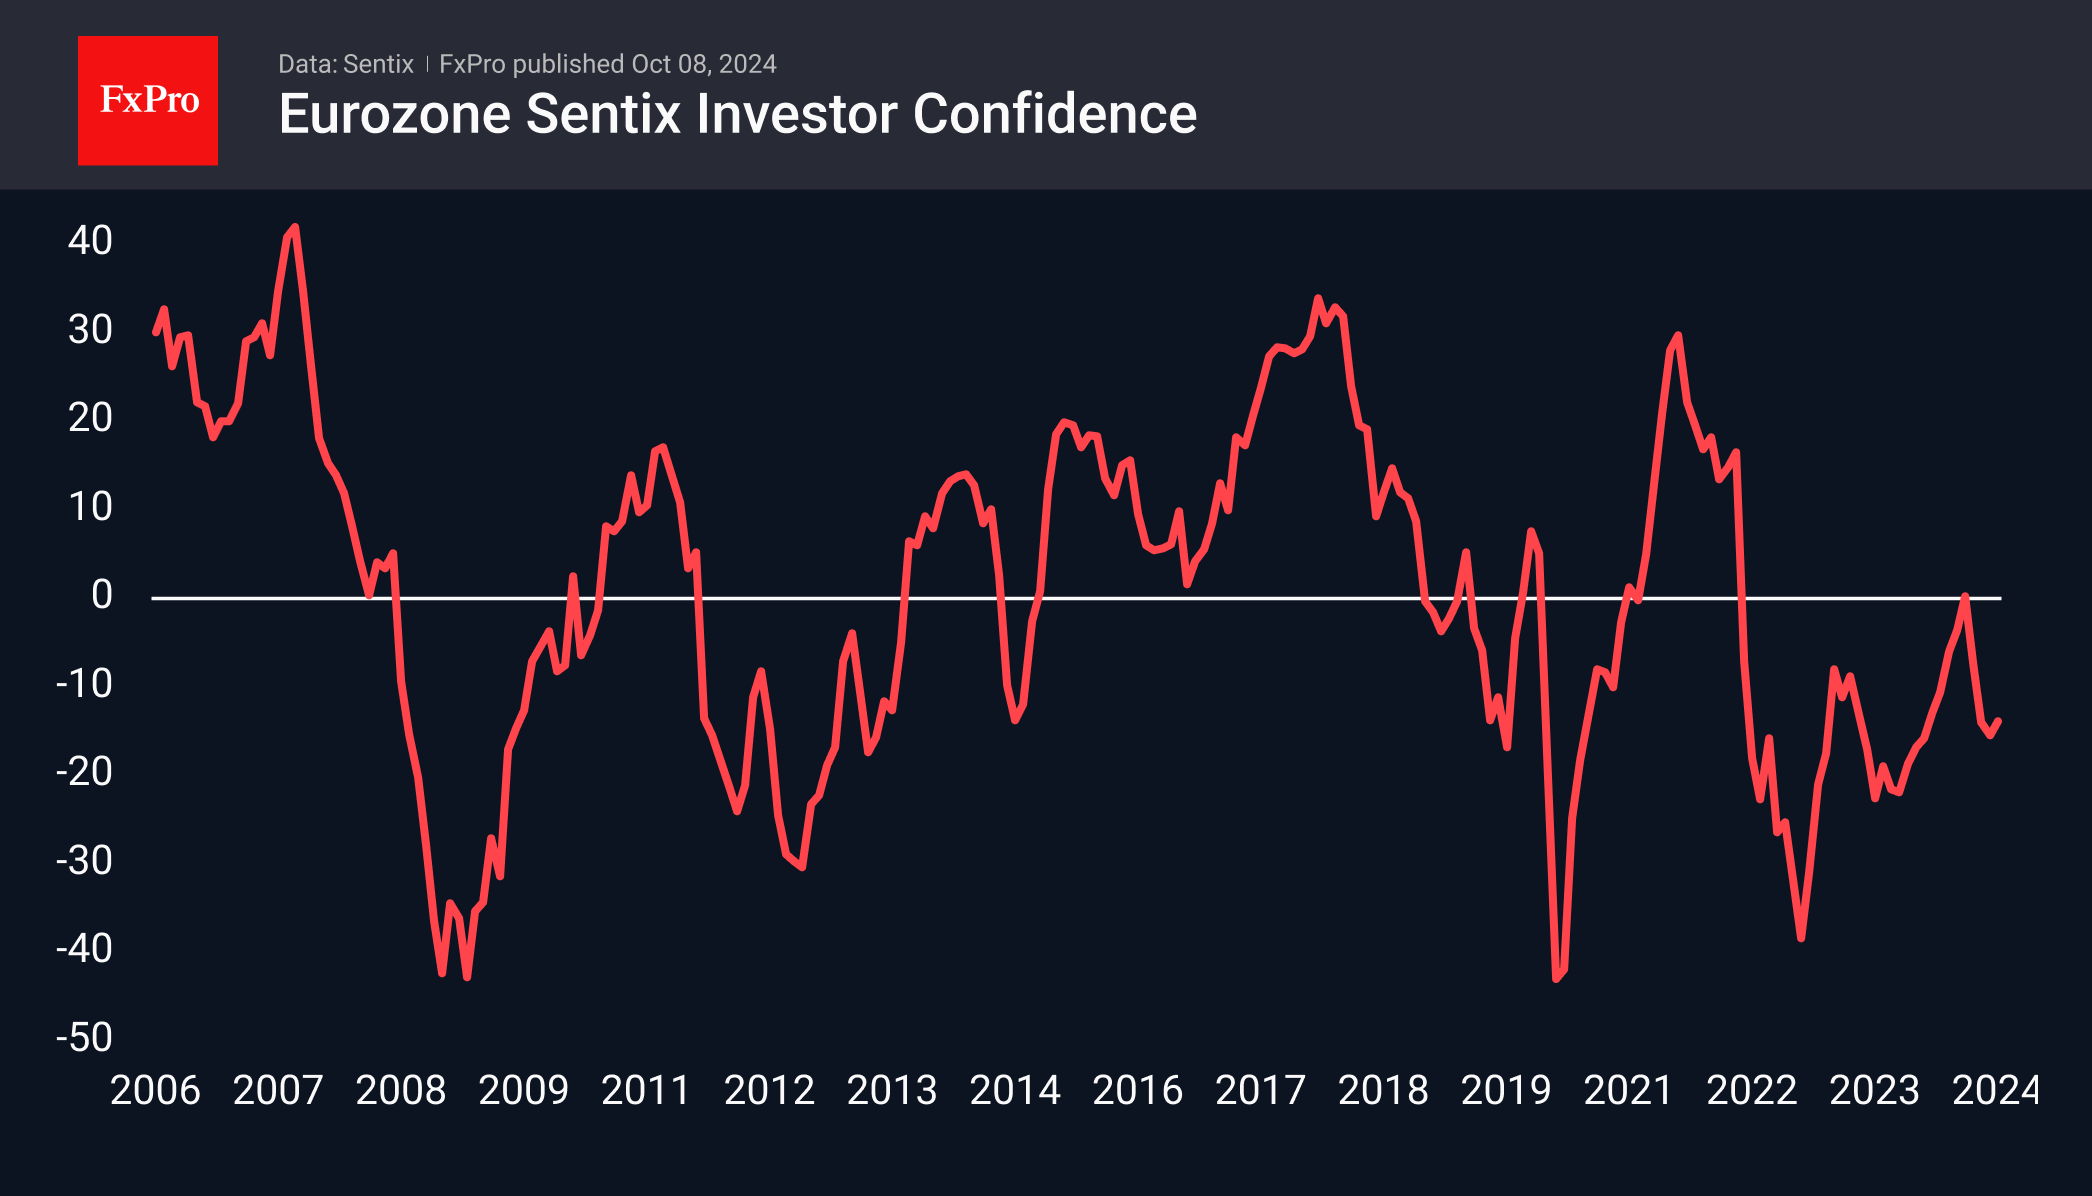
Germany’s industrial production index jumped 2.9% in August, almost recovering from a similar drop in the previous month. This data, above the expected 0.8% rise, nominally supports the euro-dollar exchange rate on Tuesday, as does the positive surprise in the Sentix index on Monday.
In both cases, the better-than-expected and stronger-than-expected data does not change the overall rather worrying picture. German industrial production is down 2.7% year-on-year and has been in a declining phase since February 2023, and we saw the global peak at the very end of 2017.
Sentix—the eurozone investor sentiment index—has been negative for 31 of the last 32 months despite its uptrend, compared with 25 months below zero after the global financial crisis.
Industrial orders, like manufacturing, have been very volatile in recent months, falling 5.8% in August. But here, too, there is a long downtrend, with a peak just after production.
Germany’s economic slowdown began with the first salvos of the trade war with China and continued with the cut-off of cheap gas from Russia and the abandonment of that market. In recent months, the issue of tariffs on Chinese goods and China’s potential response has returned to the fore.
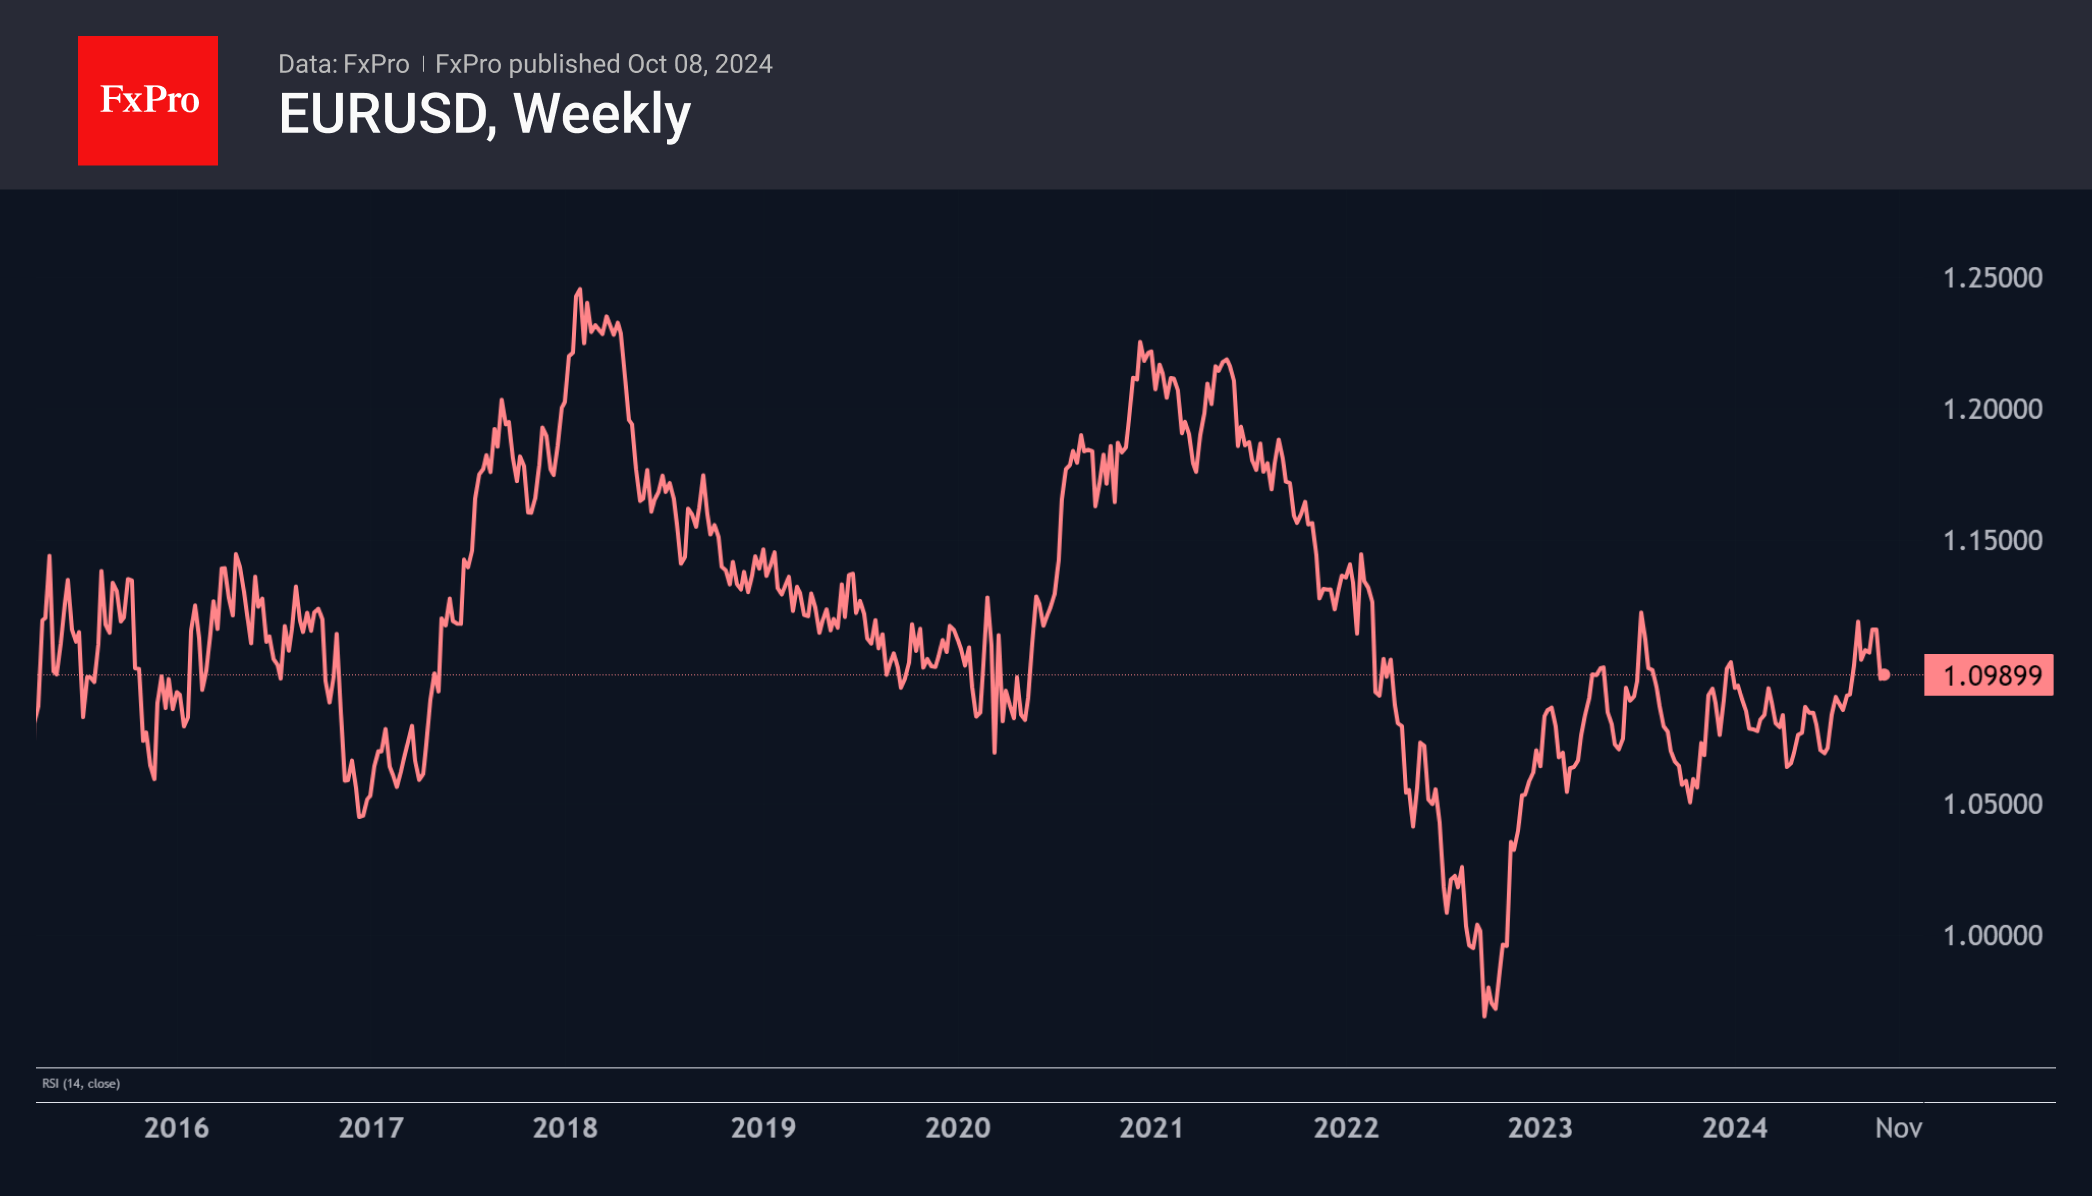
It is hardly a coincidence that the peak in the EURUSD almost coincided with peaks in all the above indicators. Weakness in manufacturing and low investor confidence are translating into looser monetary policy from central banks. In particular, the ECB has not raised interest rates as much as the Fed and has started to cut rates earlier. At the same time, the strong US labour market report contrasts with the global sluggishness in Europe (albeit locally better than expected).
The macroeconomic backdrop thus supports a strategy of selling EURUSD on the expectation that the ECB will accelerate its monetary easing. Meanwhile, the Fed will reduce the pace of its rate cuts.
Equity Weakness Dampens Crypto Investment Appetite
Market Picture
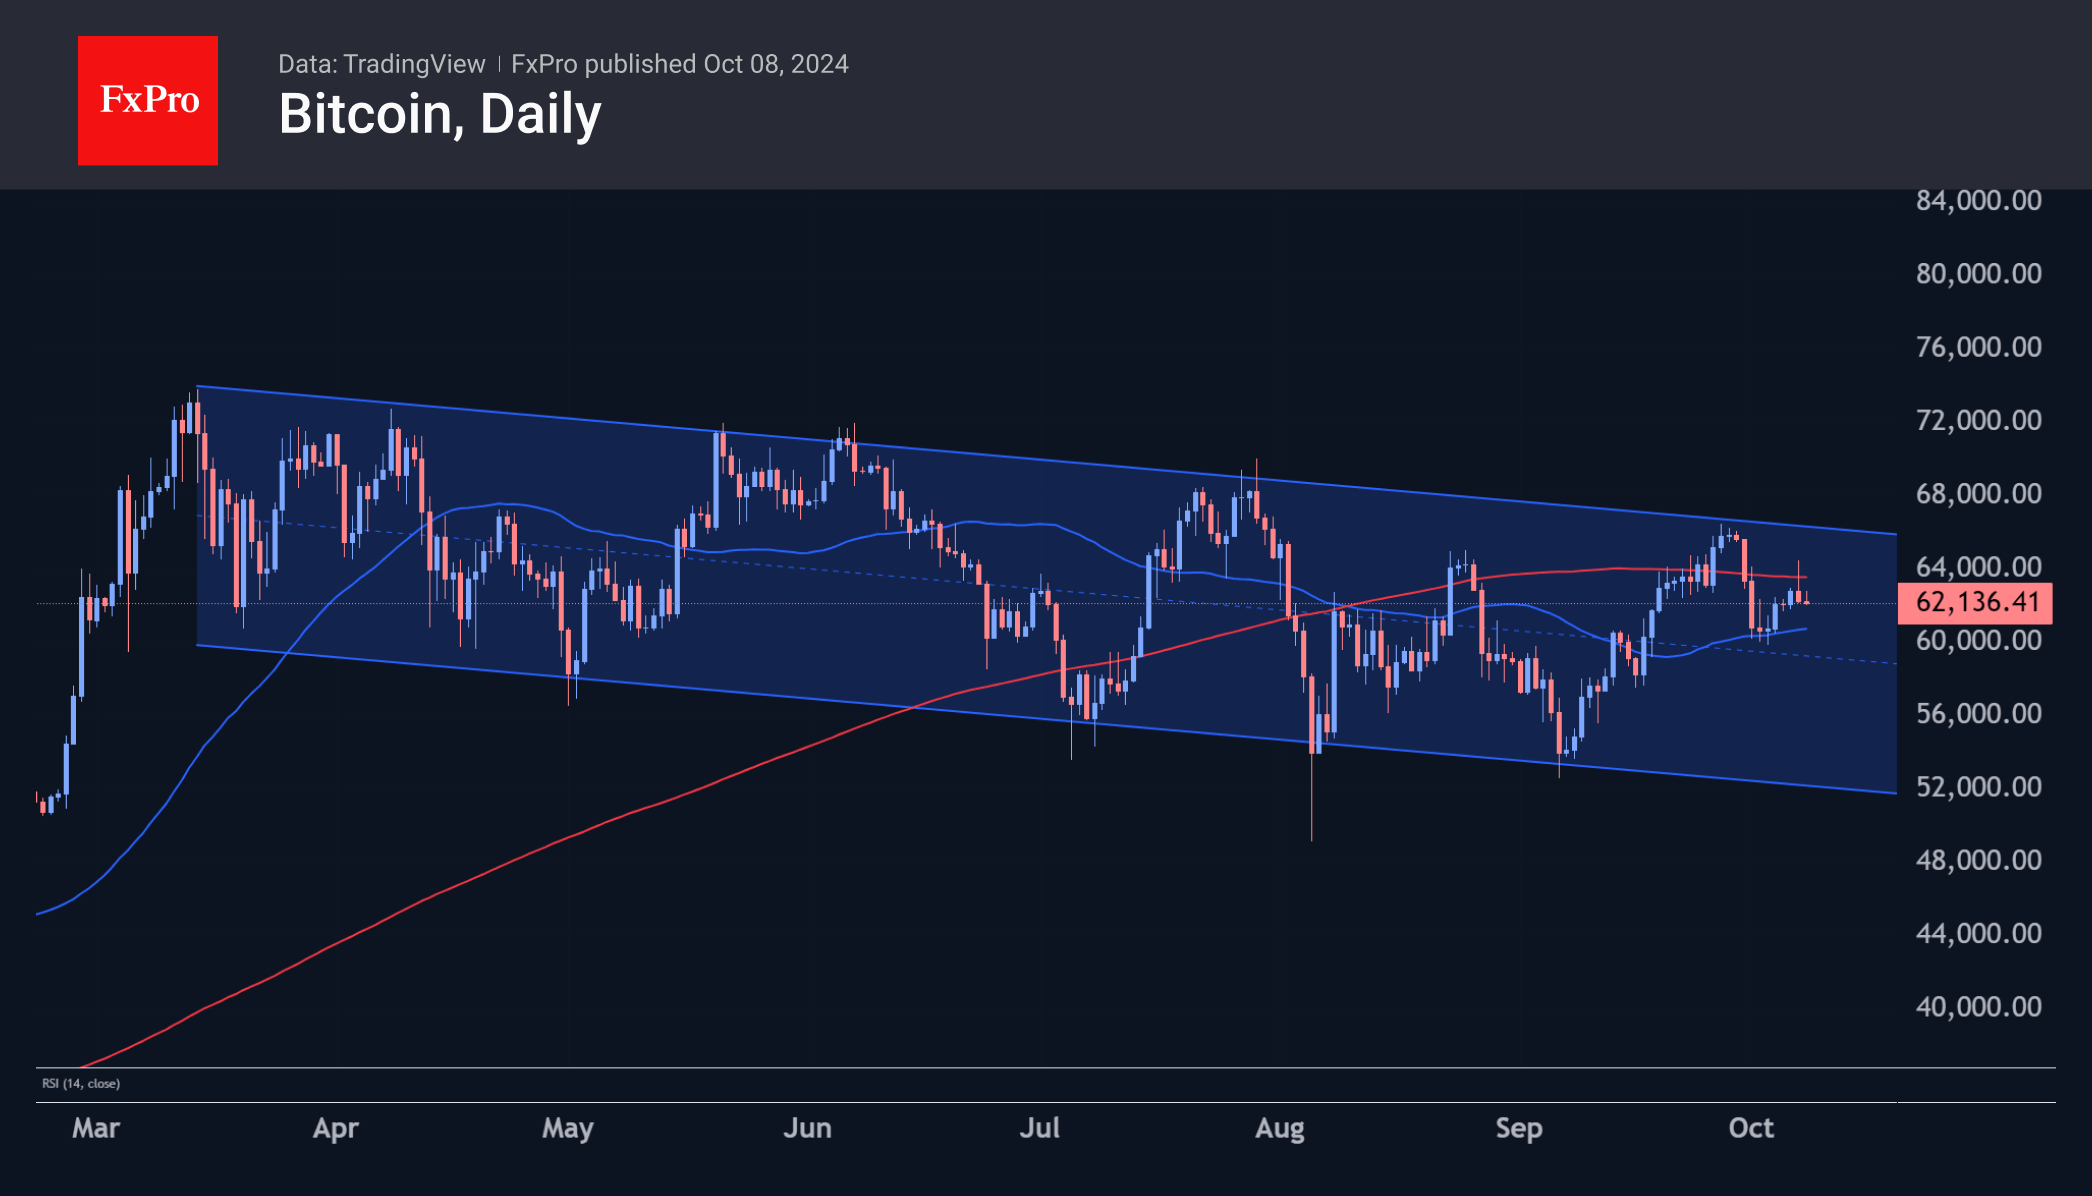
The cryptocurrency market rolled back 1.8% in 24 hours to $2.17 trillion due to a reduction in risk appetite among investors, sparking a sell-off in bonds and equities. That said, as the less risky of the cryptocurrencies, bitcoin has been gaining ground relative to the overall market during similar periods, now holding 56.9% of the capitalisation of all currencies – its highest since April 2021. That share is largely taken away from Ethereum, which now weighs in at 13.5% of the entire market, which was also last seen three and a half years ago.
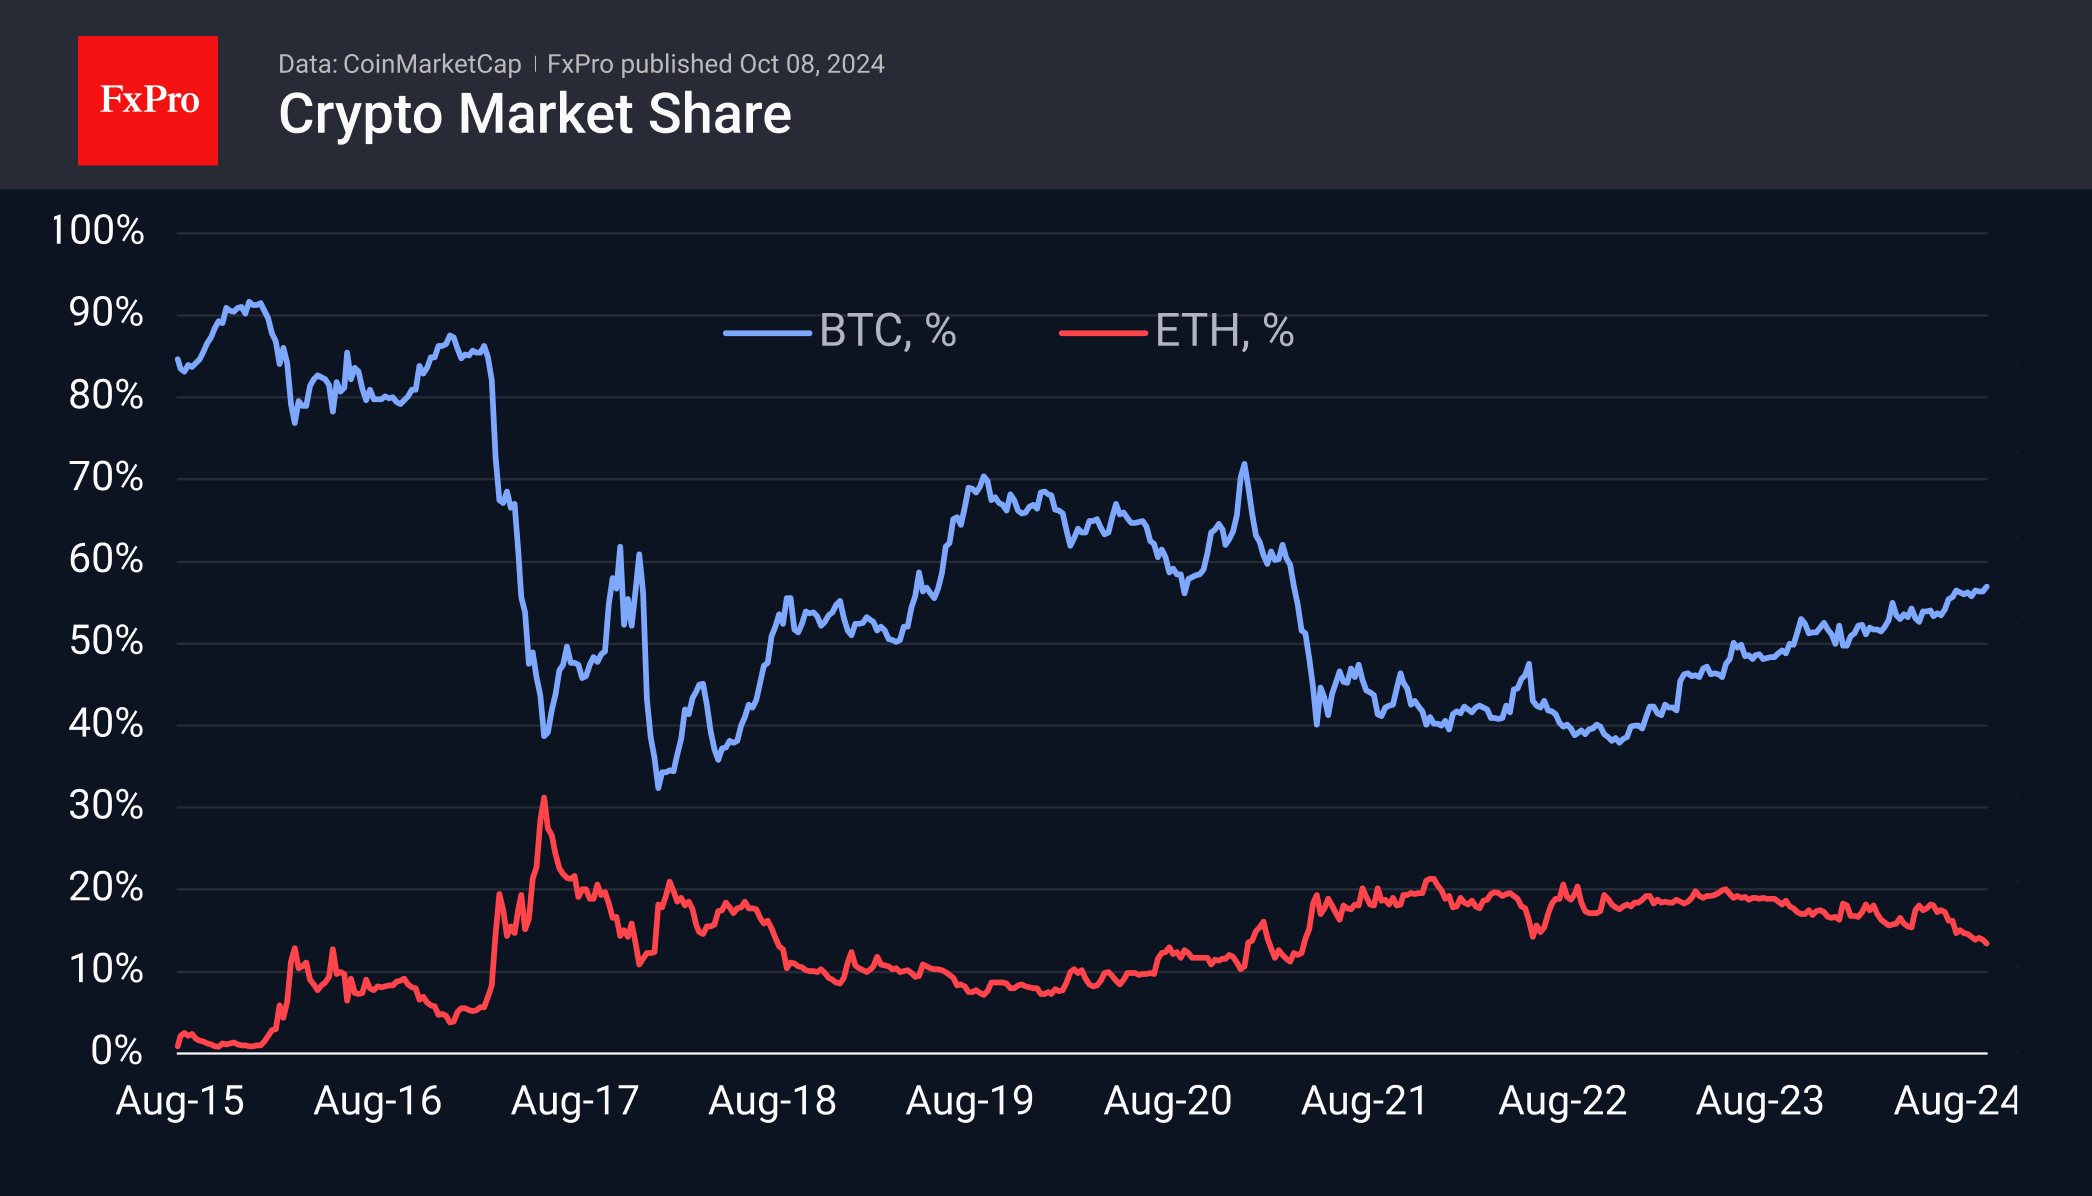
Technically, bitcoin sold off to consolidate above its 200-day moving average, a demonstration of bearish strength. But we’re still inclined to see this as more of a short-term correction for now, as the latest episode of risk-off is driven by strong data. While this is a formal reason to sell, strong employment is still a positive factor, promising more demand for final consumption and investment. The threat to cryptocurrencies so far is a combination of a new round of rising prices with signs of a weakening economy. Perhaps they’ll be found in economic reports this week and next. But that’s nothing more than a risk.
News background
According to CoinShares, crypto fund investments fell $147 million last week after three weeks of inflows. Bitcoin investments were down $159 million; Ethereum was down $29 million, and Solana was up $5 million. Investments in funds with multiple crypto assets were up $29 million, recording their 16th week of inflows. Since June, such products have become favourites among investors who prefer to invest in a diversified basket of assets rather than individual assets.
Despite the previous week’s difficult start, the options market points to bullish sentiment in the fourth quarter. QCP Capital is optimistic for a strong October, given the projected rate cuts and bitcoin’s correlation with equities. UBS forecasts China’s announcement of a new stimulus package from 8-18 October for 1.5-2 trillion yuan ($213-285 billion) with an additional 8 trillion yuan ($1.14 trillion) in 2025.
Crypto Insights noted ‘one of the highest levels of crypto optimism’ for the year among investment fund managers. The number of funds invested in cryptocurrencies topped 1,600.
PwC notes that the UAE has abolished VAT on all crypto transactions, putting digital assets on par with traditional finance (TradFi).
Pavel Durov said Telegram users bought up to 600,000 ‘rare’ gifts in a few hours on the day of their launch. The developers promise that in the future, ‘rare’ gifts can be converted into NFTs on the TON blockchain and traded as tokenised assets.
Hang Seng Index (HSI) Drops Nearly 10% Today
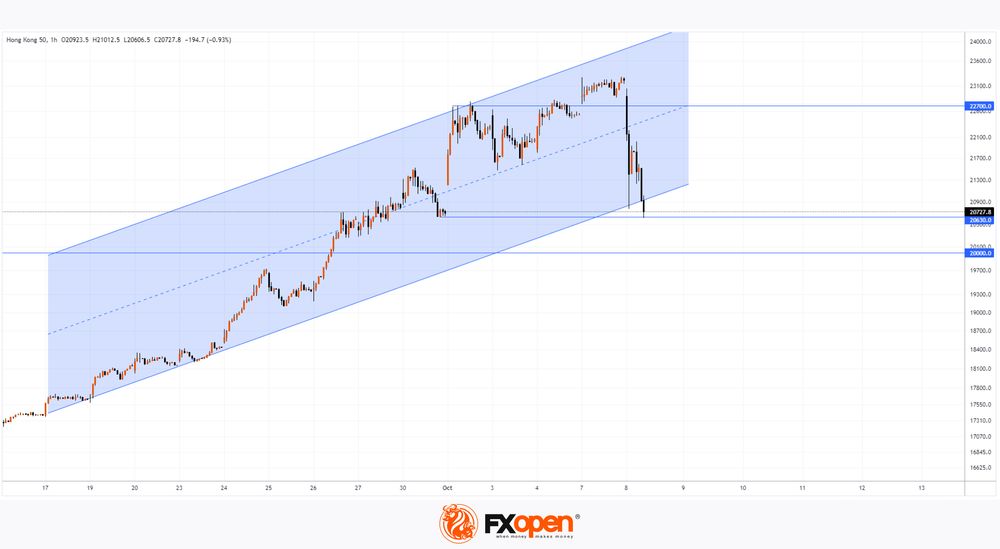
As shown on the Hang Seng Index chart (Hong Kong 50 on FXOpen), prices have fallen by almost 10% since trading began today, and the session is not over yet.
According to Reuters, bearish sentiment was driven by uncertain statements from Chinese officials regarding economic stimulus measures. This has raised doubts in the stock market about Beijing's ability to steer the world’s second-largest economy out of its most severe downturn since the global pandemic, aiming to achieve 5% growth.
Additionally, the decline may have been accelerated by a cascade of long position closures, which were opened in mid-September when the Hang Seng Index (Hong Kong 50 on FXOpen) was in an upward trend.
Hang Seng Index Technical Analysis (Hong Kong 50 on FXOpen):
→ The upward trend (marked in blue) is still intact, although the price is now near the lower boundary, posing a real risk of a break.
→ The price failed to hold above the 22,700 level, which could act as future resistance.
→ Support may come from the psychological level of 20,000 points and the September 30 low near 20,630.
It’s possible that the lower boundary of the blue channel and the support area between 20,000 and 20,630 could help bulls offset some of today's significant decline. However, for a sustainable continuation of the upward trend on the Hang Seng Index chart (Hong Kong 50 on FXOpen), the market will need clear evidence of economic stimulus from Chinese authorities.
Trade global index CFDs with zero commission and tight spreads. Open your FXOpen account now or learn more about trading index CFDs with FXOpen.
This article represents the opinion of the Companies operating under the FXOpen brand only. It is not to be construed as an offer, solicitation, or recommendation with respect to products and services provided by the Companies operating under the FXOpen brand, nor is it to be considered financial advice.
XBR/USD Analysis: Brent Crude Price Fails to Hold Above $80
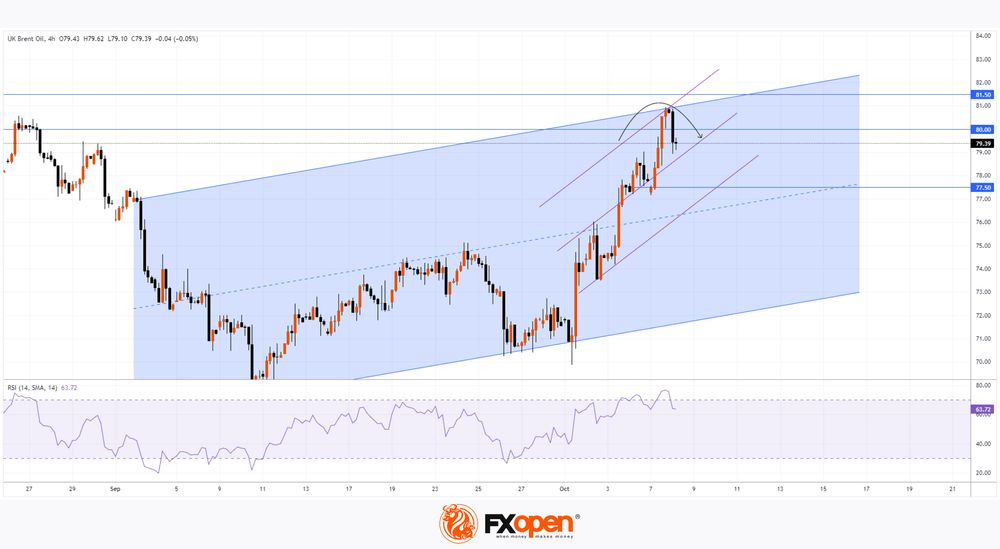
As shown on the XBR/USD chart, Brent crude oil prices surged by over 8.5% last week — marking the largest increase in 2024, driven by escalating tensions in the Middle East.
Although oil prices continued to climb earlier this week, a pullback occurred on Tuesday, causing Brent crude to drop below the $80 level. It appears that market participants expect U.S. authorities to prevent the conflict from worsening ahead of the presidential elections, prompting them to lock in profits from previous long positions based on the technical outlook.
XBR/USD Technical Analysis
Today's analysis of the XBR/USD chart shows that Brent crude is moving within an upward channel (shown in blue) that began in the first half of September. The recent downturn (indicated by an arrow) comes as:
→ The price has entered a resistance zone, marked by the psychological $80 level and the August highs around $81.5.
→ The RSI indicator has risen above 85.
→ The price has touched the upper boundary of the channel.
If tensions in the Middle East ease, we could see a pullback on the XBR/USD chart following the impressive rally.
Brent crude prices may find support at the median line of the blue channel, the $77.50 level, and the purple lines marking last week’s strong price growth.
Trade over 50 forex markets 24 hours a day with FXOpen. Take advantage of low commissions, deep liquidity, and spreads from 0.0 pips. Open your FXOpen account now or learn more about trading forex with FXOpen.
This article represents the opinion of the Companies operating under the FXOpen brand only. It is not to be construed as an offer, solicitation, or recommendation with respect to products and services provided by the Companies operating under the FXOpen brand, nor is it to be considered financial advice.
Gold Bulls Take a Rest After Rallying
- Gold’s pace moderates within triangle prior to Thursday’s CPI inflation data
- Technical signals favor the bears, but the trend may remain positive
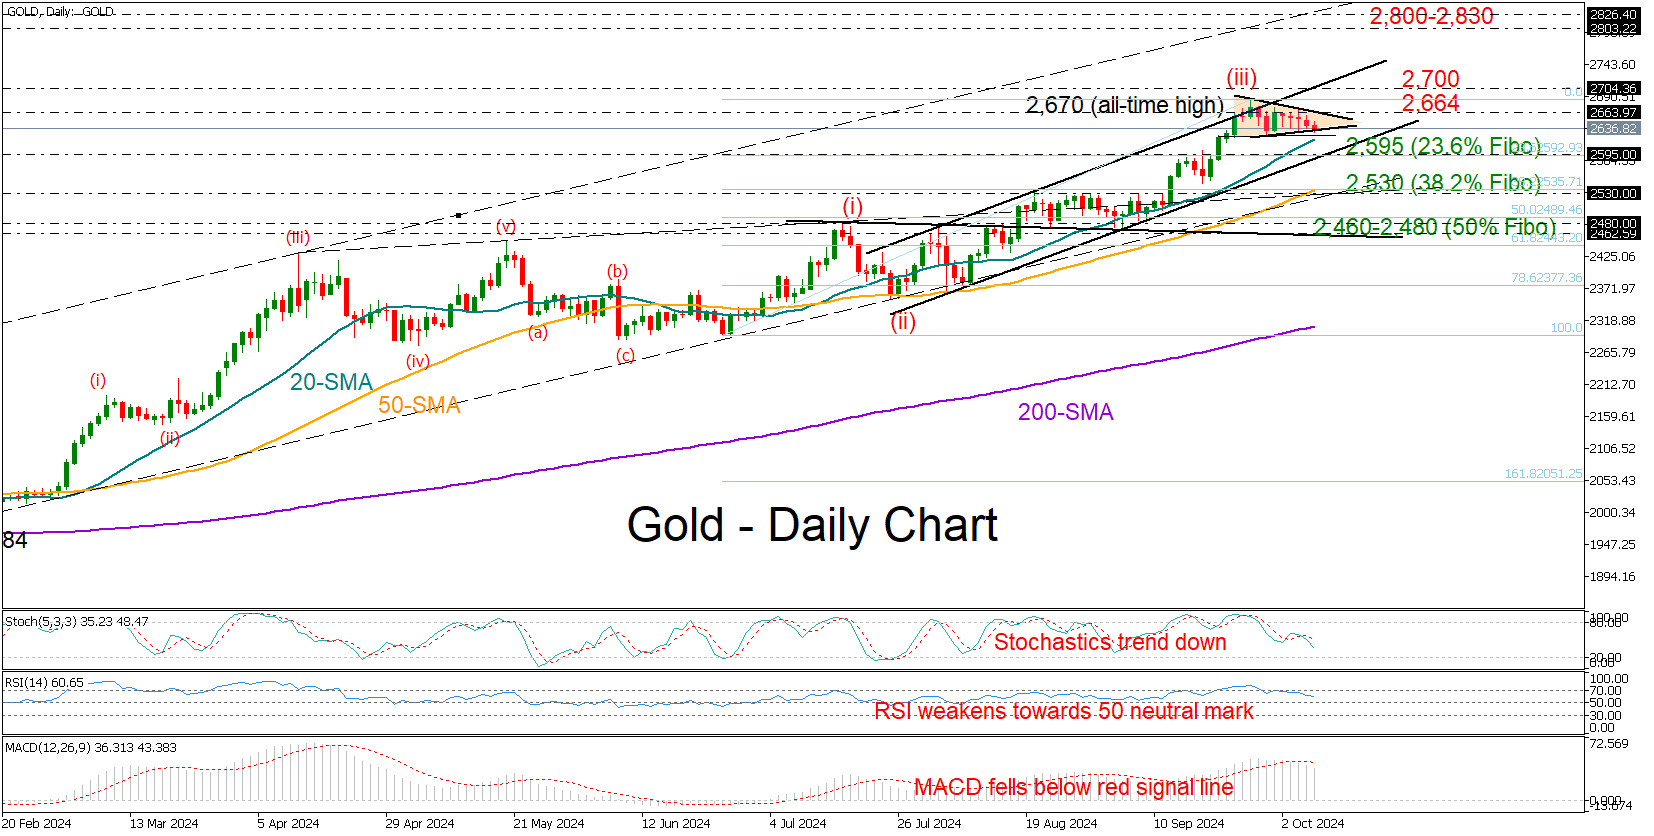
Gold held within the range of 2,624-2,670 despite the upbeat US jobs data last Friday, forming a symmetrical neutral triangle at the top of its broad uptrend.
Falling technical indicators suggest that buying sentiment is fading, leaving the precious metal vulnerable to downward movements in the upcoming sessions.
That said, traders are unlikely to be concerned unless the price dives below the lower band of the three-month-old bullish channel near 2,595. This overlaps with the 23.6% Fibonacci retracement of the 1-3 Elliot wave upward pattern. Therefore, should sellers violate that base, the price could sink towards its 50-day SMA and the long-term support trendline from February at 2,528. Even lower, the door might open for the 50% Fibonacci mark of 2,480 and the almost flat restrictive line at 2,460, a break of which would shift the medium-term outlook back to neutral.
Once the price surges above the triangle and the 2,664 level, the spotlight will immediately turn to the 2,700 psychological number and the channel’s resistance line. A successful penetration higher could last till the 2,800-2,830 region, where the ascending line that connects the highs from December 2023 and April 2024 is positioned.
Summing up, gold is expected to take a breather following its latest peak at an all-time high of 2,670. Any downside movements could be part of the ongoing positive trend.
Fed’s Kugler: Inflation progress key, but focus on employment also needed
In a speech today, Fed Governor Adriana Kugler expressed her support on "shifting attention to the maximum-employment side" of the dual mandate, while maintaining focus on fighting inflation.
While labor market "remains resilient", Kugler emphasized, the important of "avoiding an undesirable slowdown in employment growth and economic expansion."
Regarding future rate decisions, Kugler noted that, “If progress on inflation continues as I expect, I will support additional cuts in the federal funds rate to move toward a more neutral policy stance over time."
However, she remained cautious, suggesting that if downside risks to employment rise, Fed may need to "more quickly" in easing policy to a neutral stance.
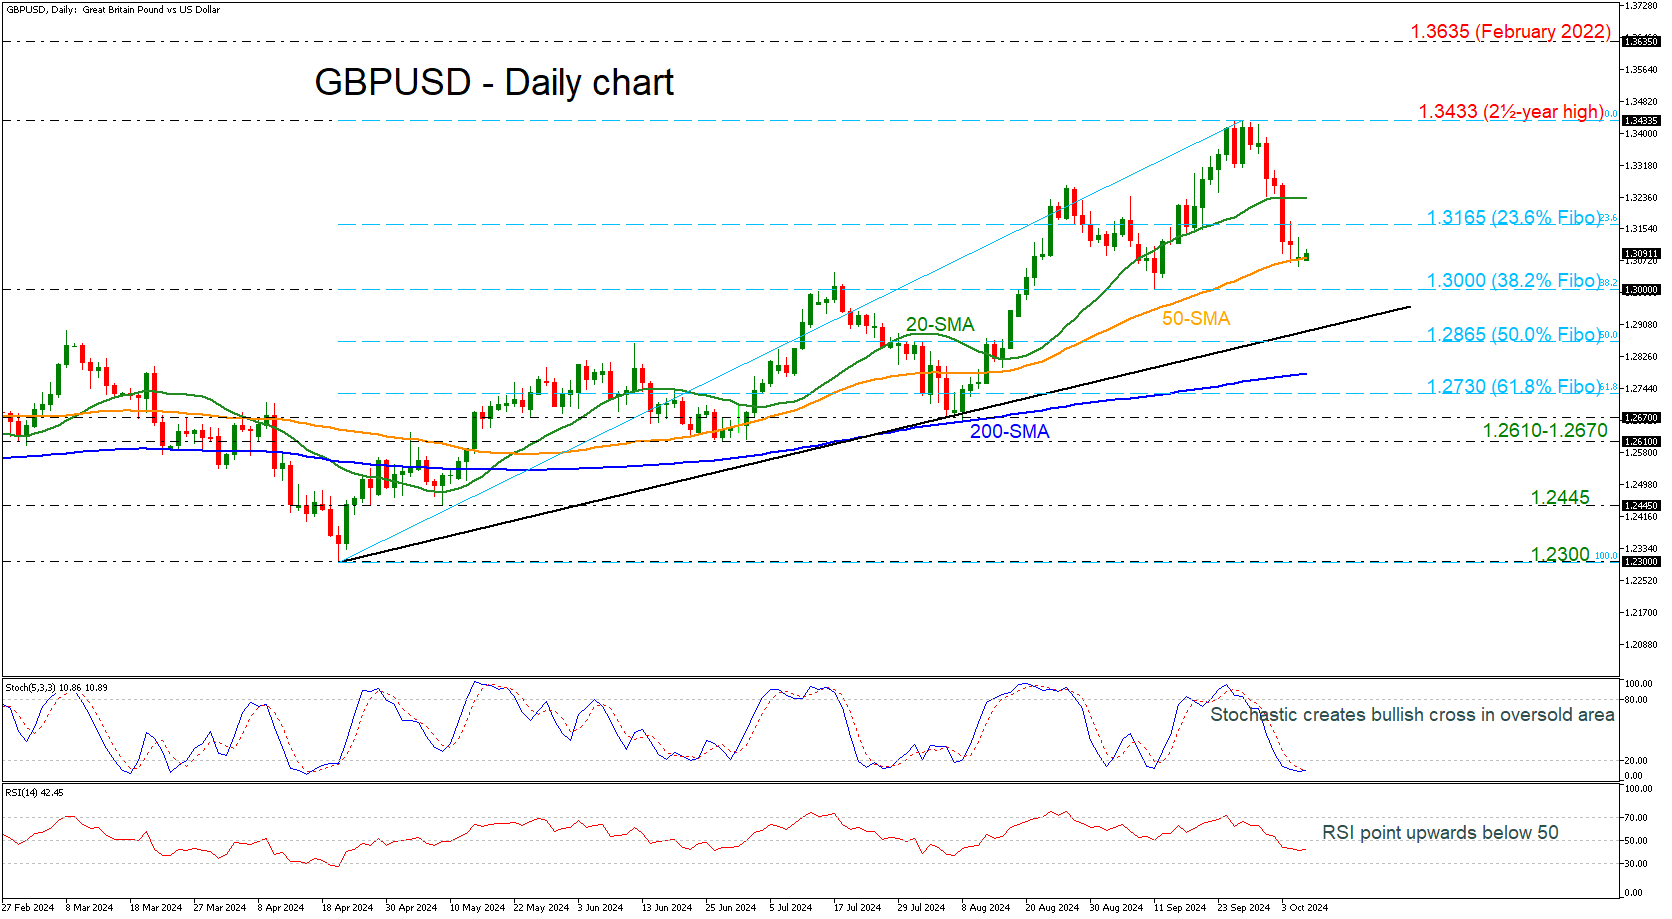
GBPUSD loses 3% from 2½-Year High
- GBPUSD stops near 1.3100
- Momentum oscillators suggest upside recovery
GBPUSD is pausing its downward wave that started from the two-and-a-half-year high of 1.3433, hovering near the 50-day simple moving average (SMA) marginally beneath the 1.3100 round level.
The pair has lost around 3%, with the technical oscillators indicating the end of the southward move. The stochastic posting a bullish crossover within its %K and %D lines in the oversold area and the RSI pointing up beneath the 50 territory.
Should the pair manage to strengthen its positive momentum, the next resistance could come around the 23.6% Fibonacci retracement level of the up leg from 1.2300 to 1.3433 at 1.3165. Slightly higher, the 20-day SMA at 1.3235 is coming next and any break above the 1.3433 top would shift the bias to a more bullish one and open the way towards the February 2022 peak at 1.3635.
However, if prices are unable to break the 23.6% Fibo level in the next few sessions, the risk would shift back to the downside, with the 38.2% Fibonacci at 1.3000, which is a key level for traders, coming into focus. A drop below this mark, would take the market towards the medium-term uptrend line and the 50.0% Fibonacci of 1.3865.
In the bigger picture, the pair is bullish as long as it holds above the 200-day SMA and the ascending trend line. In case it violates these lines, the bears could gain the upper hand.