Sample Category Title
RBA Minutes: Not Enough to Change, but a Shift in Financial Emphasis
Although momentum in domestic demand has turned out a bit weaker than the RBA expected, in September the RBA contemplated scenarios warranting both tighter and looser financial conditions.
The RBA minutes for the September 2024 Board meeting were less hawkish about supply potential than the August minutes. However, we detect an increasing emphasis on assessments of financial conditions more broadly, and a willingness to see these as a reason to hold the cash rate where it is.
Underlying inflation was characterised as being too high still, although the minutes noted that headline CPI for August would print below 3% because of the electricity subsidies. The minutes also noted the slowing in growth of advertised rents, which will feed through to CPI rent inflation over time.
After highlighting in August the downward revision in the staff’s view of supply capacity, the minutes for the September meeting acknowledged that momentum in demand was also weaker than previously believed. Consumption had been weaker in the June quarter than the RBA expected and the response to the Stage 3 tax cuts had gotten off to a slow start in July. Even allowing for the reallocation of some electricity consumption from household spending to government subsidy (and so public demand), downside risks on household spending were front of mind.
In other words, some of the hawkishness of the August meeting was likely unwarranted. Indeed, it was toned down in the post-meeting statement and minutes for the September meeting. The RBA assesses that the output gap is still positive but closing. That said, we note that the median estimate of private sector economists for March quarter 2024 was just 0.1%. Against this downward revision to domestic demand, subsequent announcements by the Chinese authorities have mitigated some of the downside risks to Australia’s external demand. In addition, the Board noted the pick-up in credit growth and decline in longer-term interest rates. It therefore judged that financial conditions had eased in recent months.
The minutes described the labour market as still being tighter than full employment but easing broadly as expected. Some of the strength in labour supply was recognised as being a response to cost-of-living pressures, as we noted back in August. Job vacancies had not yet returned to pre-pandemic levels. However, we struggle to reconcile why that is the appropriate benchmark. Many advanced economies saw unemployment reach multi-decade lows in the late 2010s, while Australia still clearly had considerable labour market slack at that time.
The minutes acknowledged the point about productivity that Westpac Economics has been making for some time. A rising share of employment in the non-market sector is dragging down measured total productivity growth. Yes, some market sectors had also seen weak productivity growth, something we have also noted previously. This matters in the RBA’s framework for thinking about the economy because the relationship between wages growth and productivity growth determines unit labour cost growth and (assuming constant markups) so inflation. But since wages growth is indeed easing as expected, it is not clear why a trend common to other countries remains a medium-term concern.
The minutes also included the regular half-yearly update on financial stability and a review of the Term Funding Facility; the latter will also be the subject of a speech by Assistant Governor (Financial Market) Chris Kent, presumably the speech scheduled for this week. Neither section contained any news on the RBA’s current monetary policy thinking. However, there was a hint in the financial stability section that the Board is giving more thought to the risks to financial stability should financial conditions ease. This also plays into the risk discussed in the Considerations for Monetary Policy section, that financial conditions might ‘turn out to be insufficiently restrictive to return inflation to target’.
More broadly, the Board seems to be putting increasing weight on its assessment of financial conditions as a guide to where policy needs to be. Like ‘full employment’ or ‘the output gap’, ‘financial conditions’ is an invisible construct that can only be inferred, not observed directly. And like full employment and the output gap, the RBA has documented a checklist for how it assesses them. However, it has not yet explained what the mechanism is for looser financial conditions to result in higher inflation than expected or desired ‘even if the Board’s judgements about consumption, the labour market and supply potential prove correct’, as the minutes put it. Normally one would expect looser financial conditions to influence firms’ pricing decisions through stronger demand. Perhaps this will be explained further in future speeches.
Markets Apparently Not Convinced Measures Able to Profoundly Change Fortunes for Chinese Economy
Markets
Investors yesterday continued to adapt positions in the wake of Friday’s impressive payrolls beat. The Fed recently indicated that inflation has cooled enough to the turn the focus to supporting growth and protecting a strong labour market. However, Friday’s payrolls and other US data of late are raising the question whether/how much support the US economy currently needs. Probably less than the Fed (and the market) assessed when the Fed started cutting rates with a 50 bps step back in September. After Friday’s sharp rise, US yields again added between 7.3 bps (2-y) and 5.5 bps (30-y). For the end of the year, 50 bps Fed cuts is still discounted, but markets see a limited chance of the Fed already being forced to take a pause in November (only 85% discounted). Fed officials, including New York Fed president Williams (FT this morning) indicate that the US economy is well positioned to keep strength in the economy and in the labour market and that it might result in a soft landing scenario. With respect to the pace of further easing, Williams indicates that last dots plot is a very good base case. The 50 bps start was a good decision at that time, but is no rule of how the Fed will act in the future. Returning to yesterday, German/EMU yields markets felt some spillover effects from the rise in the US, rising between 4.4 bps (2-y and 30-y) and 5.2 bps (5-y). (US) Equities this time didn’t build on the ‘no-landing’ gains that propelled indices on Friday and fell prey to profit taking. (S&P 500 -0.96%). After breaking several technical levels on Friday, the dollar rally ran into resistance (DXY 102.54, EUR/USD 1.0978).
Asian markets mostly show a mixed, hesitant picture this morning. Mainland China shares are gaining as markets reopen after the holiday period (CSI 300 +4.2%), but Hong Kong shares tumble (Hang Seng -7.0%). Markets apparently are not convinced that the recent monetary and fiscal measures will be able to profoundly change fortunes for the Chinese economy. There are few important eco data in the US and in Europe scheduled for release today. The focus remains on the US CPI data scheduled for release on Thursday. This evening we look out for a $58 bln sale of 3-y US notes. The US 2-y and 10-y yield are nearing the psychological barrier of 4.0% and markets have scaled back expectations on the pace of Fed easing to 25 bps (or even slightly less) for at least the four upcoming Fed meetings. For now, even after the strong payrolls, we think that enough easing is priced out. Both markets and the Fed now are in a genuine data-depended modus where guidance/and the market assessment might change with every batch of important data. Today, a mild risk-off also might cap a further rise in yields. In theory, this still should favor the dollar, but the greenback of late often resigned to its safe haven status.
News & Views
Total UK retail sales rose by 2% Y/Y in September according to data from the British Retail Consortium and KPMG. It’s the fastest pace since March and above that 12-month average of 1.1% growth. BRC chief executive Dickinson said that shoppers sought to update their wardrobes with coats, boots and knitwear as autumn rolled out across the UK. The start of the month also saw a last-minute rush for computers and clothing for the new academic year. Non-food sales fell by 0.3% Y/Y which is the slowest pace of decline YTD. Food sales increased by 3.1% Y/Y, the biggest increase since May. All eyes are now on the Budget and the impact that it will have on discretionary spending in the final, “Golden”, quarter of the year.
The head of the Bank of Italy’s economics and statistics department, Altimari, warned in parliament that the economy will expand less than previously expected this year. An accounting revision by Istat means a mechanical downward correction by 0.2 percentage points (0.4% from 0.6%) to the current year’s growth estimate. The current government growth forecast of 1% is becoming very unrealistic. The Italian central bank also called for a prudent approach to public finances, saying the government should concentrate on lowering the country’s mammoth debt, which is currently above 130% of gross domestic product.
Graphs
GE 10y yield
The ECB cut policy rates by 25 bps in June and in September. Stubborn inflation (core, services) still is a source of concern, but very weak PMI’s and soft comments of Lagarde (and other MPC members) suggest the ECB is likely to step up the pace of easing with an October cut. Spill-overs from strong US data prevented a test of the 2.0% barrier. 2.00-2.35% might serve as a ST consolidation range.
US 10-y yield
The Fed kicked off its easing cycle with a 50 bps move. The Fed shifting focus from inflation to a potential slowdown in growth/employment made markets consider more 50 bps steps. Strong US September payrolls suggest the economy doesn’t need aggressive Fed support for now, but the debate might resurface as the economic cycle develops. For the US 10-y, 3.60% serves as strong support. The steepening trend is taking a breather.
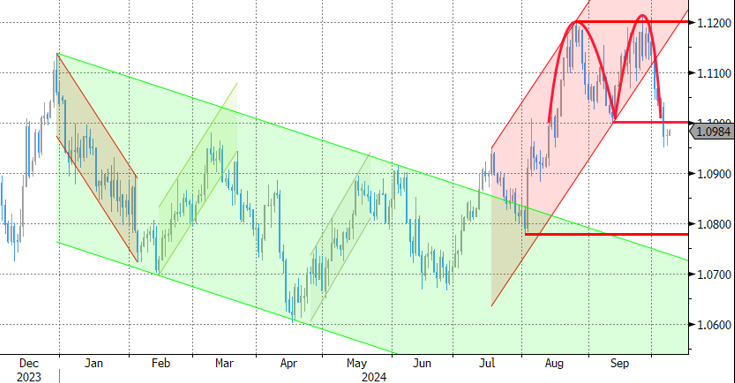
EUR/USD
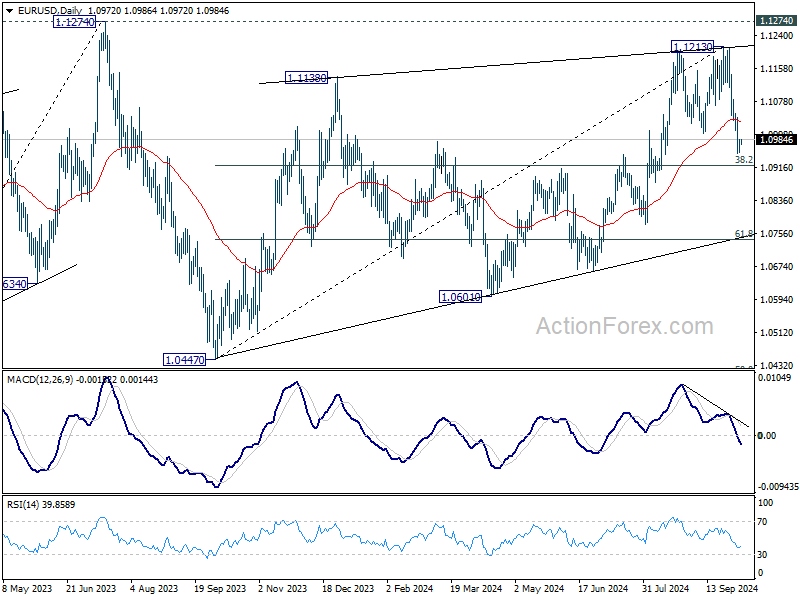
EUR/USD moved above the 1.09 resistance area and twice tested the 1.12 big figure as the dollar lost interest rate support at stealth pace. Bets on fast and large rate cuts trumped traditional safe haven flows into USD. An ailing euro(pean economy) partially offset some of the general USD weakness. After solid early October US data, the dollar regained traction, with EUR/USD breaking the 1.1002 neckline. Targets of this pattern are near 1.08.
EUR/GBP
The BoE delivered a hawkish cut in August. Policy restrictiveness was indicated to be further unwound gradually. The economic picture between the UK and Europe also was increasingly diverging to the benefit of sterling, pulling EUR/GBP below 0.84 support. Dovish comments by BoE Bailey ended by default GBP-strength.
ECB’s Elderson warns of materializing growth risks
In an interview with Slovenia’s Delo newspaper, ECB Executive Board member Frank Elderson highlighted growing risks to economic growth across the Eurozone, noting that "a number of recent indicators suggest that risks of lower economic growth are already materializing."
Elderson emphasized that ECB remains data-driven, and officials will approach the upcoming October 16-17 meeting "with an open mind." He reiterated the importance of a genuine and open discussion among members, stressing that no decisions will be made in advance of reviewing the full range of economic data.
Fed’s Williams: September’s half-point cut not the norm
In an interview with the Financial Times, New York Fed President John Williams described the latest “dot plot” projections, which show expectations for two quarter-point rate cuts at the remaining meetings this year, as a “very good base case.” He emphasized, however, that these cuts would depend on economic data, rather than following a "preset course."
Williams also noted that the larger half-point rate cut in September was not “the rule of how we act in the future”. Instead, he explained that the focus for policymakers is to eventually move interest rates toward a neutral setting, one that neither stimulates nor restricts demand.
China Disappoints, Middle East Worries
The week started on an ugly note except for those who have a long exposure to energy related assets. The crumbling dovish Federal Reserve (Fed) expectations at the wake of a blowout jobs report from the US and the mounting geopolitical tensions in the Middle East give investors a hard time at the start of this week. The US 2-year yield advanced to 4% for the first time since August and consolidates near 3.95% this morning, while the 10-year yield advanced and stayed at 4%. The barrel of US crude traded past the $78pb, and Brent crude traded past the $80pb mark. Some profit taking is taking place right now as Chinese authorities announced no new stimulus measures as expected today, but given the rising tensions and the lack of visibility on how the complex geopolitical situation could resolve, oil prices have a further room to run toward the upside. US crude currently sees resistance near the 200-DMA (near $78pb), but a rise to and above the 200-DMA and to and above $80pb is possible and probable, especially if the Iranian oil facilities become targeted by the US-backed Israel. In the long run, regardless of how messy the Middle East picture gets, oil prices will end up giving back the geopolitically-led gains, but the severity of the conflict could prolong the correction timeline. That, combined to the Chinese stimulus measures and lower rate prospects could have a material impact on inflation expectations globally and bring the Fed members’ attention back to the inflation leg of their mandate.
As such, the unalarming nature of the US jobs numbers and the spike in oil prices get investors to question whether the US needs another rate cut in the November meeting. That idea has been maturing since Monday as the ‘no landing’ scenario is gently creeping in, suggesting that the US economy will continue to grow, inflation will remain sticky and the Fed will be stuck with its rate policy in the coming months. The probability of a 50bp cut fell to 0% post-US jobs data, the probability of no November cut was standing just around 2% yesterday and is up to 12% today.
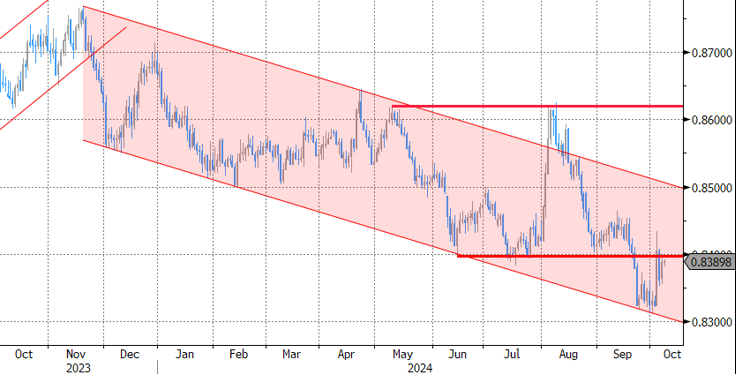
The sharp retreat in Fed expectations gives support to the greenback which has been weakening since summer. The US dollar index surged and stabilized near a major Fibonacci level after last week’s jobs data, the 38.2% retracement on summer retreat, the 102.50 level, that should distinguish – later this week when the US CPI update lands - between the latest bearish trend and a medium-term bullish reversal. Likewise, the EURUSD bears are waiting in ambush near the 1.0980 level, the major 38.2% Fibonacci retracement on the summer rebound, to decide whether to send the euro into the medium-term bearish consolidation zone against the greenback. And even the Aussie – which sees the positive vibes from the Chinese stimulus measures, an open-minded Reserve Bank of Australia (RBA) regarding both rate cuts and rate hikes depending on the economic situation and where the consumer mood hit the highest levels in 2.5 years, is testing its own major Fibonacci support this morning, near 0.6720 level.
One thing that will help traders decide what direction to take is the US CPI, due to be released on Thursday. If soft enough, Thursday’s CPI update could eventually help calming the Fed doves nerves and prevent the US dollar from stepping into the medium-term bullish consolidation zone against many majors. If not, the no November cut pricing could take off, and that would mean higher yields, a stronger US dollar across the board, weaker other currencies, and some negative pressure on equity valuations as the US indices continue to wait near ATH levels.
The S&P500 gave back around 1% yesterday. Tech stocks were heavily hit, oil stocks gained. The VIX index is rising, suggesting that a lack of appetite could encourage investors to take profit and move to the sidelines.
Elsewhere, China returned from national holiday with a jump in stock prices, but the CSI 300 index has been giving back gains since then and the HSI index is down by 7.5% as the latest briefing from the Chinese government offered no new stimulus measures. Copper and iron ore futures are both under pressure, as well, on the growing worry that the positive impact of the stimulus measures could remain short-lived, and that the measures would be insufficient to reverse the property meltdown, deflation and other structural problems – like the aging population and heavy local government debt burden.
Swedish CPI Figures in Focus Today
In focus today
From the US, NFIB's Small Business Optimism index is due for release for September. Markets focus especially on employers' perception of labour market conditions. Fed's Bostic will speak this evening.
In Sweden, we receive preliminary inflation figures. We expect CPI, CPIF and CPIF excluding Energy to print 0.2% m/m and 1.6% y/y; 0.3% m/m and 1.1% y/y; and 0.3% m/m and 1.9% y/y, respectively. Our prediction for CPIF is 0.1 percentage points higher than the Riksbank's forecast and CPIF ex energy is spot on. The flash estimate will include only the monthly and annual changes, reserving the detailed breakdown of components for the regular release.
In Germany, we look out for the industrial production data for August. Industrial production has been on a declining trend for the past year and survey data suggests the weakness persisted in August. The hard data on production in Germany will be important for the growth assessment which continues to look bleak.
On the night of Wednesday, we expect the Reserve Bank of New Zealand (RBNZ) to cut the Official Cash Rate by 50bp. Analyst consensus is divided between 25bp and 50bp moves, but markets have almost fully priced in the larger cut.
Economic and market news
What happened overnight
In China, the chairman for the National Development and reform commission said that the Chinese government is fully confident that it will reach its economic and social development goals for this year and said that some of the 2025-budget will be issued this year to support projects. Since late September the government pushed economic stimulus package to support the economy. The key to turning the Chinese slump is to put a stop to the housing crisis, which we see as the epicentre of current challenges. We now look for a gradual improvement in housing over the next year but not a fast rebound. Last week we revised up our Chinese growth forecast from 4.8% to 5.2% in 2024, see Research China - Lift to GDP forecast after leaders draw line in the sand, 2 October. Investors were disappointed by the lack of detail in the plans and offshore stocks corrected sharply lower by more than 5%. However, it follows a strong rally of close to 40% in two weeks.
What happened yesterday
In the Middle East, fighting between Hezbollah and Israel intensified yesterday, one year after Hamas attacked Israel on 7 October last year. Hezbollah said it targeted a military base south of the Israeli city Haifa with missiles. Israel confirmed the attack. We are yet to see Israel's counter-attack to Iran's missile barrage a week ago. Israeli response is likely to determine the course forward in the conflict.
In the euro area, the investor morale measured by the Sentix index increased in October, after a decline the previous three months. Despite the increase investor morale is still at relatively low levels.
In Germany, factory orders fell more than expected, hinting that German manufacturing sector is not set to recover in the coming months. Orders fell 5.8% (consensus: -2%, prior: 2.9%). Later today, it will be interesting to see how industrial production performed in August in the light of the disappointing order flow.
Equities: Global equities, or to be more precisely, US equities were lower yesterday, dragging down global indices. Conversely, European, Far Eastern, and Japanese markets were all higher. Examining the sector returns from yesterday provides a clear insight into the prevailing market dynamics. During a sell-off session, with utilities performing the worst, one typically needs to consider the bond market, where the hawkish repricing of the Fed continued. Additionally, a soaring oil price and the US election now less than a month away contributed to the rising uncertainty, pushing the VIX towards the 23 level. Thus, the US election might well be a "sell the rumours, buy the fact" event. The main US indices yesterday were as follows: Dow -0.9%, S&P 500 -1.0%, Nasdaq -1.2%, and Russell 2000 -0.9%. This morning, a stock price bonanza is continuing in China. With the conclusion of the Golden Week trading holiday, mainland shares are soaring (up around 5% at the time of writing). The flipside is that H-shares in Hong Kong are down 5%, as the Chinese authorities have not yet followed up with stimulus measures post the Golden Week holiday. European futures are down significantly this morning, catching up to the US's late cash action yesterday. US futures are close to flat.
FI: The repricing of monetary policy expectations continued Monday as global bond yields continued to rise on the back of the stronger-than-expected US labour market data last week and rising oil prices. Hence, the US curve flattened from the short end with 2Y Treasuries rising some 8bp, while 10Y and 30Y Treasuries rose 5-6bp. We saw the same picture in the Europe with rising bond yields, but where the periphery underperformed modestly the core-EU especially in the front end of the curve as the Schatz ASW-spread widened some 2bp.
FX: EUR/USD has been consolidating just below the 1.10 mark in a quiet start to the week, with the broad USD index showing little change after its best week in two years. EUR/GBP moved higher with the KPMG/REC report showing further signs of wage growth cooling and softness in the labour market. Yesterday's slightly more expansionary than expected fiscal budget in Norway, the global rates-environment and higher oil prices contributed to a substantial rise in short-end NOK rates which in turn lifted NOK FX. NZD/USD continued to edge lower yesterday ahead of Reserve Bank of New Zealand's (RBNZ) rate decision early tomorrow morning.
EUR/USD Daily Outlook
Daily Pivots: (S1) 1.0956; (P) 1.0972; (R1) 1.0989; More....
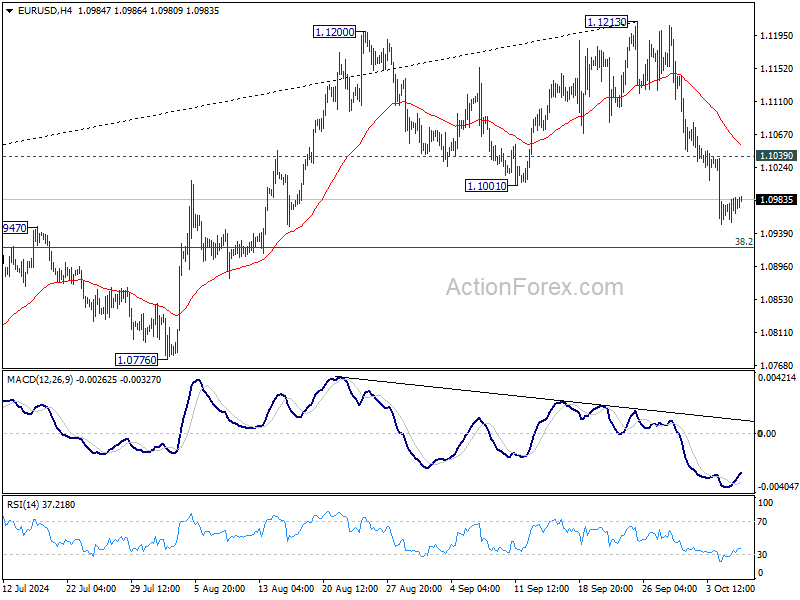
Intraday bias in EUR/USD stays on the downside. Fall from 1.1213 short term top is in progress for 38.2% retracement of 1.0447 to 1.1213 at 1.0920. Sustained break there will argue that fall from 1.1213 is the third leg of the corrective pattern from 1.1274. In this case, deeper decline would be seen to 61.8% retracement at 1.0740 next. On the upside, above 1.1039 minor resistance will turn intraday bias neutral first.
In the bigger picture, rejection by 1.1274 resistance suggests that corrective pattern from 1.1274 (2023 high) is not completed yet. Instead, decline from 1.1213 might be another falling leg. Sustained break of 55 W EMA (now at 1.0877) will validate this case, and bring deeper fall towards 1.0447 support again.
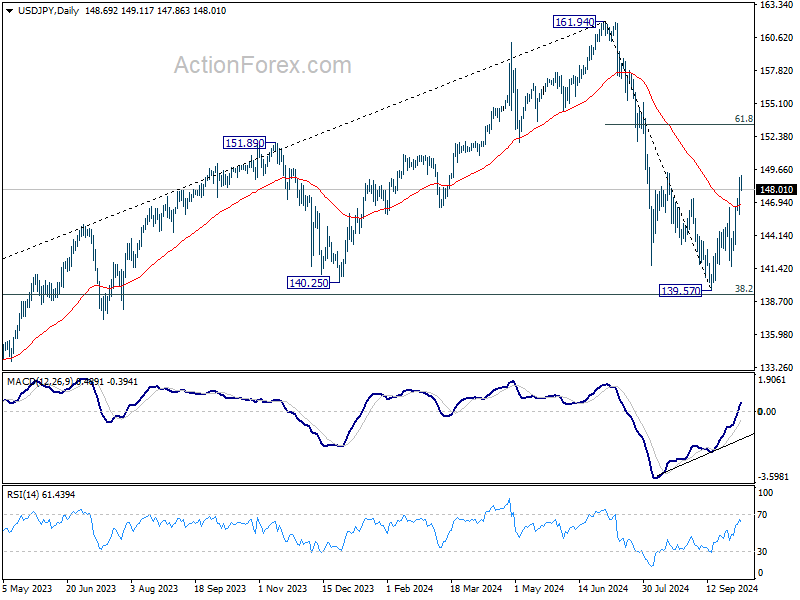
USD/JPY Daily Outlook
Daily Pivots: (S1) 147.65; (P) 148.39; (R1) 148.93; More...
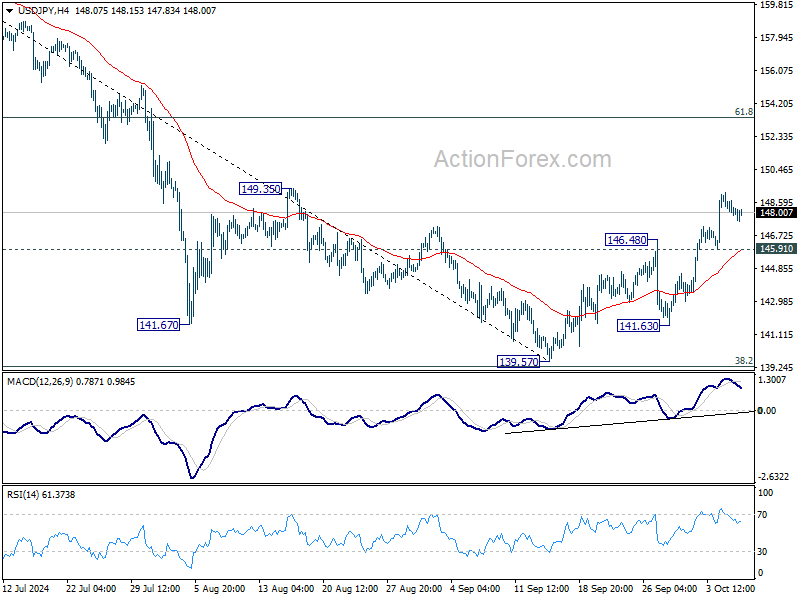
Intraday bias in USD/JPY remains on the upside as rebound from 139.57 low is in progress. This rally is seen as the second leg of the corrective pattern from 161.94. Break of 149.35 resistance will target 61.8% retracement of 161.94 to 139.57 at 153.39 next. On the downside, below 145.91 minor support will turn intraday bias neutral again.
In the bigger picture, price actions from 161.94 are seen as a corrective pattern to rise from 102.58 (2021 low). The range of medium term consolidation should now be set between 38.2% retracement of 102.58 to 161.94 at 139.26 and 161.94. Nevertheless, sustained break of 139.26 would open up deeper medium term decline to 61.8% retracement at 125.25.
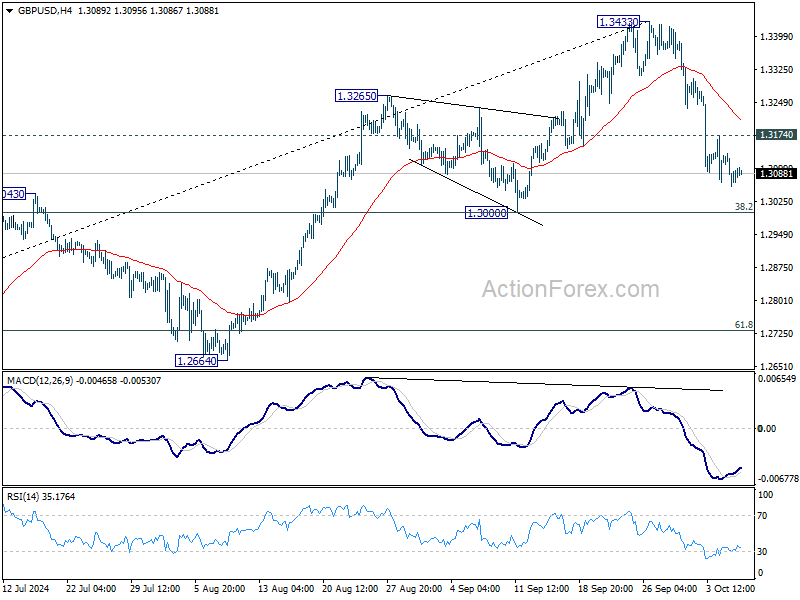
GBP/USD Daily Outlook
Daily Pivots: (S1) 1.3050; (P) 1.3092; (R1) 1.3126; More...
GBP/USD's fall from 1.3433 short term top is still in progress. Strong support should be seen from 1.3000 cluster support (38.2% retracement of 1.2298 to 1.3433 at 1.2999) to contained downside. Above 1.3174 minor resistance will turn bias back to the upside for stronger rebound. However, decisive break of 1.3000 will carry larger bearish implications.
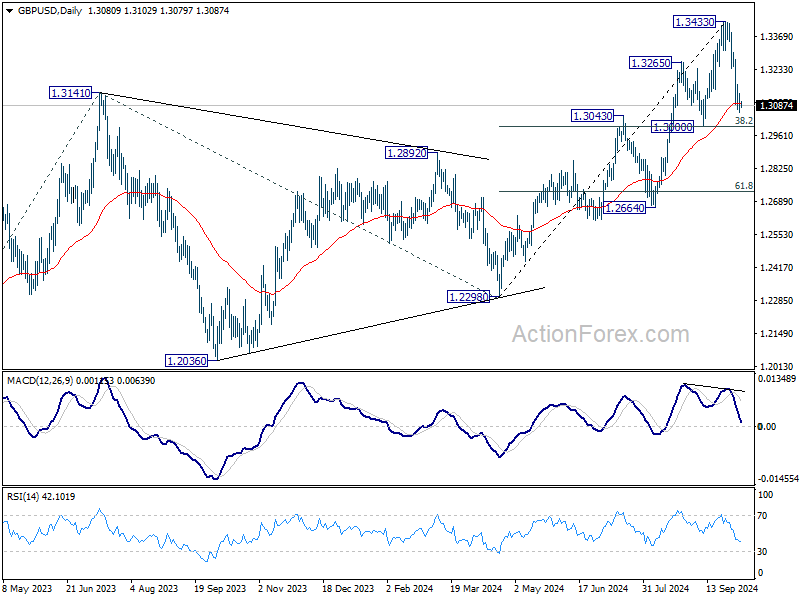
In the bigger picture, as long as 1.3000 support holds, the up trend from 1.0351 (2022 low) is still in progress. Next target is 61.8% projection of 1.0351 to 1.3141 from 1.2298 at 1.4022. However, considering mild bearish divergence condition in D MACD, decisive break of 1.3000 will argue that a medium term top is already in place, and bring deeper fall back to 1.2664 support next.
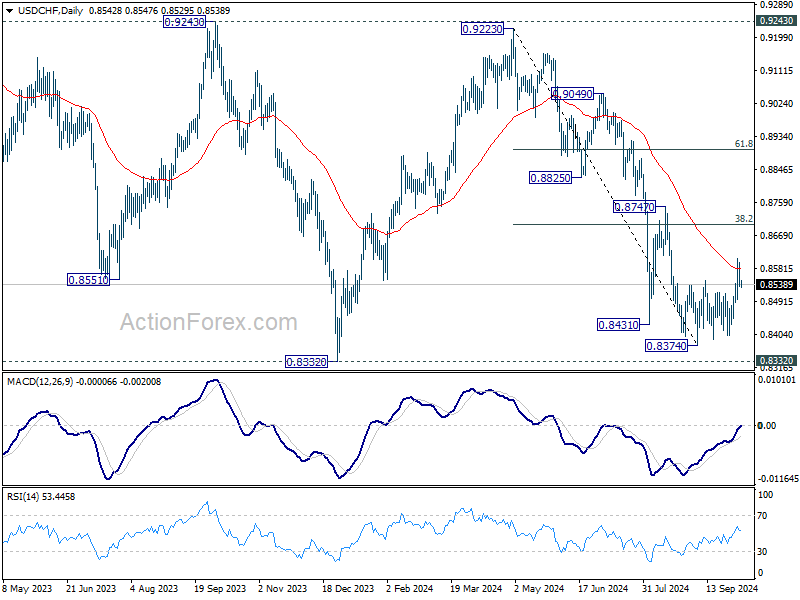
USD/CHF Daily Outlook
Daily Pivots: (S1) 0.8520; (P) 0.8559; (R1) 0.8584; More…
Intraday bias in USD/CHF remains neutral for consolidations below 0.8606 temporary top. Further rise is in favor as long as 0.8499 minor support holds. Above 0.8606 will target 38.2% retracement of 0.9223 to 0.8374 at 0.8698. Sustained break there will argue that fall from 0.9223 has completed after defending 0.8332 low. Next target will be 61.8% retracement at 0.8899. On the downside, break of 0.8499 will turn bias back to the downside for retesting 0.8374 low instead.
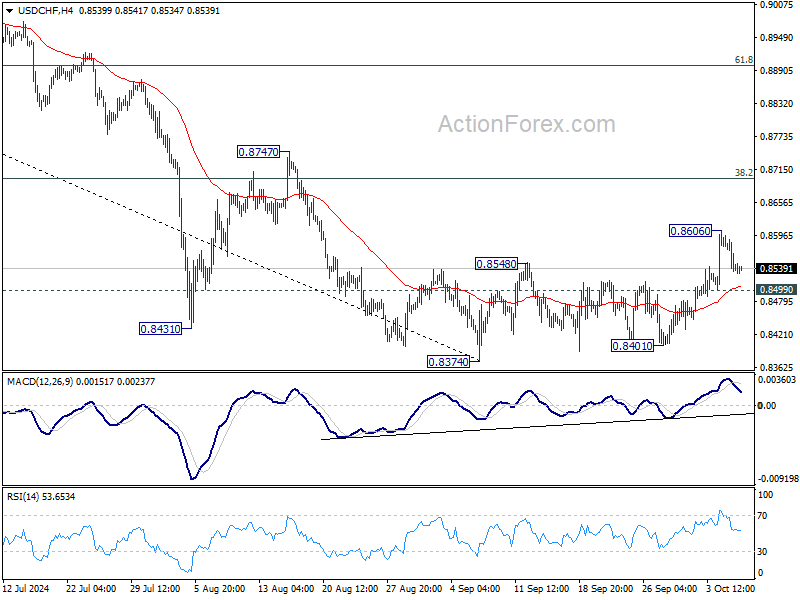
In the bigger picture, price actions from 0.8332 (2023 low) are currently seen as a medium term corrective pattern, with fall from 0.9223 as the second leg. Strong support could be seen from 0.8332 to bring rebound. Yet, overall outlook will continue to stay bearish as long as 0.9243 resistance holds. Firm break of 0.8332, however, will resume larger down trend from 1.0146 (2022 high).