Sample Category Title
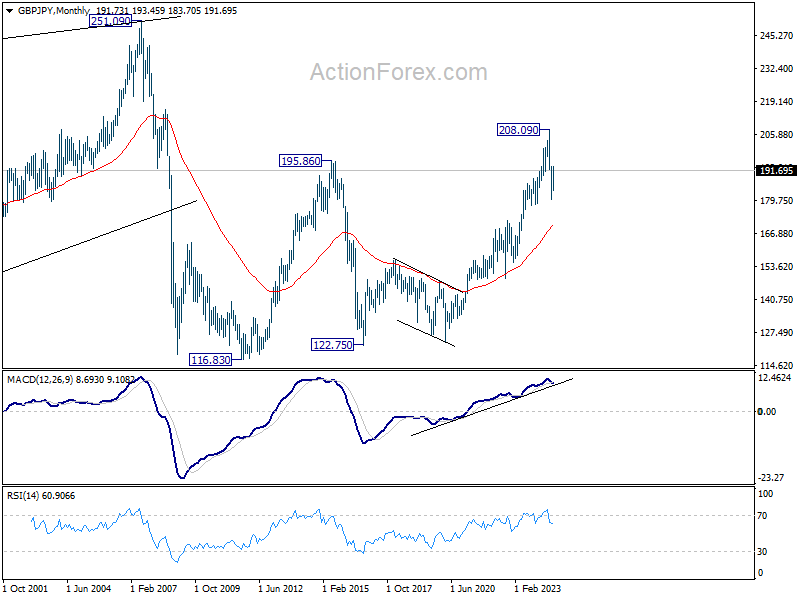
GBP/JPY Weekly Outlook
GBP/JPY's strong rebound last week suggests that fall from 193.45 has completed at 183.70 already. Rebound from there is seen as the third leg of the corrective pattern from 180.00. Initial bias stays on the upside this week for 193.45 resistance first. Firm break there will target 61.8% retracement of 208.09 to 180.00 at 197.35. On the downside, though, below 188.70 minor support will turn intraday bias neutral first.
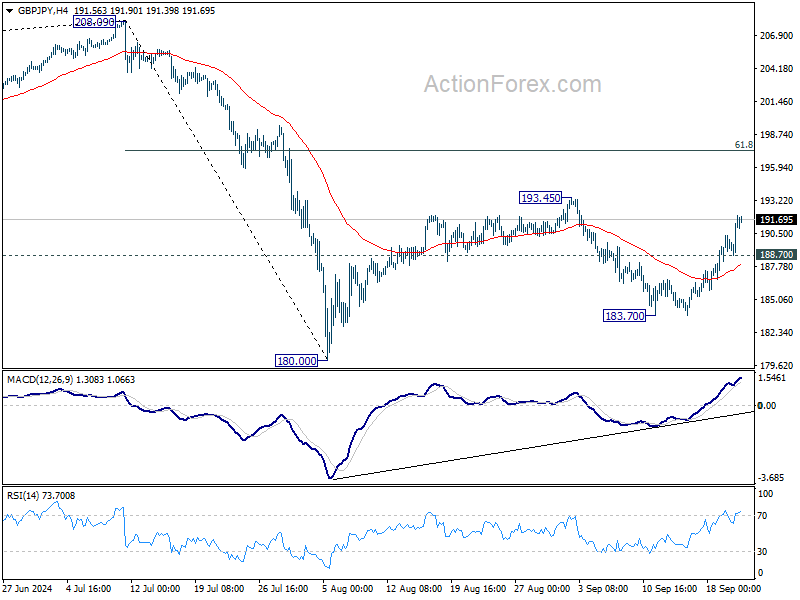
In the bigger picture, price actions from 208.09 are seen as a correction to whole rally from 123.94 (2020 low). The range of consolidation should be set between 38.2% retracement of 123.94 to 208.09 at 175.94 and 208.09. However, decisive break of 175.94 will argue that deeper correction is underway.
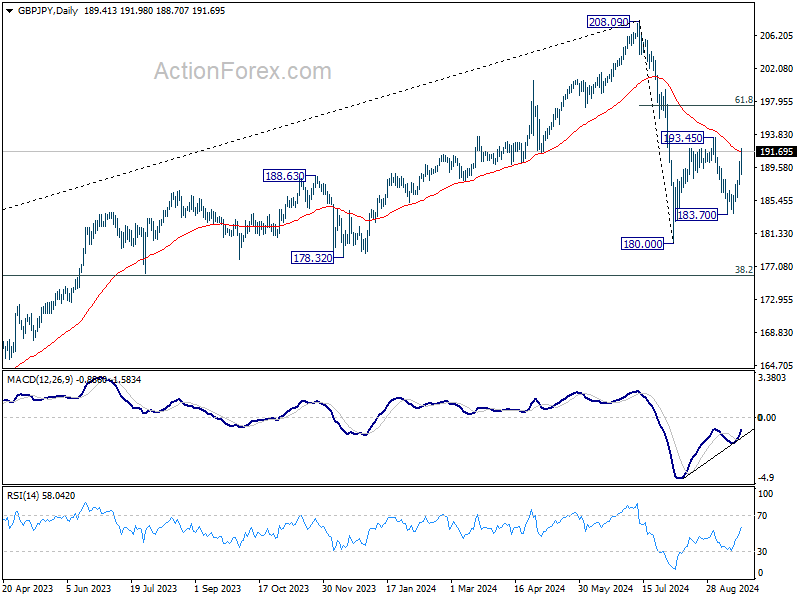
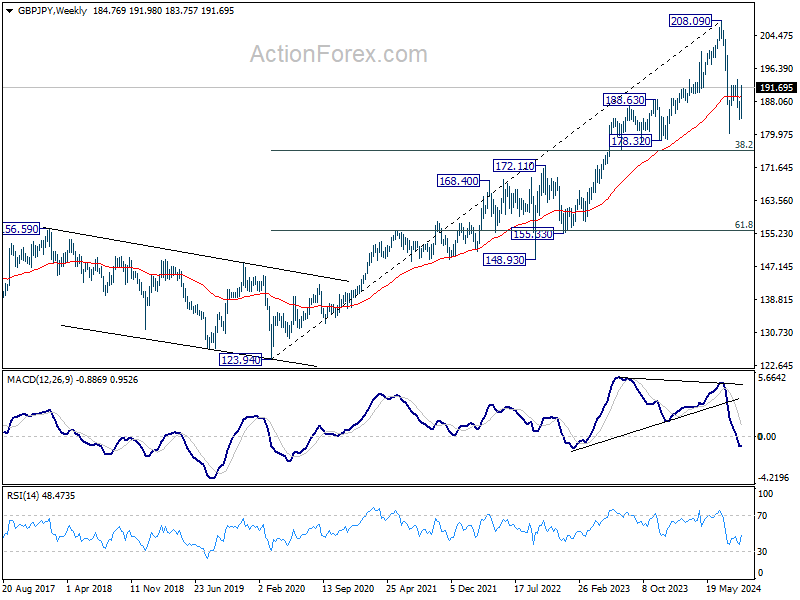
In the longer term picture, considering bearish divergence condition in W MACD, 208.09 is at least a medium term top. It's still early to conclude that the up trend from 122.75 (2016 low) has completed. But it's at least in a medium term corrective phase, with risk of correction to 55 M EMA (now at 170.18).
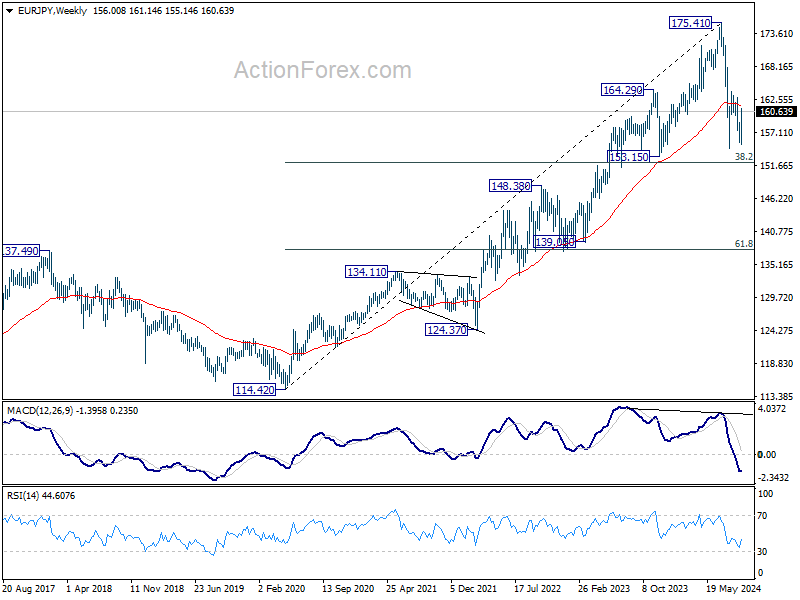
EUR/JPY Weekly Outlook
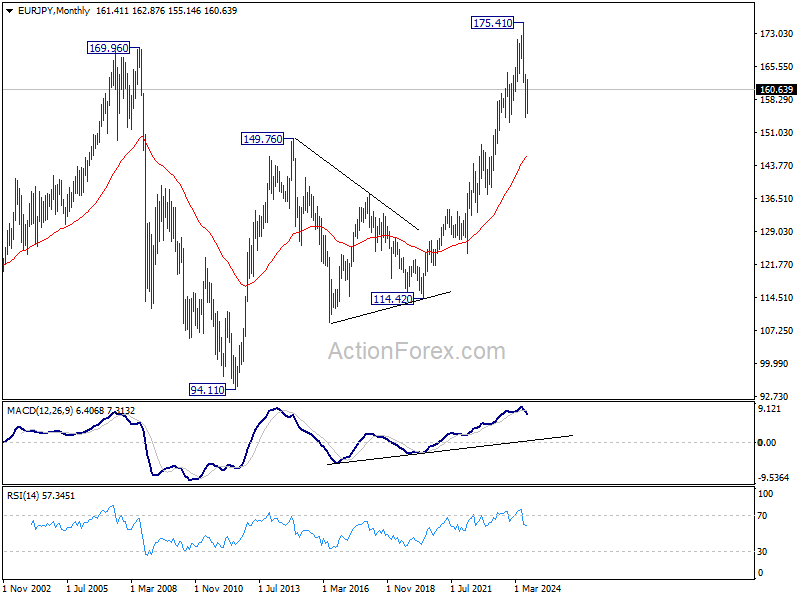
EUR/JPY's strong rebound last week suggests that fall from 163.86 has completed at 155.14 already. Rise from there is seen as the third leg of the corrective pattern from 154.40. Initial bias stays on the upside this week for 163.86 resistance first. Break there will target 61.8% retracement of 175.41 to 154.40 at 167.38. On the downside, though, below 158.31 minor support will turn intraday bias neutral first.
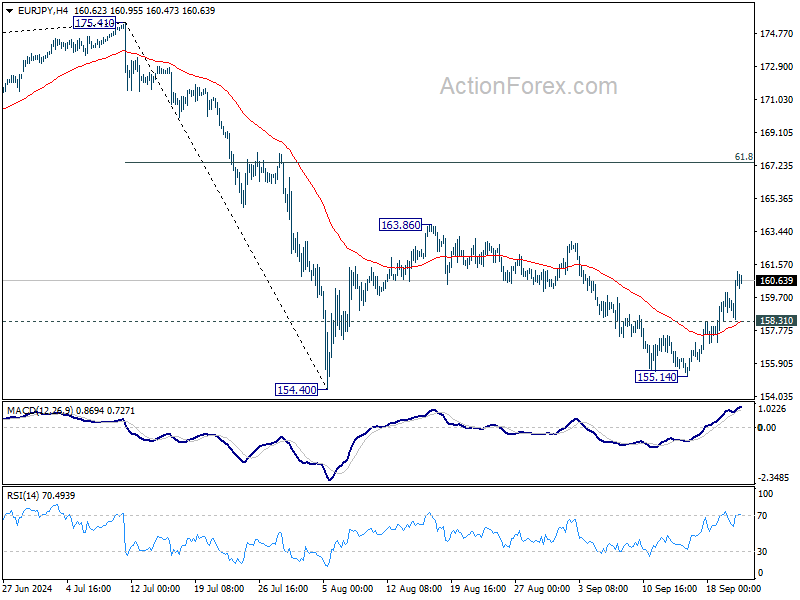
In the bigger picture, price actions from 175.41 are seen as correction to rally from 114.42 (2020 low). The range of consolidation should have been set between 38.2% retracement of 114.42 to 175.41 at 152.11 and 175.41 high. However, decisive break of 152.11 would argue that deeper correction is underway.
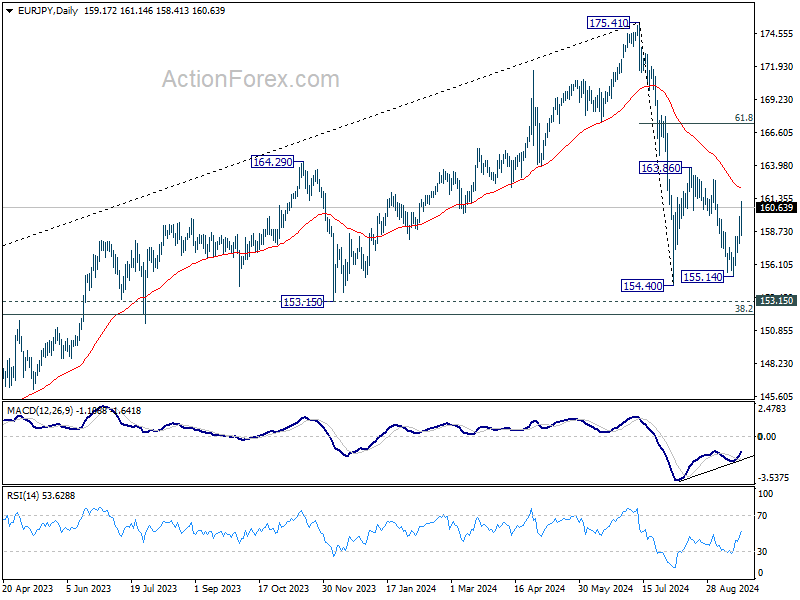
In the long term picture, considering bearish divergence condition in W MACD, 175.41 is at least a medium term top. It's still early to conclude that up trend from 94.11 (2012 low) has completed. But a medium term corrective phase is in progress with risk of deeper fall back to 55 M EMA (now at 145.52).
EUR/GBP Weekly Outlook
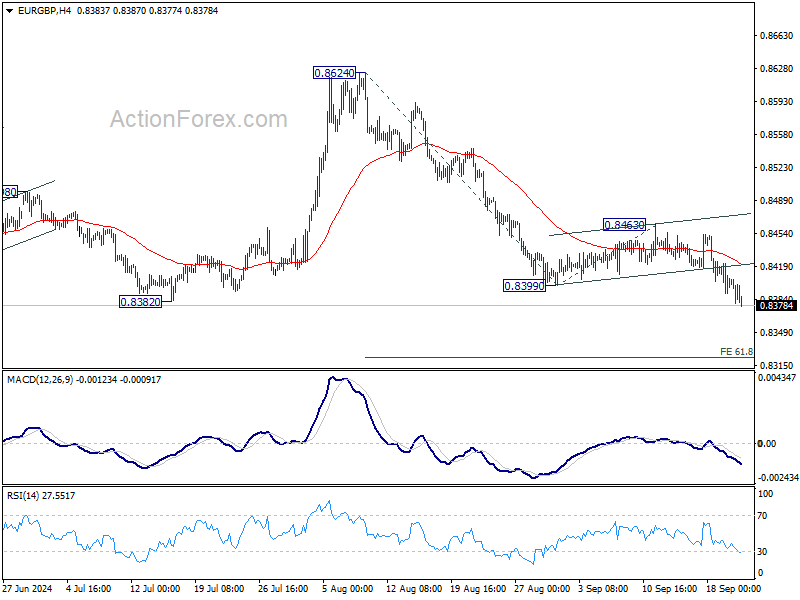
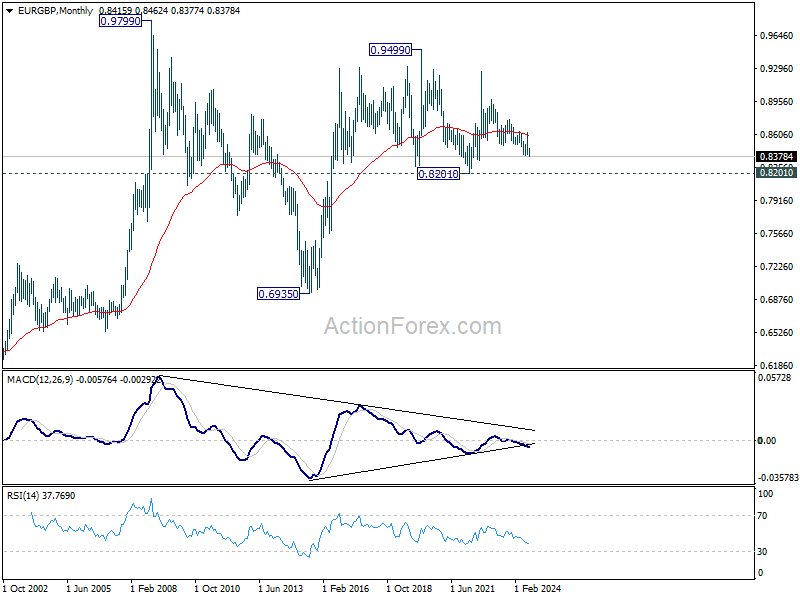
EUR/GBP's closed below 0.8382 support last week indicates larger down trend resumption. Initial bias stays on the downside this week for 61.8% projection of 0.8624 to 0.8399 from 0.8463 at 0.8324. For now, outlook will remain bearish as long as 0.8463 resistance holds, in case of recovery.
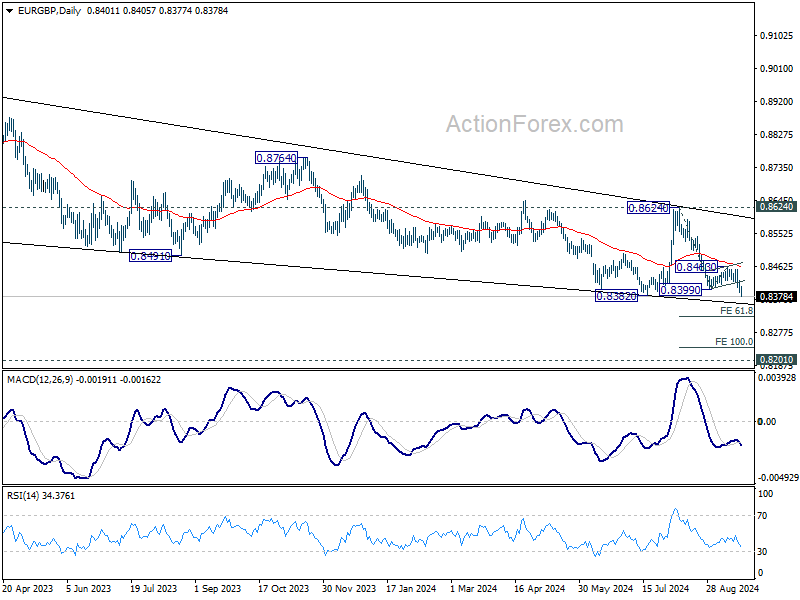
In the bigger picture, down trend from 0.9267 (2022 high) is resuming. Next target is 0.8201 (2022 low), but strong support should be seen there to bring rebound. Outlook will remain bearish as long as 0.8624 resistance holds even in case of strong rebound.
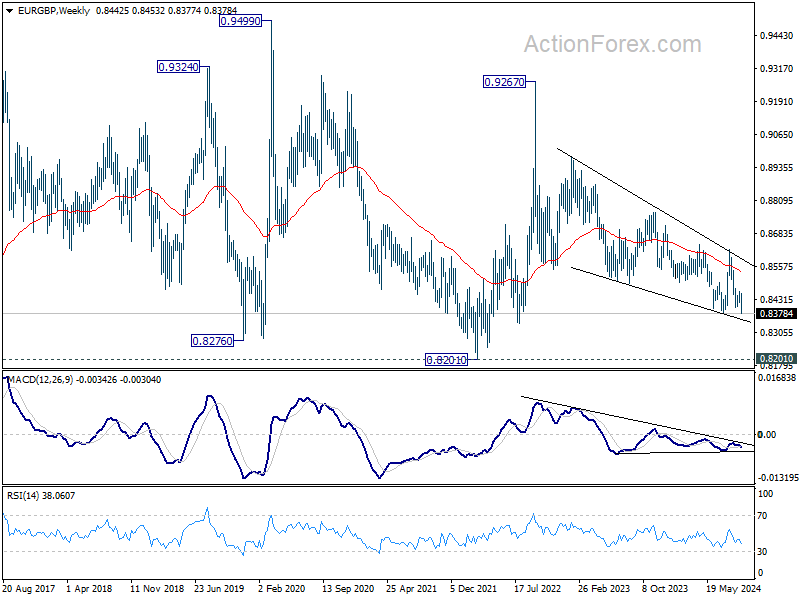
In the long term picture, price action from 0.9499 (2020 high) is seen as part of the long term range pattern from 0.9799 (2008 high). Range trading should continue between 0.8201 and 0.9499, until there is clear signal of imminent breakout.
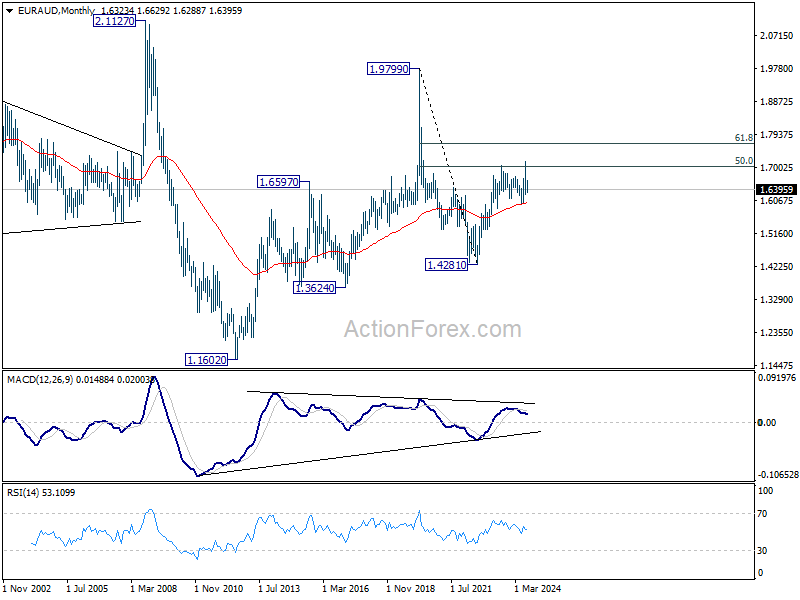
EUR/AUD Weekly Outlook
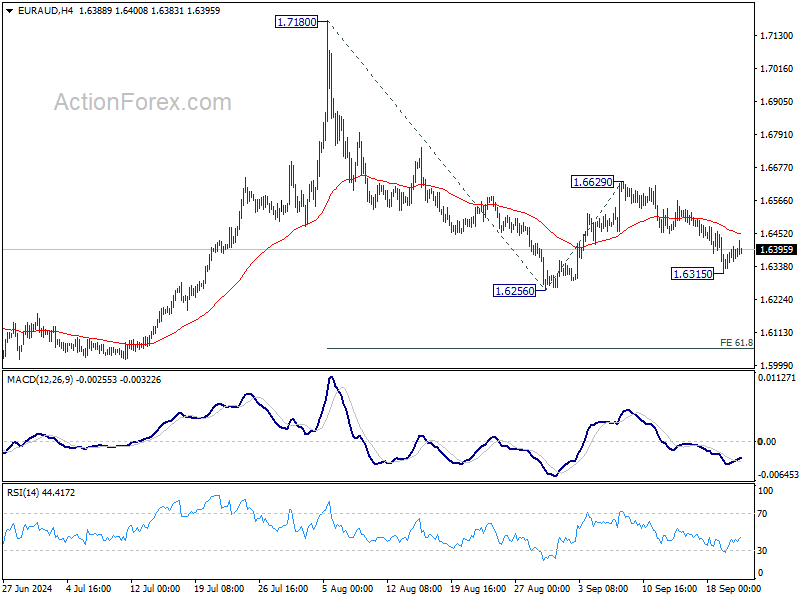
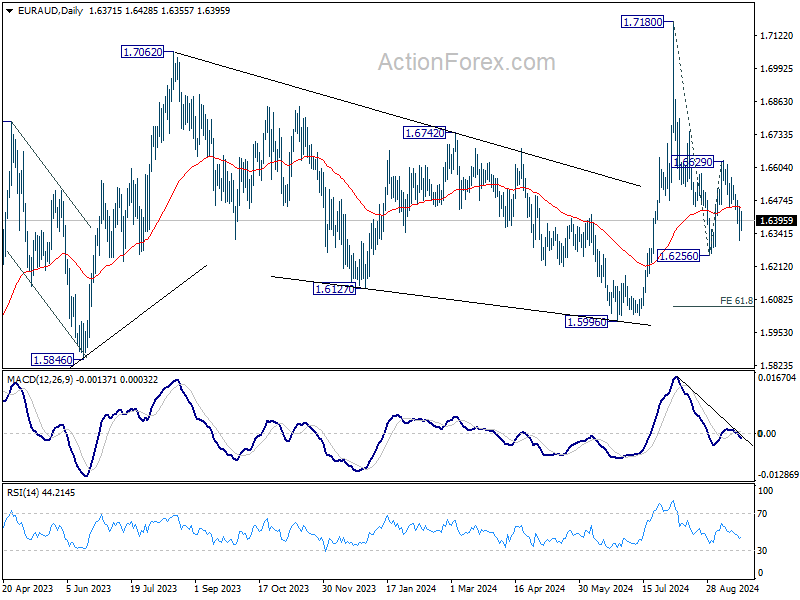
EUR/AUD's extended decline last week suggests that rebound from 1.6256 has completed at 1.6629 already. Nevertheless, as a temporary low was formed at 1.6315, initial bias is neutral this week first. Risk will stay on the downside as long as 1.6629 resistance holds. Below 1.6315 will bring retest of 1.6256. Firm break there will resume whole decline from 1.7180 and target 61.8% projection of 1.7180 to 1.6256 from 1.6629 at 1.6058.
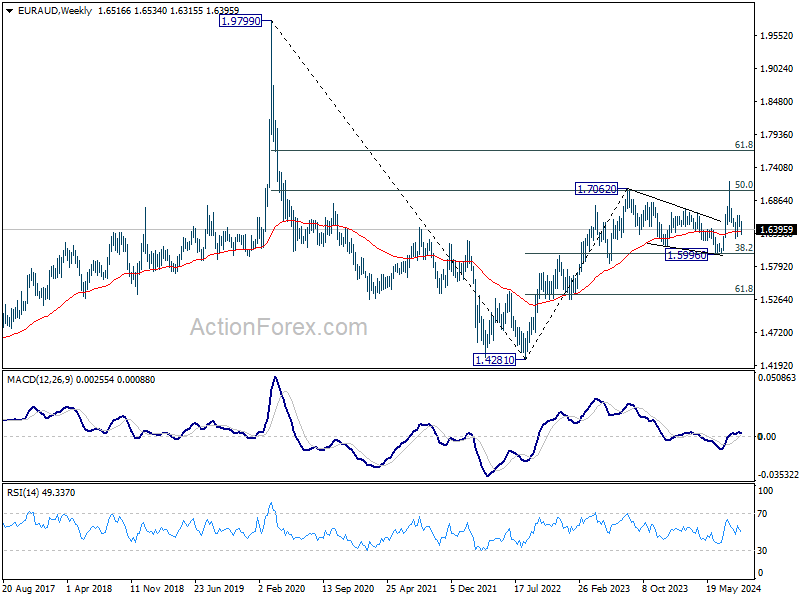
In the bigger picture, outlook is mixed up by the deeper than expected fall from 1.7180. Yet as long as 1.5996 support holds, up trend from 1.4281 (2022 low) is still in favor to resume at a later stage. Firm break of 1.7180 will pave the way to 61.8% projection of 1.4281 to 1.7062 from 1.5996 at 1.7715.
In the longer term picture, price actions from 1.9799 (2020 high) are seen as a long term decline at the same scale as the rise from 1.1602 (2012 low). Rebound from 1.4281 is seen as the second leg. As long as 55 M EMA (now at 1.5999) holds, this second leg could still extend higher. However, sustained trading below 55 M EMA will open up the bearish case for extending the decline through 1.4281 low.
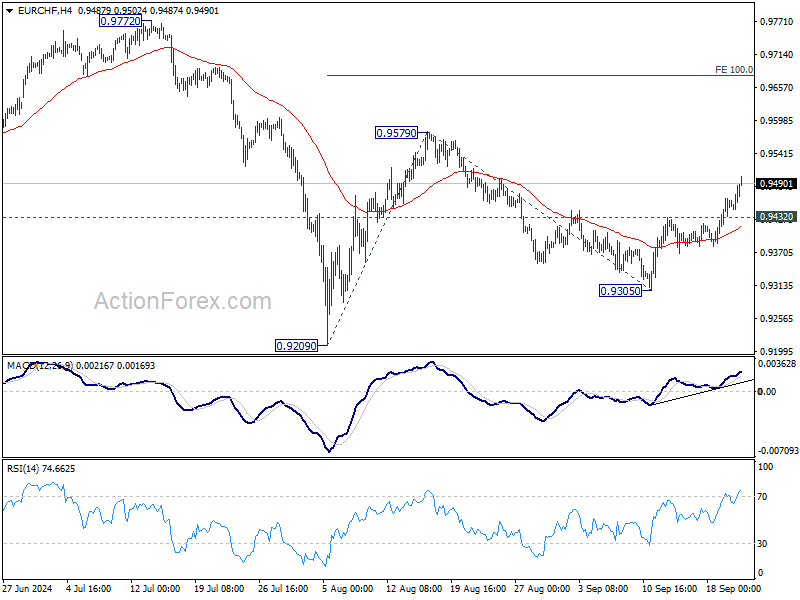
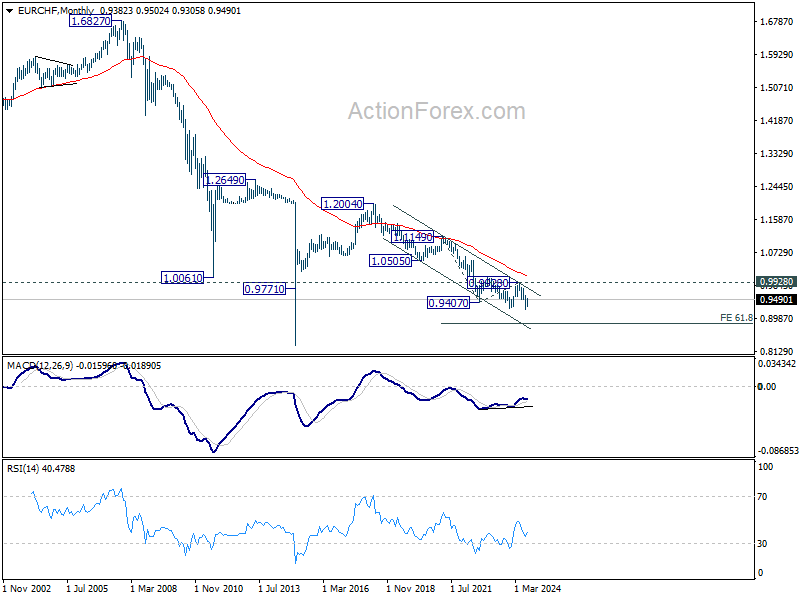
EUR/CHF Weekly Outlook
EUR/CHF's strong rebound last week suggest that pull back from 0.9579 has completed at 0.9305. Rise from there is now seen as the third leg of the pattern from 0.9209. Initial bias stays on the upside for 0.9579 resistance first. Firm break there will target 100% projection of 0.9209 to 0.9579 from 0.9305 at 0.9675. On the downside, below 0.9432 minor support will turn intraday bias neutral first.
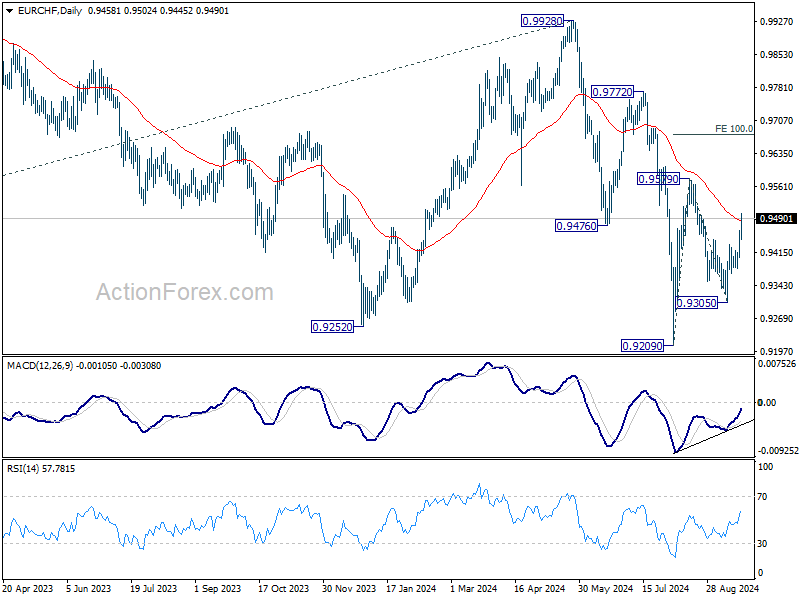
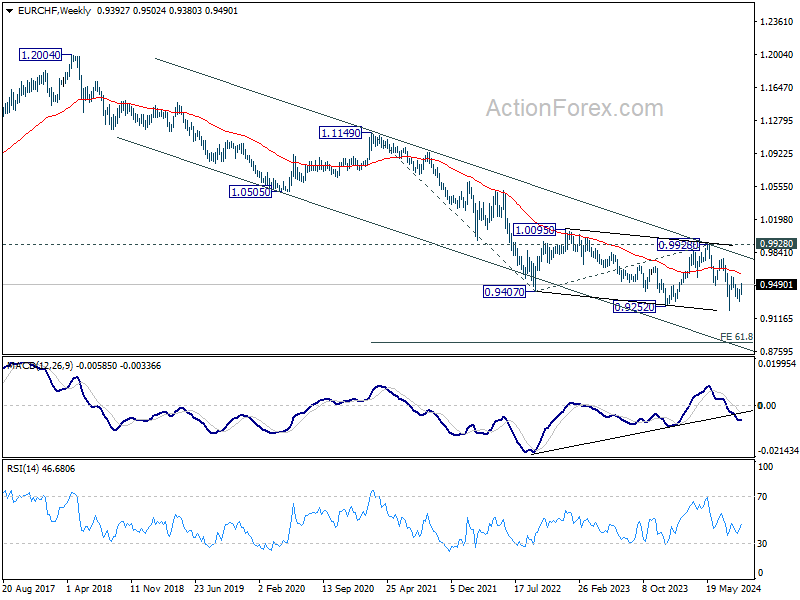
In the bigger picture, medium term corrective pattern from 0.9407 (2022 low) might have completed with three waves to 0.9928. Decisive break of 0.9252 (2023 low) will confirm long term down trend resumption. Next target will be 61.8% projection of 1.1149 to 0.9407 from 0.9928 at 0.8851. For now, outlook will stay bearish as long as 0.9928 resistance holds, even in case of strong rebound.
In the long term picture, fall from 1.2004 (2018 high) is part of the multi-decade down trend. Firm break of 0.9928 resistance is needed to be the first sign of long term bottoming. Otherwise, outlook will remain bearish.
Summary 9/23 – 9/27
Monday, Sep 23, 2024
| GMT | Ccy | Events | Consensus | Previous |
|---|---|---|---|---|
| 22:45 | NZD | Trade Balance (NZD) Aug | -155M | -963M |
| 23:00 | AUD | Manufacturing PMI Sep P | 48.5 | |
| 23:00 | AUD | Services PMI Sep P | 52.5 | |
| 07:15 | EUR | France Manufacturing PMI Sep P | 44.3 | 43.9 |
| 07:15 | EUR | France Services PMI Sep P | 53 | 55 |
| 07:30 | EUR | Germany Manufacturing PMI Sep P | 42.4 | 42.4 |
| 07:30 | EUR | Germany Services PMI Sep P | 51.1 | 51.2 |
| 08:00 | EUR | Eurozone Manufacturing PMI Sep P | 45.7 | 45.8 |
| 08:00 | EUR | Eurozone Services PMI Sep P | 52.3 | 52.9 |
| 08:30 | GBP | Manufacturing PMI Sep P | 52.3 | 52.5 |
| 08:30 | GBP | Services PMI Sep P | 53.5 | 53.7 |
| 12:30 | CAD | New Housing Price Index M/M Aug | 0.10% | 0.20% |
| 13:45 | USD | Manufacturing PMI Sep P | 48.6 | 47.9 |
| 13:45 | USD | Services PMI Sep P | 55.3 | 55.7 |
| GMT | Ccy | Events | |
|---|---|---|---|
| 22:45 | NZD | Trade Balance (NZD) Aug | |
| Forecast: -155M | Previous: -963M | ||
| 23:00 | AUD | Manufacturing PMI Sep P | |
| Forecast: | Previous: 48.5 | ||
| 23:00 | AUD | Services PMI Sep P | |
| Forecast: | Previous: 52.5 | ||
| 07:15 | EUR | France Manufacturing PMI Sep P | |
| Forecast: 44.3 | Previous: 43.9 | ||
| 07:15 | EUR | France Services PMI Sep P | |
| Forecast: 53 | Previous: 55 | ||
| 07:30 | EUR | Germany Manufacturing PMI Sep P | |
| Forecast: 42.4 | Previous: 42.4 | ||
| 07:30 | EUR | Germany Services PMI Sep P | |
| Forecast: 51.1 | Previous: 51.2 | ||
| 08:00 | EUR | Eurozone Manufacturing PMI Sep P | |
| Forecast: 45.7 | Previous: 45.8 | ||
| 08:00 | EUR | Eurozone Services PMI Sep P | |
| Forecast: 52.3 | Previous: 52.9 | ||
| 08:30 | GBP | Manufacturing PMI Sep P | |
| Forecast: 52.3 | Previous: 52.5 | ||
| 08:30 | GBP | Services PMI Sep P | |
| Forecast: 53.5 | Previous: 53.7 | ||
| 12:30 | CAD | New Housing Price Index M/M Aug | |
| Forecast: 0.10% | Previous: 0.20% | ||
| 13:45 | USD | Manufacturing PMI Sep P | |
| Forecast: 48.6 | Previous: 47.9 | ||
| 13:45 | USD | Services PMI Sep P | |
| Forecast: 55.3 | Previous: 55.7 | ||
Tuesday, Sep 24, 2024
| GMT | Ccy | Events | Consensus | Previous |
|---|---|---|---|---|
| 00:30 | JPY | Manufacturing PMI Sep P | 49.9 | 49.8 |
| 00:30 | JPY | Services PMI Sep P | 53.7 | |
| 04:30 | AUD | RBA Interest Rate Decision | 4.35% | 4.35% |
| 05:30 | AUD | RBA Press Conference | ||
| 08:00 | EUR | Germany IFO Business Climate Sep | 86.1 | 86.6 |
| 08:00 | EUR | Germany IFO Current Assessment Sep | 86 | 86.5 |
| 08:00 | EUR | Germany IFO Expectations Sep | 86.3 | 86.8 |
| 13:00 | USD | S&P/CS Composite-20 HPI Y/Y Jul | 5.90% | 6.50% |
| 13:00 | USD | Housing Price Index M/M Jul | 0.20% | -0.10% |
| 14:00 | USD | Consumer Confidence Sep | 103.5 | 103.3 |
| 23:50 | JPY | Corporate Service Price Index Y/Y Aug | 2.70% | 2.80% |
| GMT | Ccy | Events | |
|---|---|---|---|
| 00:30 | JPY | Manufacturing PMI Sep P | |
| Forecast: 49.9 | Previous: 49.8 | ||
| 00:30 | JPY | Services PMI Sep P | |
| Forecast: | Previous: 53.7 | ||
| 04:30 | AUD | RBA Interest Rate Decision | |
| Forecast: 4.35% | Previous: 4.35% | ||
| 05:30 | AUD | RBA Press Conference | |
| Forecast: | Previous: | ||
| 08:00 | EUR | Germany IFO Business Climate Sep | |
| Forecast: 86.1 | Previous: 86.6 | ||
| 08:00 | EUR | Germany IFO Current Assessment Sep | |
| Forecast: 86 | Previous: 86.5 | ||
| 08:00 | EUR | Germany IFO Expectations Sep | |
| Forecast: 86.3 | Previous: 86.8 | ||
| 13:00 | USD | S&P/CS Composite-20 HPI Y/Y Jul | |
| Forecast: 5.90% | Previous: 6.50% | ||
| 13:00 | USD | Housing Price Index M/M Jul | |
| Forecast: 0.20% | Previous: -0.10% | ||
| 14:00 | USD | Consumer Confidence Sep | |
| Forecast: 103.5 | Previous: 103.3 | ||
| 23:50 | JPY | Corporate Service Price Index Y/Y Aug | |
| Forecast: 2.70% | Previous: 2.80% | ||
Wednesday, Sep 25 2024
| GMT | Ccy | Events | Consensus | Previous |
|---|---|---|---|---|
| 01:30 | AUD | Monthly CPI Y/Y Aug | 2.80% | 3.50% |
| 08:00 | CHF | UBS Economic Expectations Sep | -3.4 | |
| 14:00 | USD | New Home Sales Aug | 693K | 739K |
| 14:30 | USD | Crude Oil Inventories | -1.6M | |
| 23:50 | JPY | BoJ Minutes |
| GMT | Ccy | Events | |
|---|---|---|---|
| 01:30 | AUD | Monthly CPI Y/Y Aug | |
| Forecast: 2.80% | Previous: 3.50% | ||
| 08:00 | CHF | UBS Economic Expectations Sep | |
| Forecast: | Previous: -3.4 | ||
| 14:00 | USD | New Home Sales Aug | |
| Forecast: 693K | Previous: 739K | ||
| 14:30 | USD | Crude Oil Inventories | |
| Forecast: | Previous: -1.6M | ||
| 23:50 | JPY | BoJ Minutes | |
| Forecast: | Previous: | ||
Thursday, Sep 26, 2024
| GMT | Ccy | Events | Consensus | Previous |
|---|---|---|---|---|
| 06:00 | EUR | Germany GfK Consumer Sentiment Oct | -21 | -22 |
| 07:30 | CHF | SNB Interest Rate Decision | 1.00% | 1.25% |
| 08:00 | CHF | SNB Press Conference | ||
| 08:00 | EUR | ECB Economic Bulletin | ||
| 08:00 | EUR | Eurozone M3 Money Supply Y/Y Aug | 2.50% | 2.30% |
| 12:30 | USD | Initial Jobless Claims (Sep 20) | 226K | 219K |
| 12:30 | USD | GDP Annualized Q2 F | 3% | 3% |
| 12:30 | USD | GDP Price Index Q2 F | 2.50% | |
| 12:30 | USD | Durable Goods Orders Aug | -2.80% | 9.80% |
| 12:30 | USD | Durable Goods Orders ex Transport Aug | 0.00% | -0.20% |
| 14:00 | USD | Pending Home Sales M/M Aug | 0.50% | -5.50% |
| 14:30 | USD | Natural Gas Storage | 58B | |
| 23:30 | JPY | Tokyo CPI Y/Y Sep | 2.60% | |
| 23:30 | JPY | Tokyo CPI Core Y/Y Sep | 2.00% | 2.40% |
| 23:30 | JPY | Tokyo CPI Core-Core Y/Y Sep | 1.60% |
| GMT | Ccy | Events | |
|---|---|---|---|
| 06:00 | EUR | Germany GfK Consumer Sentiment Oct | |
| Forecast: -21 | Previous: -22 | ||
| 07:30 | CHF | SNB Interest Rate Decision | |
| Forecast: 1.00% | Previous: 1.25% | ||
| 08:00 | CHF | SNB Press Conference | |
| Forecast: | Previous: | ||
| 08:00 | EUR | ECB Economic Bulletin | |
| Forecast: | Previous: | ||
| 08:00 | EUR | Eurozone M3 Money Supply Y/Y Aug | |
| Forecast: 2.50% | Previous: 2.30% | ||
| 12:30 | USD | Initial Jobless Claims (Sep 20) | |
| Forecast: 226K | Previous: 219K | ||
| 12:30 | USD | GDP Annualized Q2 F | |
| Forecast: 3% | Previous: 3% | ||
| 12:30 | USD | GDP Price Index Q2 F | |
| Forecast: | Previous: 2.50% | ||
| 12:30 | USD | Durable Goods Orders Aug | |
| Forecast: -2.80% | Previous: 9.80% | ||
| 12:30 | USD | Durable Goods Orders ex Transport Aug | |
| Forecast: 0.00% | Previous: -0.20% | ||
| 14:00 | USD | Pending Home Sales M/M Aug | |
| Forecast: 0.50% | Previous: -5.50% | ||
| 14:30 | USD | Natural Gas Storage | |
| Forecast: | Previous: 58B | ||
| 23:30 | JPY | Tokyo CPI Y/Y Sep | |
| Forecast: | Previous: 2.60% | ||
| 23:30 | JPY | Tokyo CPI Core Y/Y Sep | |
| Forecast: 2.00% | Previous: 2.40% | ||
| 23:30 | JPY | Tokyo CPI Core-Core Y/Y Sep | |
| Forecast: | Previous: 1.60% | ||
Friday, Sep 27, 2024
| GMT | Ccy | Events | Consensus | Previous |
|---|---|---|---|---|
| 06:45 | EUR | France Consumer Spending M/M Aug | -0.10% | 0.30% |
| 07:55 | EUR | Germany Unemployment Rate Sep | 6% | 6% |
| 07:55 | EUR | Germany Unemployment Change Sep | 9K | 2K |
| 09:00 | EUR | Eurozone Economic Sentiment Sep | 96.5 | 96.6 |
| 09:00 | EUR | Eurozone Industrial Confidence Sep | -9.8 | -9.7 |
| 09:00 | EUR | Eurozone Services Sentiment Sep | 6.3 | |
| 09:00 | EUR | Eurozone Consumer Confidence Sep F | -12.9 | -12.9 |
| 12:30 | CAD | GDP M/M Jul | 0.10% | 0.00% |
| 12:30 | USD | Personal Income M/M Aug | 0.40% | 0.30% |
| 12:30 | USD | Personal Spending Aug | 0.30% | 0.50% |
| 12:30 | USD | PCE Price Index M/M Aug | 0.20% | 0.20% |
| 12:30 | USD | PCE Price Index Y/Y Aug | 2.50% | |
| 12:30 | USD | Core PCE Price Index M/M Aug | 0.20% | 0.20% |
| 12:30 | USD | Core PCE Price Index Y/Y Aug | 2.60% | |
| 12:30 | USD | Goods Trade Balance Aug P | $-103.1B | |
| 12:30 | USD | Wholesale Inventories Aug P | 0.20% | 0.20% |
| 14:00 | USD | Michigan Consumer Sentiment Index Sep F | 69 | 69 |
| GMT | Ccy | Events | |
|---|---|---|---|
| 06:45 | EUR | France Consumer Spending M/M Aug | |
| Forecast: -0.10% | Previous: 0.30% | ||
| 07:55 | EUR | Germany Unemployment Rate Sep | |
| Forecast: 6% | Previous: 6% | ||
| 07:55 | EUR | Germany Unemployment Change Sep | |
| Forecast: 9K | Previous: 2K | ||
| 09:00 | EUR | Eurozone Economic Sentiment Sep | |
| Forecast: 96.5 | Previous: 96.6 | ||
| 09:00 | EUR | Eurozone Industrial Confidence Sep | |
| Forecast: -9.8 | Previous: -9.7 | ||
| 09:00 | EUR | Eurozone Services Sentiment Sep | |
| Forecast: | Previous: 6.3 | ||
| 09:00 | EUR | Eurozone Consumer Confidence Sep F | |
| Forecast: -12.9 | Previous: -12.9 | ||
| 12:30 | CAD | GDP M/M Jul | |
| Forecast: 0.10% | Previous: 0.00% | ||
| 12:30 | USD | Personal Income M/M Aug | |
| Forecast: 0.40% | Previous: 0.30% | ||
| 12:30 | USD | Personal Spending Aug | |
| Forecast: 0.30% | Previous: 0.50% | ||
| 12:30 | USD | PCE Price Index M/M Aug | |
| Forecast: 0.20% | Previous: 0.20% | ||
| 12:30 | USD | PCE Price Index Y/Y Aug | |
| Forecast: | Previous: 2.50% | ||
| 12:30 | USD | Core PCE Price Index M/M Aug | |
| Forecast: 0.20% | Previous: 0.20% | ||
| 12:30 | USD | Core PCE Price Index Y/Y Aug | |
| Forecast: | Previous: 2.60% | ||
| 12:30 | USD | Goods Trade Balance Aug P | |
| Forecast: | Previous: $-103.1B | ||
| 12:30 | USD | Wholesale Inventories Aug P | |
| Forecast: 0.20% | Previous: 0.20% | ||
| 14:00 | USD | Michigan Consumer Sentiment Index Sep F | |
| Forecast: 69 | Previous: 69 | ||
Stocks’ Positive Reaction Might Continue Until the Second Fed Rate Cut
- The Fed announced its first rate cut with a relatively balanced rhetoric
- History points to a high probability of back-to-back moves
- Dollar/yen and Treasury yields tend to drop until the second rate cut
- Barring a major event, stocks’ positive performance could continue
The Fed commenced its monetary policy easing cycle in aggressive fashion by announcing an almost unanimous decision to cut rates by 50bps. The markets were surprised with the US dollar suffering the most. Both the accompanying policy statement and the press conference were relatively balanced as Chairman Powell tried very carefully to avoid scaring the market by talking down the US economy.
The Fed is probably on a preset course, despite Powell advertising the meeting-by-meeting approach shared by other central banks. The dot plot revealed two additional 25bps rate cuts penciled in by Fed members for 2024, slightly below market expectations for another 72bps of easing this year. What does history tell us about the timing and size of the second Fed cut?
Is it standard practice for the Fed to announce back-to-back rate cuts?
Continuing from a previous special report where six easing cycles were identified since 2000, table 1 below presents the details of the Fed’s first and second rate cuts. As made evident, Fed members decided to cut rates again at the next scheduled meeting in four of the six examined cycles, increasing the possibility for a November 7 rate move.
Interestingly, Fed decisions varied from a 100bps rate cut in 2020, during the outbreak of the Covid pandemic, to just 25bps moves in 2002, 2007 and 2019, when the US economy was not falling off a cliff. Also, the time between the first and the second Fed rate cuts fluctuated from just 13 days in 2020 to almost 8 months in 2002, as the Fed traditionally tries to act appropriately in order to meet its dual mandate.
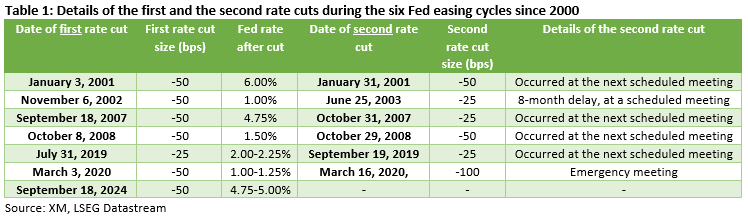
The next Fed meeting is scheduled for November 7, two days after the US presidential election day. Quite possibly, the result of the election might not be yet finalized, especially if the Republican presidential candidate is losing the battle. This raises the possibility of the Fed refraining from announcing another rate cut until the new president is declared. However, the market is convinced that the November rate cut is a done deal, and it is even assigning a sizeable 43% probability for another 50bps move.
How did the market perform between the first and second Fed rate cuts?
Chart 1 below presents the performance of key market assets in the period between the first and the second Fed rate cuts. Interestingly, dollar/yen dropped by an average of 1.5% in the last five easing cycles, a performance that could repeat this time around as the Bank of Japan is still open to further rate hikes in 2024.
Similarly, US treasury yields tend to fall in the examined time period, with one grave exception. In 2008, yields rose by 20bps as the US administration borrowed heavily from the bond market in order to fund its relief programmes.
Performance for certain assets depends on the underlying economic conditions
As seen in chart 1 below, the remaining assets exhibit a relatively mixed performance. However, digging through the results there is a common pattern emerging in pound/dollar, S&P 500 index, gold and WTI oil price. In periods of distress like 2008 and 2020, these four key assets tend to drop aggressively. For example, the S&P 500 index fell by 5.6% and 20.6% respectively in these two instances, and WTI oil prices collapsed.
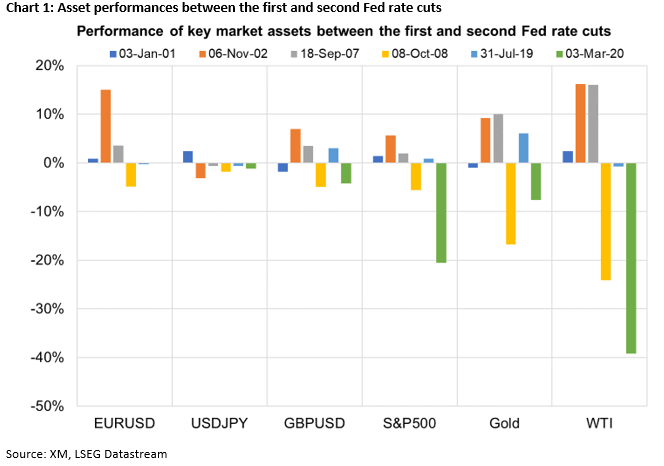
In periods of normal economic conditions, like the current situation, the Fed has traditionally opted for a more relaxed approach in terms of its rate cuts. As a result, in 2001, 2002, 2007 and 2019, pound/dollar, S&P 500 index, gold and WTI oil exhibited a stronger tendency to rally. More specifically, the S&P 500 index increased by an average of 2.4% in these four periods, while both gold and WTI oil showed a decent appetite for double-digit jumps.
Putting everything together, dollar/yen and the 10-year US treasury yield tend to decrease in the period between the first and the second Fed rate cuts. The performance of other key assets like pound/dollar, the S&P 500 index, gold and WTI oil depends on the underlying economic conditions. As such, in both 2008 and 2020 these assets dropped aggressively, while during the period between the first and the second Fed rate cuts in 2001, 2002, 2007 and 2019, they recorded strong gains.
The Weekly Bottom Line: Canada – Inflation Hits the Mark
U.S. Highlights
- The Federal Reserve started its easing cycle with a bang, reducing the policy rate by 50 basis points (bps), bringing the target range to 4.75%-5.0%.
- Futures markets are pricing an additional 75 bps of cuts by year-end, slightly more than the updated median FOMC forecast, which shows another 50 bps of cuts.
- Economic data out this week including retail sales, housing starts, and industrial production all came in stronger than expected. Our Q3 GDP tracking sits a 2.1%.
Canadian Highlights
- Headline inflation clocked in at the Bank of Canada’s (BoC’s) 2.0% year-on-year target in August. This marks a symbolic accomplishment for an economy that has been struggling to deal with high inflation for the last three years.
- Retail sales pointed to a strong summertime bounce back, while housing starts and house price growth continue to ebb in the face of still high interest rates.
- The stabilization in inflation has raised odds that the BoC follows the Fed with an outsized 50 basis point cut at either its October or December meeting.
U.S. – FOMC Starts Easing Cycle With a Bang
There was no doubt heading into this week that the Federal Reserve would be cutting its policy rate on Wednesday. What remained in question, was the size of the cut. Right up until the announcement, market pricing remained relatively split on whether the FOMC would cut by 25 or 50 basis points (bps). Ultimately, policymakers opted for the bigger cut and signaled more easing to come. The more dovish tilt pushed U.S. equity markets higher, with the S&P 500 up just over 1% for the week at the time of writing.
Accompanying the policy statement, the FOMC also released revised economic forecasts, known as the Summary of Economic Projections (SEP). The SEP is an aggregation of each Committee members’ individual forecasts but are not “official” Fed projections. Overall, the median forecast showed that the growth outlook remained little changed relative to the June forecast, with GDP still expected to expand by 2.0% per-year between 2024 and 2027. However, the unemployment rate was revised higher for both 2024 and 2025, and core PCE inflation was marked down in both years.
Consistent with the FOMC’s expectations for a slightly softer labor market, and cooler inflation, there were notable downward revisions to the median interest rate outlook (i.e., the “dot plot”) for 2024 through 2026. The revised forecast now shows a total of 100 bps of easing by the end of this year (previously 25 bps) with another 100 bps of cuts projected for 2025, corresponding to a target range of 3.25%-3.5% (Chart 1). This is 75 bps lower than the June SEP.
In the press conference, Chair Powell characterized the larger cut as a “strong start”, but also reiterated that future reductions in the policy rate were by no means on a preset course. Moreover, the Chair pushed back on the notion that this week’s outsized move was driven by a fear that the FOMC had fallen behind the curve. However, he did state that had the FOMC known back at the July 30-31 meeting that the labor market would have cooled as much as it did in the months that followed that rate decision, they probably would have started the easing cycle sooner.
As noted in our recent Quarterly Forecast, we feel that odds favor another 50-bps cut in November. If policymakers are truly concerned that today’s policy stance is too restrictive, it’s more likely that they will want to act quickly to alleviate the pressure, before slowing the pace in December.
This is not a guarantee. The Fed remains data dependent, and nearly all economic data out this week including retail sales, industrial production, housing starts, and initial jobless claims came in better than expected, and remain consistent with an economy that’s still expanding in the 2-2.5% range. Next week’s personal income and spending data will provide more insight on August spending trends and is also likely to show a bit more progress on easing inflationary pressures (Chart 2). But it’s the September and October employment reports that could ultimately be the deciding factor of whether the Fed cuts by 25 or 50 bps in November.
Canada – Inflation Hits the Mark
The U.S. Federal Reserve’s outsized 50 basis point (bp) cut may have dominated headlines, but it was still a busy week for Canadian economic data. Canadian Consumer Price Index (CPI) inflation made a big downward move, hitting the Bank of Canada’s (BoC’s) 2% target (Chart 1). We also got another reading on the housing market, which is still weighed down by high rates. Retail sales, however, sprung to life during the summer months. Progress on inflation and likely some hope the BoC will take its cue from the Fed has led financial markets pricing for the next BoC move to swing between another 25 bp cut in October or a larger 50 bp cut.
Headline inflation clocked in at 2.0% year-on-year (y/y) in August – bang on the central bank’s target. This marks a symbolic accomplishment for an economy that has been struggling to deal with high inflation for the last three years. Even more impressive was that this occurred while services inflation continues to run at a +4% y/y pace. Shelter inflation remains the culprit here, but when we strip out this impact, inflation has slowed to a tepid 0.5% y/y pace.
The continued deceleration in the BoC’s two preferred core inflation rates was also encouraging. Coming in at 2.3% y/y and 2.4% y/y in August (down from 2.4% y/y and 2.7% y/y in July), these rates are effectively at the BoC’s target. The underlying trends in core inflation make us believe that the easing in core rates should be sustained. Not only are the more recent trends in core inflation stabilizing around 2% (on a three-month annualized basis), but the share of goods and services with inflation running hot (the percent of CPI items growing +3%) has returned to historical norms. Couple this with a clear slowing in the real economy – rising unemployment – and we have all the ingredients for inflation to stabilize at current levels.
Speaking of weakness, the Canadian housing market remains stuck in neutral. This week we saw housing prices fall again in August as sales have yet to respond to recent BoC rate cuts. Builders have taken notice of this lackluster demand, resulting in housing starts plunging by double-digits in August. On a positive note, retail sales rebounded in the summer months, driven by a bounce-back in motor vehicle and parts dealers, following a series of cyberattacks that hit retailers in June. Even with this recovery, economic growth is still expected to run below its potential in the third quarter, despite the working age population increasing close to 4% on the quarter!
The BoC’s policy meeting deliberations released this week alongside a slew of speeches have signaled that the bank is done with seeing Canadian economic growth underperform its potential. While that intention is all well and good, our updated quarterly forecast points to continued weakness in the coming months. This will keep the central bank in cutting mode (Chart 2), and possibly at an even quicker pace than we have seen thus far. Market participants are already considering this possibility, with pricing nudging towards a 50 bps move at the bank’s upcoming announcement in October or December.
Weekly Economic & Financial Commentary: An Update to Our Fed Funds Forecast
Summary
United States: Recalibrating the Monetary Policy Stance
- The commencement of monetary policy easing comes at a time when overall economic growth remains solid, supported by stronger-than-expected retail sales, industrial production and residential construction in August. Yet, signs of labor market weakness have posed meaningful threats to the sustainability of growth, which underpinned the FOMC's decision to start the easing cycle with a 50 bps cut, rather than a conventional 25 bps move.
- Next week: New Home Sales (Wed.), Durable Goods (Thu.), Pers. Income & Spending (Fri.)
International: Central Bank Rate Divergences Are Apparent Again
- Central banks were in the spotlight this week. Not just the Federal Reserve, but foreign central banks as well. Institutions across the advanced and emerging markets met to discuss and decide monetary policy settings.
- Next week: Eurozone PMIs (Mon.), Reserve Bank of Australia (Tue.), Bank of Mexico (Thu.)
Interest Rate Watch: An Update to Our Fed Funds Forecast
- The Federal Open Market Committee (FOMC) opted to reduce the target range for the federal funds rate by 50 bps at its meeting this week. Based on what we know now, we believe the FOMC probably leans toward downshifting to a 25 bps pace going forward. Accordingly, we look for the FOMC to cut the federal funds rate by 25 bps at each of its two remaining meetings of the year.
Topic of the Week: Mexico Passes Sweeping Judicial Reforms
- In Mexico, a constitutional amendment that calls for an overhaul of the country’s judicial branch passed through local congress, leaving market participants wondering what the financial, economic and governance-related implications may be. We remain cautiously optimistic on the prospects for Mexican financial markets and the peso for now, though we will be closely watching any developments with ratings agencies' assessment of the country's debt.
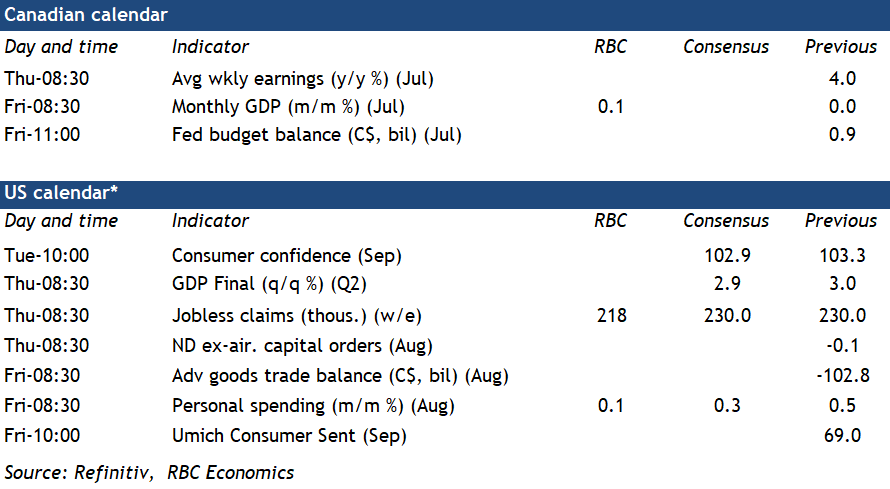
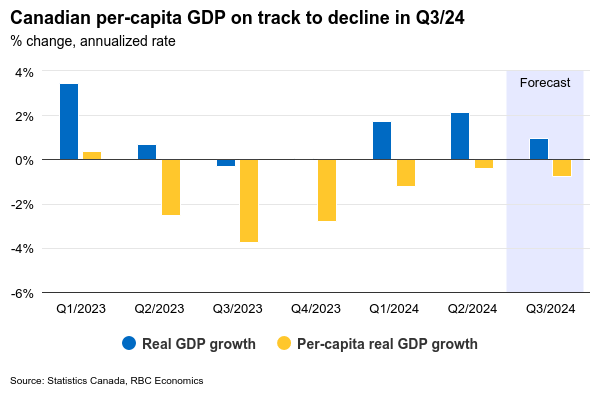
Canadian GDP to Show Modest Growth in July But Below BoC Forecast
Canada’s gross domestic product report for July next Friday will be closely watched to see if cooling in the economy in late Q2 extended into Q3.
Early reports are pointing to a 0.1% increase in July GDP that would be slightly higher than the advance estimate for an unchanged reading a month ago but would still extend a string of softer readings dating back to May. Most of a 2.1% annualized increase in Q2 GDP came from a 0.4% jump in output in April. Growth softened to 0.1% in May followed by no growth in June. The increase we expect in July is still historically soft and would leave output tracking another per-capita GDP decline in Q3—marking the eighth out of the last nine quarters.
We expect the small increase in July growth was evenly split across goods and services. The details of the July manufacturing sales report are consistent with a 0.6% increase in manufacturing GDP. But, a drop in oil sands production in Alberta and a pull-back in oil drilling activity is expected to weigh on growth. Meanwhile, wholesale and retail sales were both up in July, but our tracking of credit card transactions is pointing to little change in spending in the hospitality sector.
Slowing inflation has allowed the Bank of Canada to shift focus to concerns about a softening economy and a rising unemployment rate. Our forecast of around 1% annualized growth in Q3 GDP would be well below the BoC’s July forecast for a 2.8% increase. Our base case forecasts assume the BoC will continue cutting interest rates at a pace of 25 basis points per meeting, but with risks tilted to a faster pace of reductions (in line with the U.S. Federal Reserve’s larger 50 bps initial cut) if the economy softens significantly further.
Week ahead data watch
We expect U.S. personal consumption to edge up 0.1% in August, down from 0.5% in July. Retail sales growth slowed in August on softer auto sales and lower sales at gas stations. U.S. personal income likely increased by 0.4% in August from 0.3% in the previous month. It's consistent with higher wage growth from July to August.
Canadian July SEPH data will be watched closely for further signs of cooling in the labour market. The previously released Labour Force Survey showed a small 3,000 dip in employment in July, followed by a 22,000 bounce back in August. But job openings (captured in SEPH, not the LFS) likely continue to decline on slowing hiring demand. Wage growth in SEPH will also be in focus, because it has been underperforming the same measure in LFS.