Sample Category Title
ECB’s de Guindos keeps all option open data will drive future rate cuts
In an interview with Expresso, ECB Vice President Luis de Guindos reaffirmed the central bank's cautious approach regarding rate cuts in the upcoming meetings. He stressed that ECB remains "fully committed" to a data-dependent strategy, making decisions on a "meeting-by-meeting" basis.
While he acknowledged the possibility of cuts in both October and December, De Guindos highlighted that December would provide a clearer picture. "We will have more information and a new round of projections," he noted.
Nevertheless, he emphasized ECB plans to keep "all options open" to retain flexibility, with future moves hinging entirely on evolving economic data.
AUD/USD Reaches New Heights as Risk Sentiment Improves
The AUD/USD pair has climbed to a new peak, reaching 0.6815, marking the highest level since 28 December of the previous year. This strength in the Australian dollar is partly due to the aggressive rate cuts by the US Federal Reserve, which has spurred expectations that other central banks might also ease monetary policies, enhancing the economic outlook and fuelling a rally in riskier assets.
This week, Australian employment data significantly outperformed expectations, showing a 47.5k increase in jobs for August, far exceeding the forecasted 25.0k. This robust job growth has kept the unemployment rate steady at 4.2%. Despite this positive economic indicator, the main expectation is that the Reserve Bank of Australia (RBA) will maintain its interest rate at the current level in its upcoming meeting, with analysts predicting no changes to monetary policy until at least December and possibly not until Q2 of next year. The RBA’s cautious approach to inflation underscores its strategy of not taking decisive action until there is apparent necessity.
Given the current favourable risk environment, the AUD could reach even higher levels soon.
AUD/USD technical analysis
The AUD/USD market is advancing in the fifth wave of growth towards 0.6855. This target will likely be reached soon, followed by a corrective movement to 0.6790, testing it from above. This could define the upper boundary of a new consolidation range. Should the pair break below this range, a further decline to 0.6736 might ensue, potentially signalling the start of a new downward trend towards 0.6640, with a continuation to 0.6590. The MACD indicator, currently at its highs and directed upwards, supports this bullish scenario in the short term.
On the H1 chart, AUD/USD is forming a growth structure towards 0.6855. A short rise to 0.6848 is expected, followed by a slight decline to 0.6825. Upon completion of this minor correction, another growth phase towards 0.6855 is anticipated, which could exhaust the potential of the current growth wave. The Stochastic oscillator, with its signal line above 50 and pointing upwards, corroborates the likelihood of continued upward movement before any significant pullback.
USDCHF Stable at the Bottom of a Downtrend
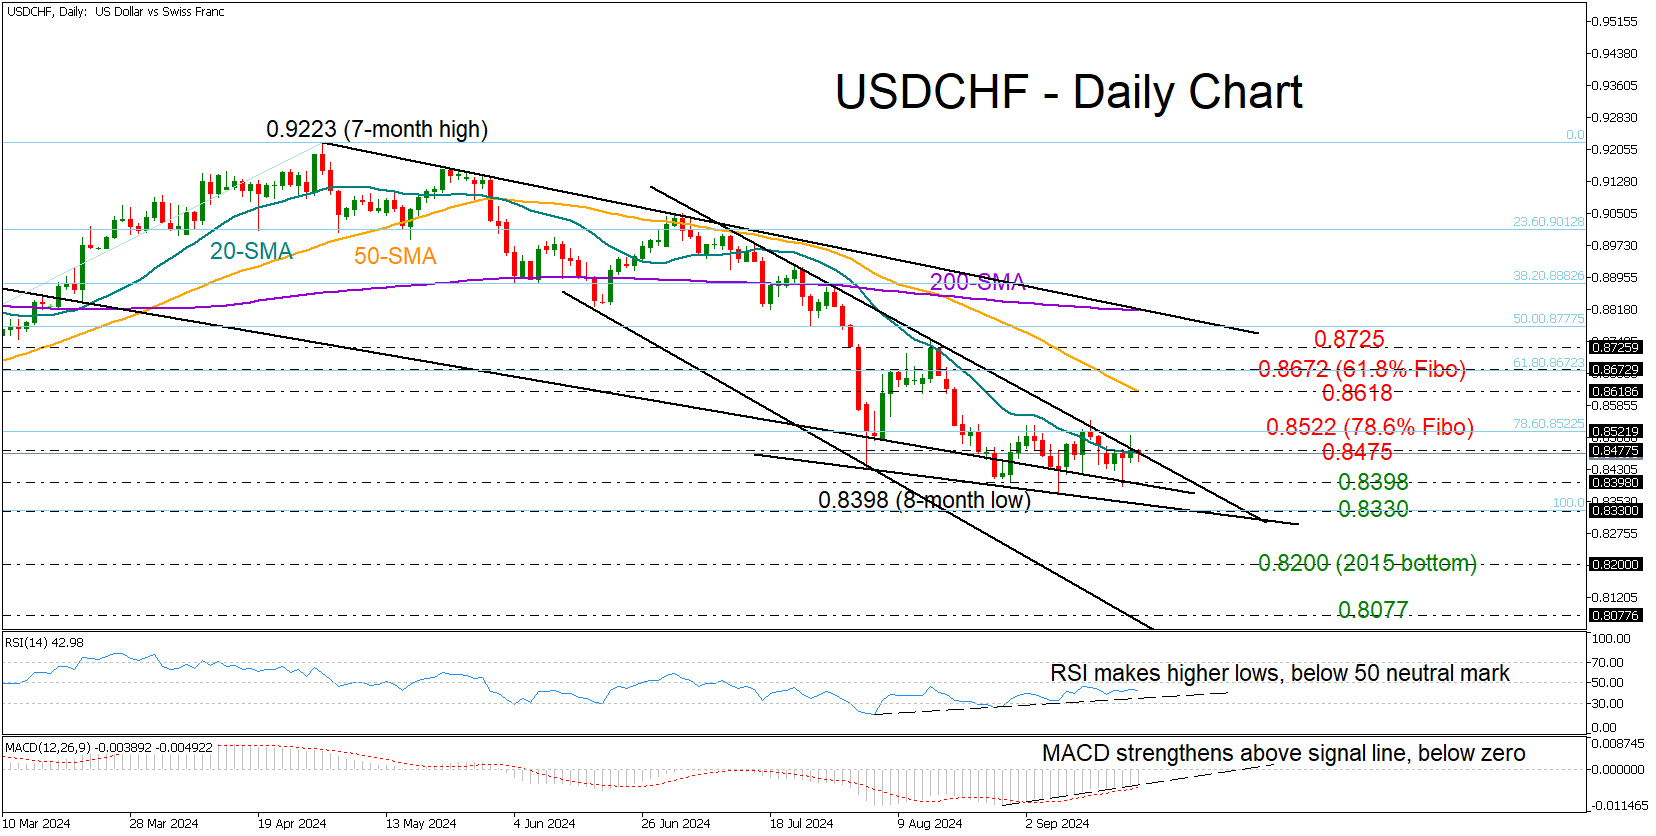
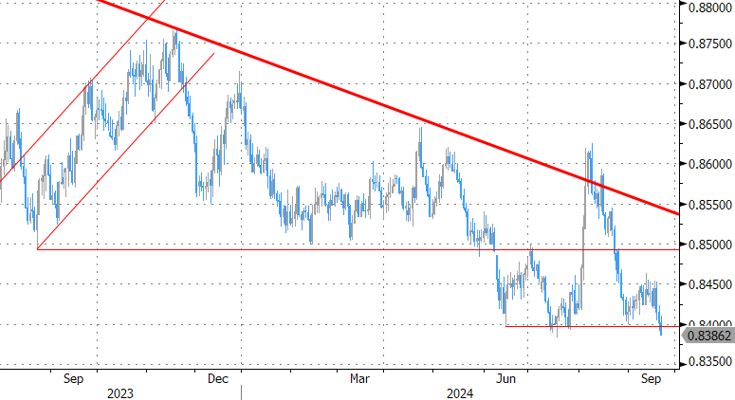
- USDCHF trades sideways near 8-month low, below 20-SMA
- Short-term outlook is hazy, but optimism is still there
- Key resistance at 0.8522; support at 0.8330
USDCHF has been in a tight range within the 0.8400 region so far this week, remaining trapped below its 20-day simple moving average (SMA) and the resistance trendline from July near 0.8470.
Despite the absence of strong bullish signals, the bullish divergence in the RSI and MACD remains a source of optimism for a positive reversal.
Nonetheless, buyers might adopt a wait-and-see approach until the price breaks above 0.8475 and moves out of its horizontal path above 0.8522. The latter overlaps with the 78.6% Fibonacci retracement of the December 2023-April 2024 upleg. Hence, a violation there could activate a new bullish wave towards the 50-day SMA at 0.8618. Further up, the pair may take a breather around the 61.8% Fibonacci mark of 0.8672 before stretching towards the 0.8725 bar.
A potential support level might form near the declining constraining line from October 2023 at 0.8398. The 9-year low of 0.8330 registered in December 2023 could be the next destination. Sellers must breach that base to access the critical 2015 floor of 0.8200. Even lower, the spotlight will turn to the bottom of the bearish channel seen near 0.8077.
In conclusion, USDCHF is expected to remain neutral in the short-term, unless it runs above 0.8522 or below 0.8330.
Market Analysis: GBP/USD Rallies While USD/CAD Struggles
GBP/USD started a fresh increase above the 1.3200 zone. USD/CAD declined and now consolidates below the 1.3600 level.
Important Takeaways for GBP/USD and USD/CAD Analysis Today
- The British Pound is eyeing more gains above the 1.3300 resistance.
- There is a key expanding triangle forming with support near 1.3200 on the hourly chart of GBP/USD at FXOpen.
- USD/CAD started a fresh decline after it failed to clear the 1.3650 resistance.
- There was a break below a short-term contracting triangle with support at 1.3560 on the hourly chart at FXOpen.
GBP/USD Technical Analysis
On the hourly chart of GBP/USD at FXOpen, the pair formed a base above the 1.3100 level. The British Pound started a steady increase above the 1.3200 resistance zone against the US Dollar, as discussed in the previous analysis.
The pair gained strength above the 1.3235 level. The bulls even pushed the pair above the 1.3300 level and the 50-hour simple moving average. The pair tested the 1.3315 zone and is currently consolidating gains.

There was a minor decline below the 1.3300 level. The pair tested the 23.6% Fib retracement level of the upward move from the 1.3153 swing low to the 1.3314 high.
The bulls are now active near the 1.3275 level. If there is another decline, the pair could find support near the 1.3235 level or the 50% Fib retracement level of the upward move from the 1.3153 swing low to the 1.3314 high.
The first major support sits near the 1.3200 zone. There is also a key expanding triangle forming with support near 1.3200. The next major support is 1.3150. If there is a break below 1.3150, the pair could extend the decline.
The next key support is near the 1.3115 level. Any more losses might call for a test of the 1.3075 support. Conversely, the bulls might aim for more gains. The RSI moved above the 60 level on the GBP/USD chart and the pair is now approaching a major hurdle at 1.3315.
An upside break above the 1.3315 zone could send the pair toward 1.3350. Any more gains might open the doors for a test of 1.3420.
USD/CAD Technical Analysis
On the hourly chart of USD/CAD at FXOpen, the pair climbed toward the 1.3620 resistance zone before the bears appeared. The US Dollar formed a swing high near 1.3650 and recently declined below the 1.3600 support against the Canadian Dollar.
There was also a close below the 50-hour simple moving average and 1.3580. Besides, there was a break below a short-term contracting triangle with support at 1.3560.
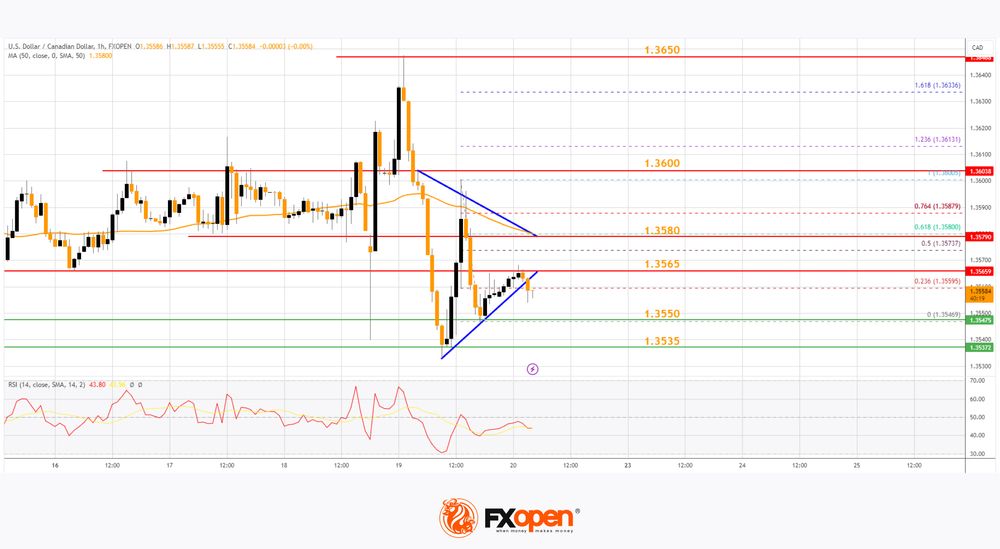
The bulls are now active near the 1.3550 level. Recently, the pair corrected some losses and climbed above the 23.6% Fib retracement level of the downward move from the 1.3600 swing high to the 1.3546 low.
If there is a fresh increase, the pair could face resistance near the 1.3565 level. The next key resistance on the USD/CAD chart is near the 61.8% Fib retracement level of the downward move from the 1.3600 swing high to the 1.3546 low is 1.3580.
If there is an upside break above 1.3580, the pair could rise toward the 1.3600 resistance. The next major resistance is near the 1.3650 level, above which it could rise steadily toward the 1.3700 resistance zone.
Immediate support is near the 1.3550 level. The first major support is near 1.3535. A close below the 1.3535 level might trigger a strong decline. In the stated case, USD/CAD might test 1.3500. Any more losses may possibly open the doors for a drop toward the 1.3450 support.
Trade over 50 forex markets 24 hours a day with FXOpen. Take advantage of low commissions, deep liquidity, and spreads from 0.0 pips. Open your FXOpen account now or learn more about trading forex with FXOpen.
This article represents the opinion of the Companies operating under the FXOpen brand only. It is not to be construed as an offer, solicitation, or recommendation with respect to products and services provided by the Companies operating under the FXOpen brand, nor is it to be considered financial advice.
US Curve Steepening and Outright Risk-on Context Kept Dollar in the Defensive
Markets
Wednesday’s bumper 50 bps Fed kick-off yesterday resulted in a further steeping of the US curve, with the short end still challenging recent lows. The intraday price dynamics was briefly interrupted by a better than expected Philly Fed business outlook and even more by a decline in the weekly jobless claims (219k from 231k). This supports Powell’s view that the Fed isn’t behind the curve and that it is supporting the economy/the labour market while it is still strong, helping to engineer a soft landing of the US economy. Even so, markets soon resumed their intraday pattern. US yields changed between -3.6 bps (2-y) and +3.0 bps (30-y). The US 2-y yield is only a whisker away from the March 2023 low (3.55% area). The rise in LT yields was mainly driven by a rebound in inflation expectations (10-y + 5.0 bps). The 10-y real yield declined 5.0 bps. This idea of a soft landing/mild reflation further propelled equities with the Dow and the S&P closing at new record levels. Reflationary hopes, amongst others, also supported a further rebound in the oil price (Brent $74.5 p/b). German yields traded in sympathy with the US (2-y -4.2 bps, 30-y +4.5 bps). US curve steepening and an outright risk-on context kept the dollar in the defensive, especially against the likes of the euro or currencies sensitive to the overall economic cycle (AUD, NZD…). EUR/USD closed at 1.1162, with the august top (1.1202) within reach. USD/JPY gained mostly (142.6 from 142.3) on yen underperformance. The eco calendar in the US and EMU is almost empty. We expect technical trading going into the weekend. The steepening trend might continue as markets can still raise the odds for follow-up 50 bps steps from the Fed in November and December. However, such a push needs more soft data, which we won’t get today. The dollar still remains at risk to fall below key support levels (EUR/USD 1.1202/1.1276, DYX 100.55/99.58).
This morning, UK data printed mixed. GfK consumer confidence unexpectedly tumbled from -13 to -20. Consumers turned more pessimistic both on their personal situation as on the global economic outlook. UK August retail sales printed at a much stronger than expected 1.0% M/M and 2.5% Y/Y. Yesterday, the BoE let its policy rate unchanged at 5.0% after an inaugural step in August as it wants to take a cautious approach as core/services inflation remains elevated. After the retail sales release, EUR/GBP is heading for a test of the YTD lows (0.8383 area).
News & Views
The Bank of Japan kept the policy rate unchanged at 0.25%. The status quo was widely expected after a previous hike rattled markets end July/beginning of August. Language at that time signalling further hikes if the July outlook would materialize, didn’t make it in the statement this morning. Still, the BoJ upgraded its assessment of private consumption from “being resilient” to “being on a moderate increasing trend” thanks to a virtuous cycle from income to spending. Along with improving exports and against a background of accommodative financial conditions that should help Japan’s economy grow at a pace above potential. Inflation, both headline and underlying, are seen evolving according to the July outlook. The gauges are still seen to be consistent with the 2% target somewhere in the second half of the projection period. Inflation figures printed as fresh as this morning and ahead of the policy meeting outcome showed prices rose at a quicker pace in August. Headline CPI rose from 2.8% to 3% while the core measure (ex. fresh food and energy) fastened from 1.9% to 2%. The BoJ’s preferred gauge (ex. fresh food) picked up from 2.7% to 2.8%. The market reaction was a dull one with some minor JPY appreciation to USD/JPY 142.33.
Chinese bank kept their benchmark lending rates unchanged at 3.35% (1-yr) and 3.85% (5-yr). They lowered last time in July after the Chinese central bank cut its 7-day reverse repo rate back in July by 10 bps to 1.7%. There have been no cuts since, but the PBOC last week in an unusually explicit statement said that they are “preparing to launch some additional measures, further lower the financing costs for businesses and households, and keep liquidity reasonably ample.” after another string of weak data and as the housing market meltdown continues. Regarding the latter, Bloomberg reports China is considering to remove some of the largest remaining restrictions (targeting non-local buyers) on home purchases in a new attempt to revive the market. A slew of earlier measures have failed to do so. The Chinese yuan is giving it the benefit of the doubt though we suspect some technical considerations push the currency higher too. USD/CNY dropped below 7.05 for the first time since May 2023.
Graphs
GE 10y yield
The ECB cut policy rates by 25 bps in June and in September. Stubborn inflation (core, services) make follow-up moves less evident. We expect the central bank to stick with the quarterly reduction pace. Disappointing US and unconvincing EMU activity data dragged the long end of the curve down. The move accelerated during the early August market meltdown.
US 10y yield
The Fed kicked off its easing cycle with a 50 bps move. It is headed towards a neutral stance now that inflation and employment risks are in balance. Conservative SEP unemployment forecasts risk being caught up by reality and with it the dot plot (50 bps more cuts in 2024). We hold our call for two more 50 bps cuts this year. Pressure on the front of the curve and weakening eco data keeps the long end in the defensive for now as well.
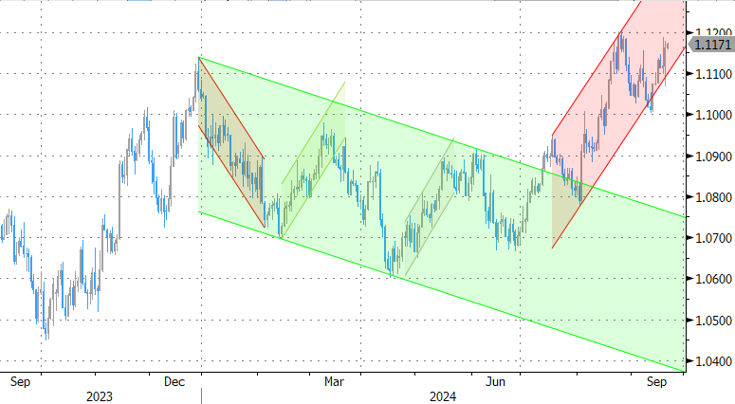
EUR/USD
EUR/USD moved above the 1.09 resistance area as the dollar lost interest rate support at stealth pace. US recession risks and bets on fast and large rate cuts trumped traditional safe haven flows into USD. EUR/USD 1.1276 (2023 top) serves as next technical references.
EUR/GBP
The BoE delivered a hawkish cut in August. Policy restrictiveness will be further unwound gradually on a pace determined by a broad range of data. The strategy similar to the ECB’s balances out EUR/GBP in a monetary perspective. Recent better UK activity data and a cautious assessment of BoE’s Bailey at Jackson Hole are pushing EUR/GBP lower in the 0.84/0.086 range.
UK retail sales grows 1% mom in Aug, annual growth highest since Feb 2022
UK retail sales volumes surged 1.0% mom in August, significantly outpacing the expected 0.3% mom growth. This marked the highest sales index level since July 2022. Over the broader three-month period ending in August, sales volumes increased by 1.2% compared to the previous three months.
On an annual basis, sales volumes jumped 2.5% yoy, marking the largest annual rise since February 2022. However, despite these strong gains, retail sales volumes remain -0.4% below their pre-pandemic levels from February 2020.
Hawkish Market Surprises from Norges Bank and Bank of England
In focus today
In the euro area September consumer confidence is due for release. Consumer confidence has been on an upward trend but remains below the historical average and consumer spending is weak. As real incomes are rising and the labour market remains strong, we expect confidence to keep improving, which should support consumption especially next year.
Economic and market news
What happened overnight
In Japan, the Bank of Japan (BoJ) kept its uncollateralized overnight call rate unchanged at 0.25% this morning. In its assessment of the economy, it sounds more upbeat on particularly private spending, which is key for the potential for further rate hikes. BoJ on hold was widely expected and the market reaction is muted.
We got fresh inflation data overnight as well, which showed price pressures picking up and core inflation increasing from 1.6 to 1.7% in August. Broadly, the BoJ will be satisfied with recent developments in the economy and financial markets. Particularly the recent tailwind to JPY makes hiking rates much less acute. With a leadership election within the ruling party (LDP) around the corner, potentially followed by a snap general election, we expect the BoJ will be most comfortable keeping policies unchanged in October as well. The window is open for another rate hike in December, which is our expectation, but much will depend on US data and the Fed cutting cycle. If US labour market cooling intensifies, a JPY rally could pull the breaks on further BoJ hikes.
What happened yesterday
In Norway, Norges Bank left policy rates unchanged including the sight deposit rate at 4.50%. While this was widely expected there were diverging views as to the forward guidance signals on the monetary policy outlook. In short, Norges Bank delivered a hawkish surprise compared with market expectations by pushing back against a rate cut this year. We leave unchanged our forecast for the sight deposit rate and still pencil in the first rate cut in March, and a total of four rate cuts in both 2025 and 2026.
In the UK, the Bank of England (BoE) left the Bank Rate unchanged at 5.00% as widely expected. The bank delivered a hawkish twist to its guidance emphasising their gradual approach to reducing the restrictiveness of monetary policy. We expect the BoE to deliver the next 25bp cut in November and this to be the final cut this year, making it less than markets expect (42bp by YE 2024). 2Y Gilt yields moved higher on the statement but overall, the reaction in rates markets was muted. EUR/GBP moved lower on the announcement following the slightly hawkish vote split and notion of a gradual cutting cycle. See Bank of England Review - Gradual easing cycle supports GBP, 19 September.
In the euro area, ECB comments were split with both dovish and hawkish tones. Schnabel repeated the view of sticky services inflation, while Centeno said that 'we have really to minimize the risk of undershooting, because that's the main risk'. Panetta said that ECB may accelerate rate cuts in the coming months.
In Turkey, the Central Bank of Turkey left the policy rate unchanged as expected and dropped a reference to potential further policy tightening. However, we think the policy rate will be kept at the current level at least for the remainder of this year, and the cutting cycle to kick off only in Q1 next year.
Equities: Global equities were higher yesterday, buoyed by the optimism resulting from the Federal Reserve's 50 basis point cut on Wednesday. Despite the overall market surge, it was a very cyclical-led market, with utilities and consumer staples even closing lower despite the increased risk appetite. Additionally, minimum volatility stocks underperformed while small caps fared well. Much of the equity market's outlook hinges on the US labour market, making the 219K initial jobless claims print a timely boost for risk appetite. In the US yesterday, the indices closed as follows: Dow +1.3%, S&P 500 +1.7%, Nasdaq +2.5%, Russell 2000 +2.1%. This morning, Asian markets are mostly higher, with Japan leading the gains despite a stronger yen following the Bank of Japan's decision to leave policy unchanged. European and US futures are lower this morning.
FI: Following Wednesday's FOMC meeting decision, European yields pivoted around the 10y point yesterday. The 10y point was virtually unchanged across European jurisdictions with the long end sell-off of about 4bp and the short end rallying about the same, thus leading to a noteworthy steepening across the curves. The 2s10s German bond yield curve is just 2bp inverted now. ECB is priced at 38bp of rate cuts and 117bp currently, which is 2bp more than Wednesday's close.
FX: The USD broadly weakened against G10 in yesterday's session, pushing EUR/USD above 1.1150. USD/JPY declined slightly this morning following the BoJ's expected hold, accompanied by a hawkish statement. A hawkish hold from Norges Bank combined with generally positive risk sentiment led the NOK to outperform among G10 currencies yesterday, with EUR/NOK just above 11.70. The Fed's 50bp cut has fuelled some repricing of expectations for the Riksbank next week. EUR/GBP broke below the 0.84 mark during yesterday's session following a hawkish twist delivered by the Bank of England. Oil prices have recovered to near USD 75/bbl this week.
Cliff Notes: 50 Proves the Magic Number
Key insights from the week that was.
The main update for Australia this week was August’s Labour Force Survey. The result again emphasised the strength of labour demand, with employment growing by 47,000, ahead of the 37,000 estimated increase in the labour force. The unemployment rate was unchanged in the month at 4.2%, but only just; at 2 decimal points it declined from 4.24% to 4.16%. The continued meeting of demand with supply points to a broadly balanced labour market and resilient economy, justifying an expectation that economic growth will accelerate in 2025 as inflation abates and the RBA is able to ease policy.
Experiences across the economy are varied, however, as evinced by the latest ACCI-Westpac Survey of Industrial Trends. Australian manufacturers – whom have largely been at the coalface of the discretionary spending slowdown – previously reported difficulties in sourcing skilled labour and now declines in employment, utilising remaining staff at a higher rate when necessary. That stands in contrast to industries providing essential services – such as healthcare and social assistance – which continue to experience persistent growth and thus an ongoing need to increase headcount. Detailed industry-level labour market data, available next week, will provide a better understanding that these underlying imbalances and the risks they pose.
For domestic manufacturing, there were some constructive developments in the latest survey. Businesses have been able to find some pockets of demand over the last six months, seeing new orders increase and output growth remain positive. With demand conditions likely to improve over the year ahead as headwinds abate, manufacturers are eager to invest in buildings, plant and equipment, with a greater degree of confidence than seen prior. The desire to expand capacity and improve the flexibility of their supply chains is understandable given volatile cost pressures and persistent difficulties in obtaining materials and labour.
Next week, we will receive a key partial update on inflation with the August Monthly CPI Indicator. Our preview is now available.
Offshore, markets were focused on the FOMC as it kicked off its long-awaited easing cycle. The BoE in contrast marked time ahead of revised forecasts in November.
At the conclusion of its September meeting, the FOMC decided to cut rates by 50bps to start this easing cycle, bringing the fed funds rate target range to 4.75-5.00%. Chair Powell’s remarks emphasised that the outsized move was a response to balancing risks and so as to not “get behind” with policy. The FOMC’s revised forecasts also made clear members remain constructive on the outlook, the labour market characterised as 'solid' and expected to remain that way, with the unemployment rate to peak only 0.2ppts above the current level at 4.4%. Annual GDP growth is also forecast to be 2.0% in 2024 through 2027, slightly above the Committee’s ‘longer run’ estimate of trend growth of 1.8%. As a result, the FOMC projects a slow normalisation after a rapid start, with another 50bps of cuts seen by end-2024 (noting two meetings remain in 2024), then a further 150bps through 2025 and 2026 to 2.9%, the FOMC’s current estimate of neutral.
We expect US growth to modestly disappoint the FOMC’s forecasts, but also see lingering risks for inflation. We therefore see the fed funds rate reaching a low of 3.375% for this cycle in late-2025, with that rate then held through 2026. Chief Economist Luci Ellis’ essay this week focuses not only on the next steps for central banks but also the determinants of neutral and the global rate structure into the medium term.
Across the Atlantic, as widely expected, the Bank of England kept rates steady in an 8-1 vote in September. Messaging from the Monetary Policy Summary was hawkish, emphasising a need to 'squeeze persistent inflationary pressure' and risks to the inflation outlook. The Monetary Policy Committee considered three cases; the first saw policy eased quickly as weaker headline inflation fed through to pay and price-setting, while the second saw economic slack discouraging price growth, and the third considered a structural change in the price-setting mechanism, necessitating tighter policy for longer. Central to all three was the uncertainty surrounding price and wage determination. Policy easing is therefore expected to be ‘gradual’ through the rest of 2024 and in 2025 and, all the while, to remain data dependent. On that front, earlier in the week, the August CPI rose 0.3% and 2.2% from a year ago. The annual figure is below the BoE's forecast of 2.4%. Annual services inflation remains stubborn and elevated however, at 5.6%.
Coming back close to home, New Zealand’s economy contracted 0.2%qtr in Q2, less than both our and the RBNZ's expectations. Activity was mixed across industries with over half recording declines. Support came from non-food manufacturing, up 4.0% in the quarter but this was more than offset by weakness in consumer-oriented industries like retail and hospitality. In spite of this, household spending rose 0.4%qtr, largely due to spending on essential items such as groceries. Exports were a drag, falling 4.4%qtr after a strong rise in Q1.
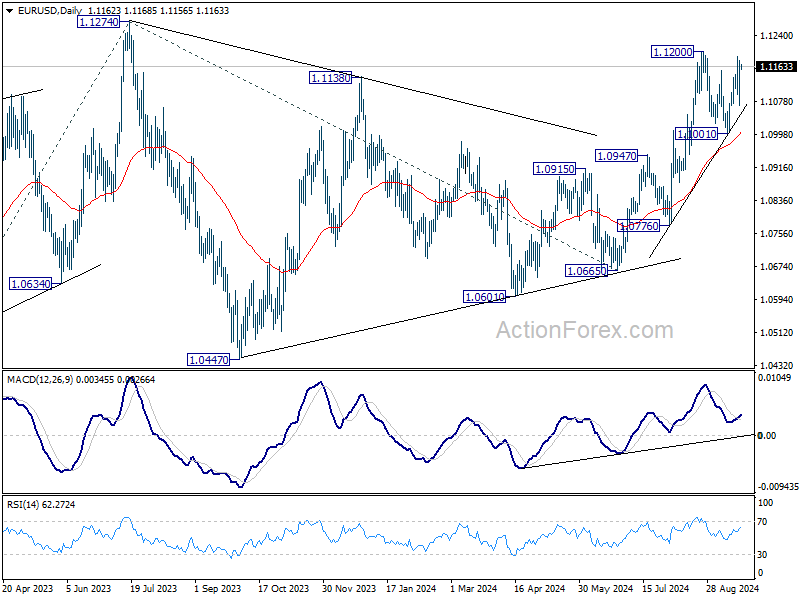
EUR/USD Daily Outlook
Daily Pivots: (S1) 1.1096; (P) 1.1137; (R1) 1.1204; More....
Intraday bias in EUR/USD remains mildly on the upside with focus on 1.1200 resistance. Decisive break there will resume larger the rally from 1.0665 to 1.1274 high. Firm break there will resume larger up trend. On the downside, however, break of 1.1072 will turn bias back to the downside for 1.1001 support instead.
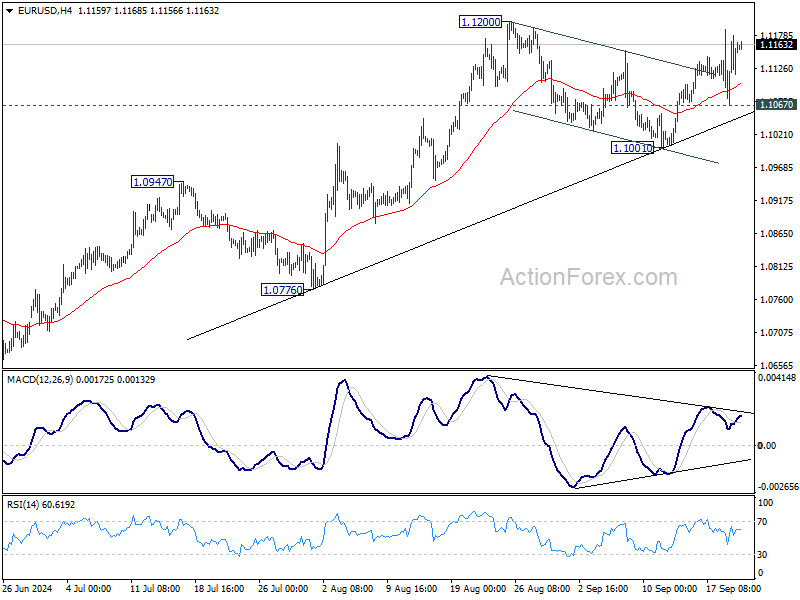
In the bigger picture, prior break of 1.1138 resistance indicates that corrective pattern from 1.1274 might have completed at 1.0665 already. Decisive break of 1.1274 (2023 high) will confirm resumption of whole up trend from 0.9534 (2022 low). Next target will be 61.8% projection of 0.9534 to 1.1274 from 1.0665 at 1.1740. This will now be the favored case as long as 1.0947 resistance turned support holds.
USD/JPY Daily Outlook
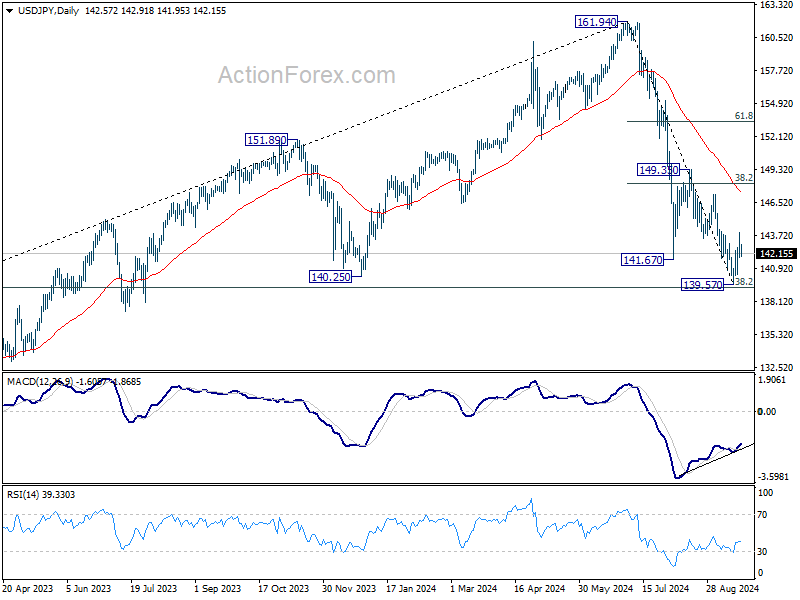
Daily Pivots: (S1) 141.70; (P) 142.82; (R1) 143.76; More...
Intraday bias in USD/JPY stays mildly on the upside for the moment. Rebound from 139.57 short term bottom should target 55 D EMA (now at 147.37), and possibly further to 38.2% retracement of 161.94 to 139.57 at 148.11. For now, risk will stay on the upside as long as 139.57 support holds, in case of retreat.
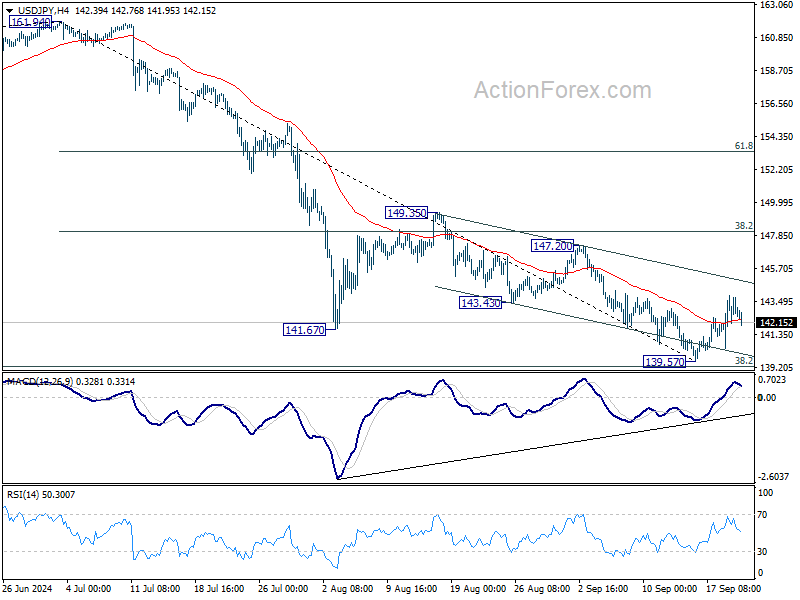
In the bigger picture, fall from 161.94 medium term top is seen as correcting whole up trend from 102.58 (2021 low). Strong support could be seen from 38.2% retracement of 102.58 to 161.94 at 139.26 to contain downside, at least on first attempt. But in any case, risk will stay on the downside as long as 149.35 resistance holds. Sustained break of 139.26 would open up deeper medium term decline to 61.8% retracement at 125.25.