
Sample Category Title
RBA Policy Meeting : It’s Not Time for a Rate Cut Yet
- RBA expected to deviate from the Fed and hold rates steady
- Inflation risks remain a concern; labor market is tight
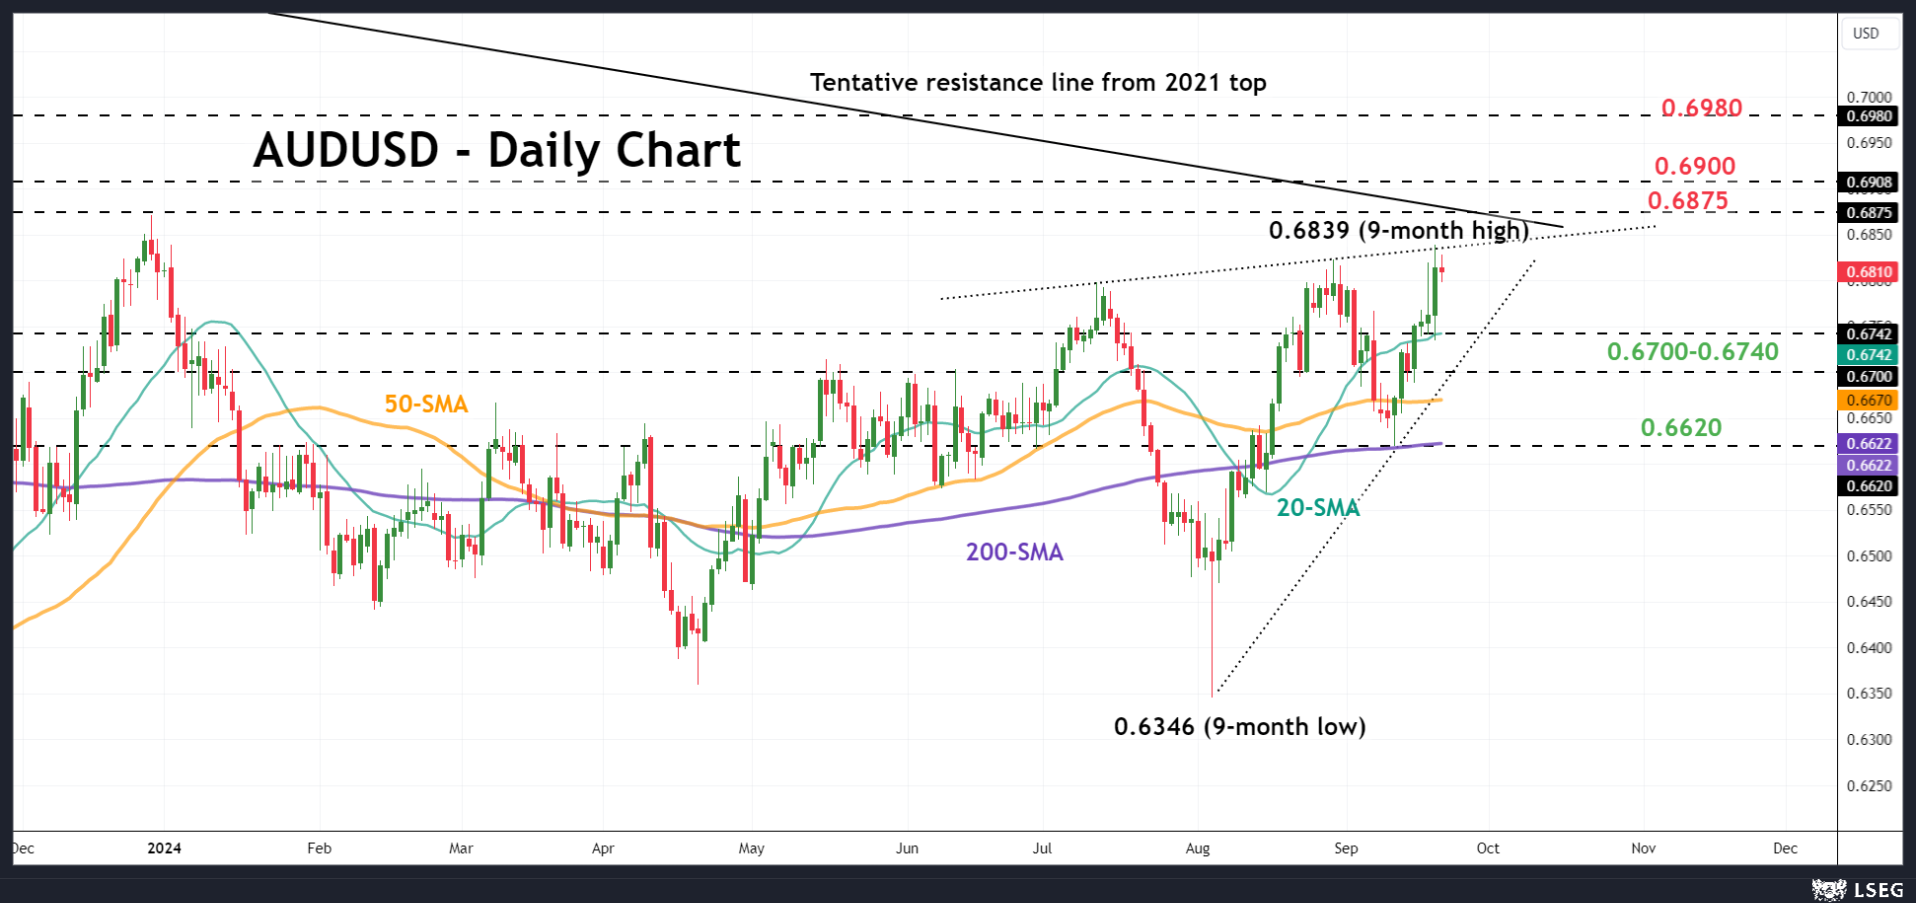
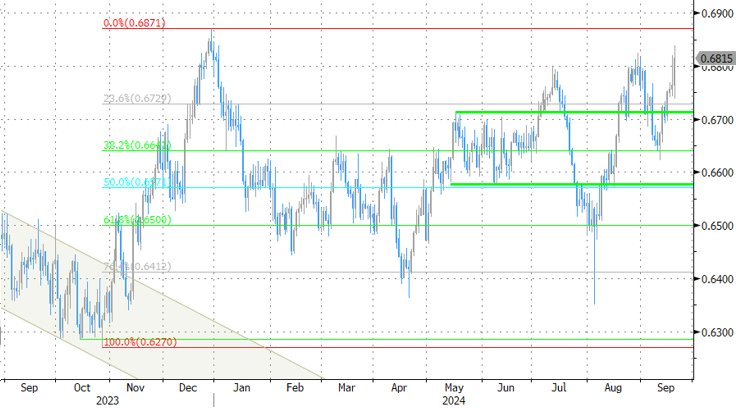
- AUDUSD faces resistance near 0.6835; next barrier around 0.6875-0.6900
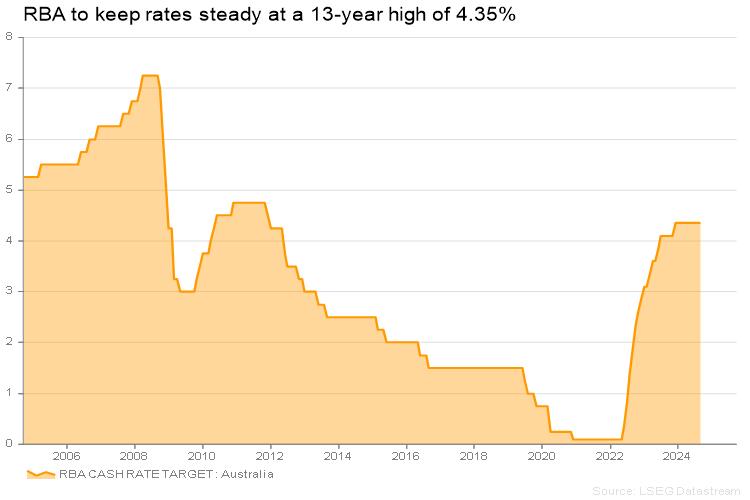
RBA to keep rates steady
It will be time for the Reserve Bank of Australia (RBA) to announce its rate decision when its policy meeting concludes on Tuesday, but don't expect a Fed-like rate surprise.
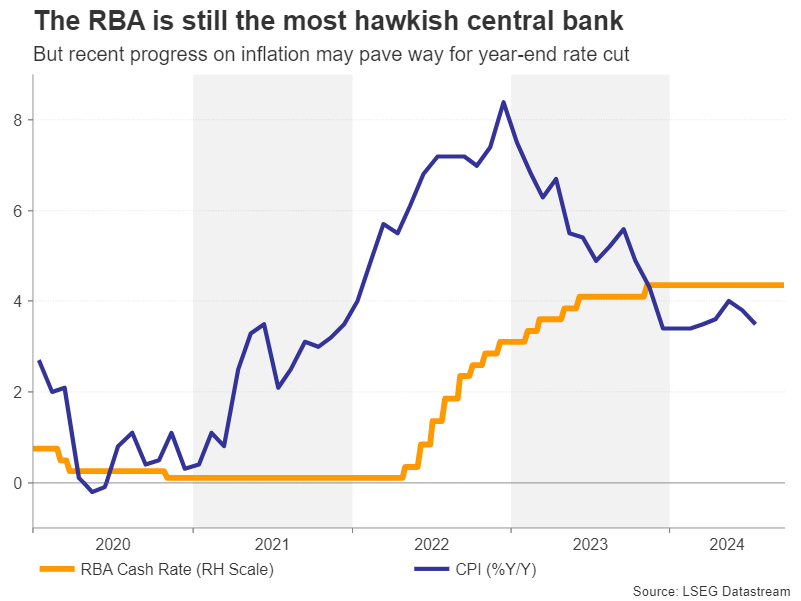
The RBA hasn’t started the phase of rate cuts yet and may stay out of it for the seventh consecutive meeting, keeping interest rates on hold at 4.35% next week. This is lower than the Fed’s and the BoE’s benchmark rates, which peaked higher, and with Australian inflation edging slightly up to 3.8% y/y in Q2 from 3.6% y/y in Q1, policymakers may reasonably abstain from any accommodative moves.
Australian labor market stays solid
Headlines in the labor market have been encouraging since the previous gathering. Employment continued to grow steadily above the pre-pandemic average of 30k for the fifth consecutive month in August, beating analysts’ expectations by a wide margin. The last time Australian jobs showed nonstop growth for more than five months was in 2021.
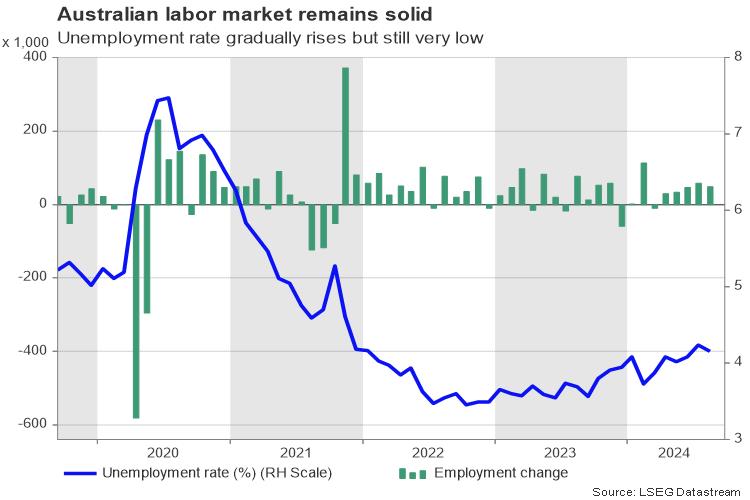
A steady unemployment rate was also good news despite the measure stabilizing slightly above the record low of 3.5%, and with the participation rate holding near all-time high, the labor market remains tight compared to historical standards and a source of inflationary pressures according to the RBA chief economist Sarah Hunter. Therefore, the labor market is not a serious catalyst yet for a dovish policy turn, meaning the central bank might keep the sentence which states “policy should remain sufficiently restrictive” in place for a bit longer.
Will there be a rate cut this year?
Yet, the economy is not in great shape. The overall pace of economic growth is pale at 0.2% q/q and 1.0% y/y as of Q2, making investors wonder about how long the central bank can wait before cutting interest rates. According to futures markets, investors pushed back their rate cut projections from November to December following the latest upbeat jobs report, but kept the odds below 50%. Instead, they feel more confident that the easing phase may start in February 2025 and include four rate cuts by the end of the year.
AUDUSD levels to watch
In FX markets, AUDUSD has been benefiting from the RBA-Fed policy divergence, hitting a nine-month high of 0.6837 on Thursday. Persisting hawkish signals similar to the August meeting, including steady rates by the end of the year and inflation concerns, may not surprise investors. Perhaps, the aussie could enjoy some gains if the odds for a 25bps rate cut move beyond December to February. Technically, a bounce above 0.6835 could immediately pause within the 0.6875-0.6900 zone. If not, the 0.6980 area taken from February 2023 could be the next obstacle.Alternatively, although the central bank has all the excuses to stand pat on rates, a surprising dovish communication, suggesting the central bank could cut its borrowing costs earlier in 2025 or even in December 2024, might prompt a rapid downfall to 0.6700-0.6740 and then to 0.6620.Later in the week, monthly CPI figures for August could generate fresh volatility in the aussie on Wednesday, while Australian Q3 job vacancies and the RBA’s financial stability review might cause some movement on Thursday.
Week Ahead – SNB to Cut Again, RBA to Stand Pat, PCE Inflation Also on Tap
- SNB is expected to ease for third time; might cut by 50bps
- RBA to hold rates but could turn less hawkish as CPI falls
- After inaugural Fed cut, attention turns to PCE inflation
- September flash PMIs to do the rounds; spotlight on euro area
SNB to keep trimming as strong franc bites
The Swiss National Bank (SNB) will be the final major central bank to announce its policy decision in September. Like the Fed, there is a substantial degree of uncertainty around the size of the cut.
Investors have priced in around a 60% probability of a 25-basis-point rate reduction, with the remaining odds being for a 50-bps move. Expectations for a larger cut have gained ground since the beginning of August when the Swiss franc spiked higher against the US dollar and euro.
SNB chief Thomas Jordan, who will chair his last meeting on Thursday before stepping down at the end of the month, has been quite vocal in expressing his displeasure at the franc’s strength amid calls by Swiss exporters for the central bank to do more to stem the currency’s appreciation.
The franc started the year on the backfoot after hitting nine-year highs versus the dollar and euro in December, but reverted to bullish mode in May, erasing its losses.
This has helped push inflation lower in Switzerland; headline CPI fell to 1.1% y/y in August. However, under the bonnet, the inflation picture isn’t quite so subdued as services CPI has been slowly edging higher this year. Moreover, the GDP data does not point to a particularly dire situation for manufacturers.
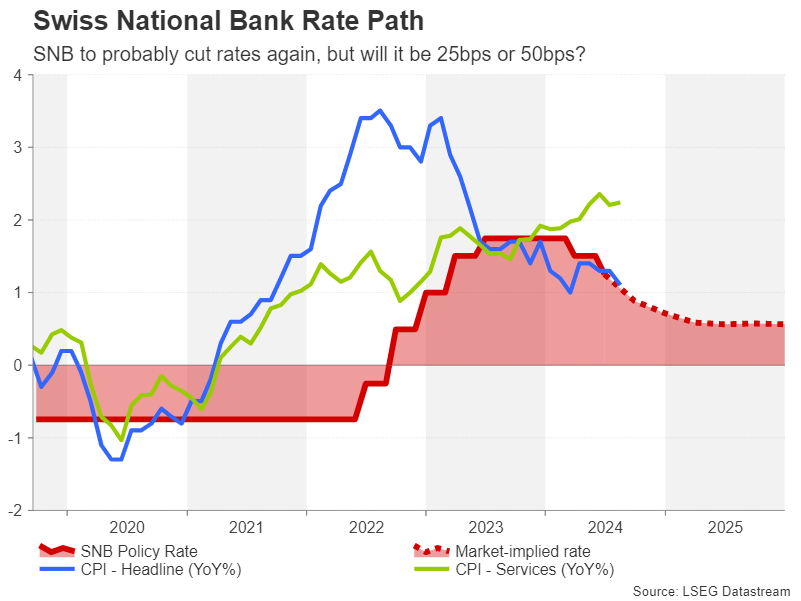
Thus, despite the grievances about a stronger franc, the case for a 50-bps cut isn’t very convincing. Besides, the SNB has already lowered borrowing costs twice this year by a total of 50 bps and opting for a double cut would deplete its arsenal as the policy rate currently stands at just 1.25%.
Nevertheless, a 50-bps reduction on Thursday would still send a clear signal to traders, potentially sparking a selloff in the franc and offering some respite to the export industry, at least in the short term.
No rate cuts in Australia
Prior to the SNB meeting, it will be the turn of the Reserve Bank of Australia to announce its decision on Tuesday. Although inflation in Australia has started to come down again, taking the pressure off the RBA to hike interest rates further, a cut seems some way off.
The monthly CPI prints for August are due on Wednesday so policymakers may not necessarily have access to the latest data. But even if CPI were to fall further, having dropped to 3.5% y/y in July, the RBA is unlikely to want to discuss a rate cut just yet.
However, it’s possible that policymakers will sound less concerned about the upside risks to inflation and a change in tone could pressure the Australian dollar. Yet, a major policy pivot is not likely before the November meeting when economic projections will be updated. Even then, the markets are ahead of themselves and have already priced in about a 70% probability of a 25-bps rate cut by December, so further downside may be limited for the aussie.
Dollar turns to core PCE for support
The Fed may have surprised markets when it slashed rates by a larger-than-expected 50 basis points at its September meeting, but it’s important to highlight that policymakers have not yet declared victory over inflation. And whilst the decision to kick off the easing cycle with a larger increment can be interpreted as a dovish move, Fed officials are not anticipating further big reductions, and 25-bps cuts are more probable if the latest dot plot is to be believed.
This seems to have put a temporary floor underneath the US dollar, as the sharp selloff over the summer that preceded the September decision may take a breather. Alternatively, investors will be looking for fresh clues on inflation that could potentially bolster dovish expectations.
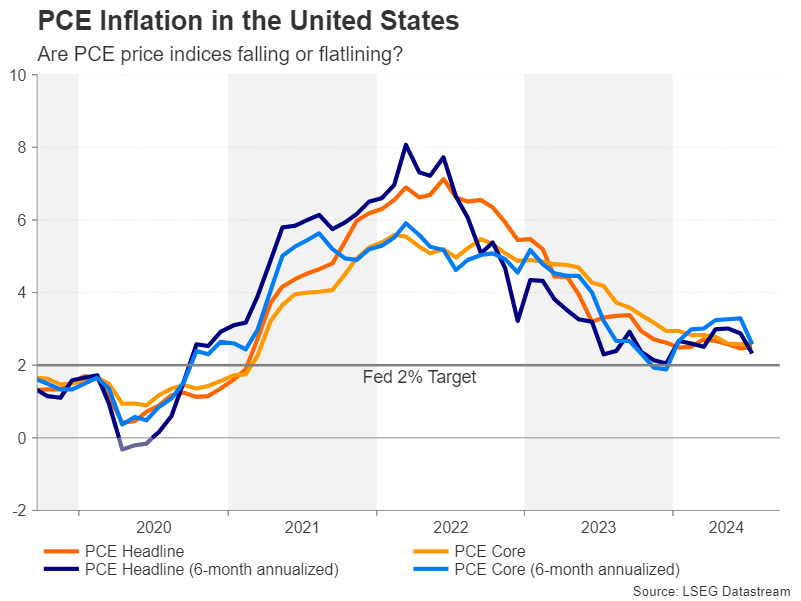
The PCE measures of inflation are due on Friday, along with the personal income and consumption numbers. In July, headline PCE was unchanged at 2.5% while core PCE held steady at 2.6%. Both appear to be flatlining above the Fed’s 2% goal. However, when looking at the 6-month annualized figures, there was a sharp drop in July, suggesting that the PCE gauges will resume their decline over the coming months. This may even have been a factor in the Fed’s decision to lower rates by 50 bps instead of 25 bps.
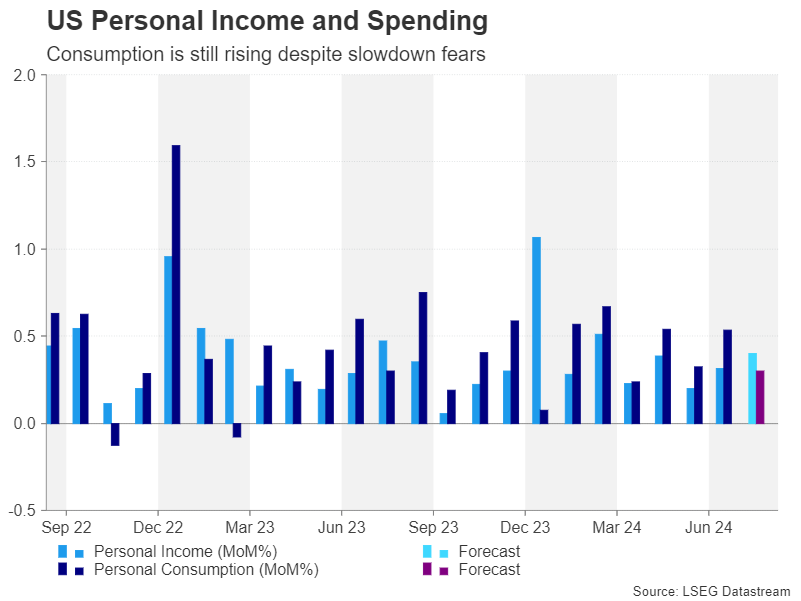
Further supporting the Fed’s actions is the moderation in consumer spending. Personal spending is expected to have risen by 0.3% m/m August after rising by 0.5% m/m in July. Personal income is forecast to have grown by 0.4% m/m.
Ahead of Friday’s data, the S&P Global flash PMIs for September will get the ball rolling on Monday. Although Chair Powell told reporters in his post-meeting press briefing that he doesn’t see any elevated risks of a downturn, any signs of a slowdown in the PMIs could be negative for the dollar.
On Tuesday, the consumer confidence index for September might attract some attention and investors will also be watching a batch of housing indicators that will include new home sales on Wednesday. Also important will be the latest durable goods orders and the final GDP estimate for Q2 on Thursday.
Eurozone PMIs eyed after ECB cut
The European Central Bank lowered interest rates for a second time in September but gave little away in terms of the pace of future easing. After a mini bounce back in the spring, the Eurozone economy appears to be losing steam again. The biggest source of weakness is coming from the bloc’s largest economy – Germany – but growth in the rest of the euro area isn’t quite as anaemic.
The good news is that inflation is almost under control and so the ECB is in a position to respond accordingly to a further deterioration in the growth outlook. In August, the composite PMI edged up, thanks mainly to a rebound in services, but the manufacturing PMI remained in contractionary territory.
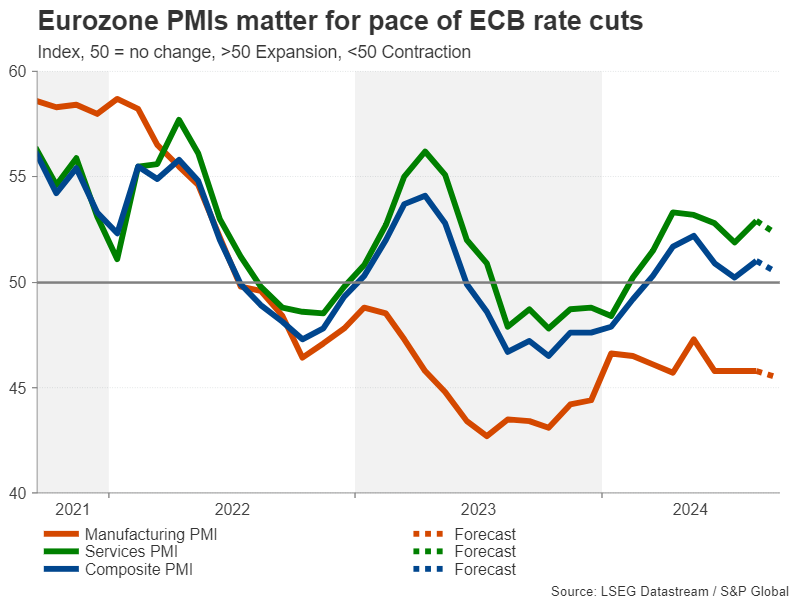
As long as the services sector continues to prop up the broader economy, the ECB will likely maintain a cautious stance until it can be more confident that inflation has been fully tamed. Hence, the euro might not react much to Monday’s data unless there’s a big negative surprise.
More business surveys will follow on Tuesday in the form of Germany’s ifo business climate index.
Will UK PMIs continue to outperform?
The flash PMIs will also be the main highlight in the United Kingdom. The Bank of England has taken a leaf out of the ECB’s book in not pre-committing to a particular easing path, although a 25-bps cut in November is highly likely after policymakers stood pat in September.
All three of the UK’s PMI indices climbed for a second straight month in August, underscoring the brighter economic picture during 2024. A further improvement in September would likely lessen the urgency for the BoE to switch to a faster pace of rate cuts, boosting the pound.
Japanese data could be vital for yen bulls
Finally in Japan, the flash PMIs are up first on the agenda on Tuesday before CPI figures for the Tokyo region come within investors’ radar on Friday.
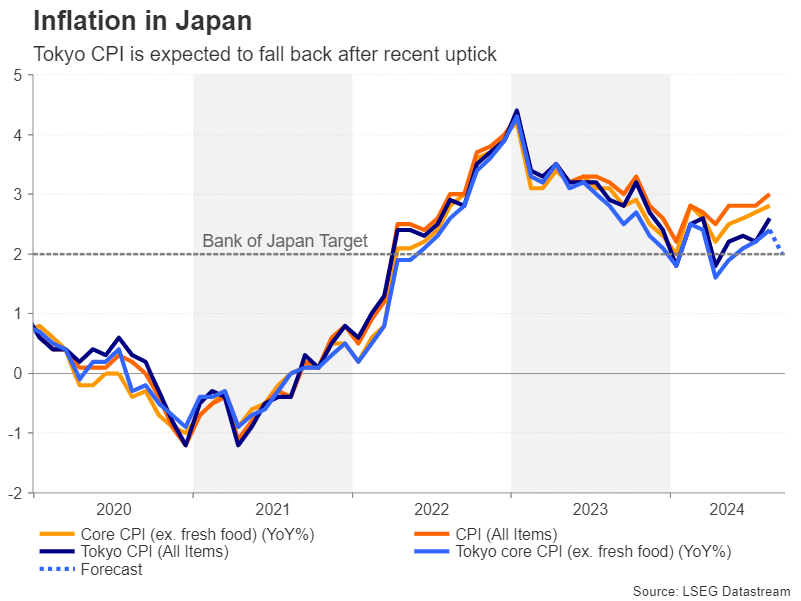
Markets are undecided if the Bank of Japan will hike interest rates again this year, amid a patchy economic performance and signs that inflationary pressures are no longer so pronounced.
Still, if the PMIs show that the economy is maintaining the recovery that got underway in Q2 and there’s another uptick in the Tokyo CPIs, the yen might be able to resume its uptrend, which came to a halt after the dollar staged an unexpected rebound in the aftermath of the Fed meeting.
Weekly Focus – Fed Initiating the Easing Cycle with 50bp Cut
The main event this week was the monetary policy meeting in the US where markets prior to the meeting were historically divided between a 25bp and 50bp cut. The Federal Reserve chose to lower the policy rate by 50bp to a new target range of 4.75-5.00%. The larger move was motivated by a significant shift in the Fed's risk assessment. 12 out of 18 participants saw risks to unemployment rate tilted to the upside (prev. 4 participants), and the median unemployment rate forecast was revised up through 2024-2026. Despite this, Powell downplayed the probability of a recession during the press conference, as faster rate cuts are set to support growth. The updated dots signal a total of 50bp of additional cuts in 2024, 4x25bp of cuts in 2025 and 2x25bp cuts in 2026. Hence, the Fed signals a longer but more gradual rate cutting cycle compared to our call of 25bp cuts in every meeting until June, leaving a terminal rate at 3.00-3.25% by end of 2025.
This week, we also had monetary policy meetings in the UK, Japan, and Norway (see p. 4). In UK, the Bank of England left the policy rate unchanged at 5.0%. The vote-split revealed 8 members voting for an unchanged rate and one in favour of a 25bp cut. We expect the next rate cut in November and a pause in December before a pick-up in cutting pace in 2025. In Japan, the BoJ kept the policy rate unchanged as widely expected. As growth and inflation has picked up, we expect the next rate hike in December.
China released their monthly batch of data for a wide range of areas. The data painted a picture of an economy that lost even further momentum in August. The weak Chinese demand is contributing to the downward pressure on global commodity prices as well as Chinese export prices leaving China as a key disinflationary force in the world. China is also weighing on the recent weak global manufacturing growth.
In Europe, domestic inflation remains strong while growth momentum weakened. The final euro area inflation data showed that the 'LIMI' measure of domestic inflation declined to 4.2% y/y from 4.3% y/y in July.
Momentum eased but the high yearly growth rate favours a cautious easing approach of the ECB. The German ZEW survey showed the weakest assessment of the economic situation since Covid, and expectations declined to a year-low, highlighting the fragility of the German economy.
Next week focus will be on September PMIs from the US and the euro area. On both sides of the Atlantic, we expect the weakness in manufacturing to continue and services holding up activity. Services PMIs will likely decline in the euro area as the boost from the Olympic games recorded in August fades, but excluding this growth momentum was likely unchanged. On the central bank front, we follow a long list of Fed speakers including Powell on Thursday and rate decisions in China, Australia, and China. We expect the Chinese central bank to ease policy to stimulate the weak economy while the RBA is expected to leave the policy rate unchanged. In Switzerland, we expect the SNB to lower the policy rate by 25bp to 1.0%.
On Friday, we receive the US PCE inflation measure and inflation data from Spain and France ahead of the euro area print. We expect energy prices to pull euro area inflation significantly down to 1.8% y/y while core should remain unchanged at 2.8% y/y (0.20% m/m s.a.) due to sticky services inflation. In Japan, we follow the vote for a new leader and thus prime minister of the ruling party, as it could influence financial markets.
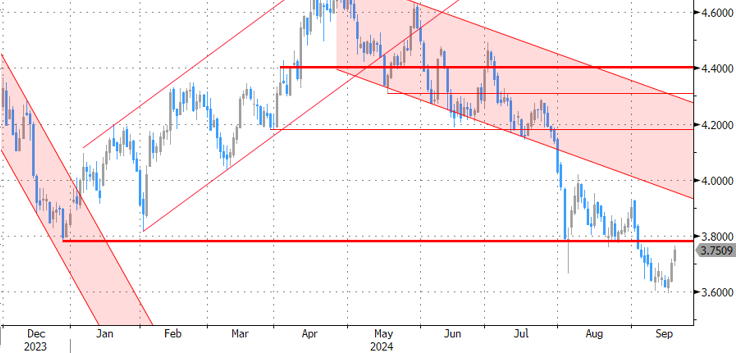
Gold Terminates the Last Sceptics
Gold started the week with new highs and ended the week with a 1.3% gain, digesting a 2% dip on profit-taking following the Fed’s rate decision. The loosening of monetary policy by more than economists had expected and forecasts of further active cuts brought back appetite for risk assets. However, the turnaround in US 10-year government bond yields has set a more cautious tone.
A fall in government bond yields increases interest in gold as an alternative to capital preservation, all other things being equal. This inverse correlation worked well last year but has started to fail this year and broke down this week when gold prices and yields started to rise simultaneously. If this is not a sign of a flight from dollar assets, it may be a sign that gold is nearing a peak.
The forced liquidation of short positions may push the gold price higher into historical highs, as the US dollar generally holds its ground against a basket of major currencies, and rising bond yields create an unfavourable environment for gold.
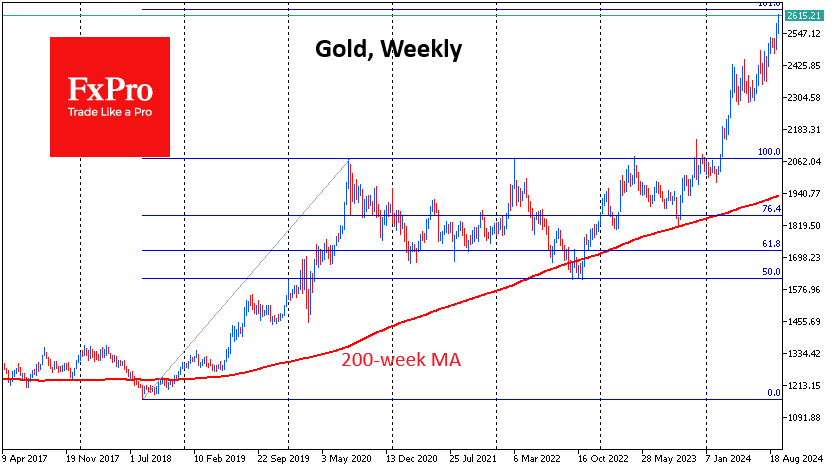
From a technical point of view, the area of attraction for the price seems to be $2640, which is the 161.8% level from the initial upward momentum in August 2018 to the peak in August 2020. This was followed by two years of trading in a wide range, with the deepest decline in September-October 2022, which set the stage for a new advance.
If gold continues to follow its two-year cycles, the upside momentum could soon be replaced by a sideways or sharp reversal like we saw in 2011.
Major turning points in gold over the past six years have come at the touch of the 200-week simple moving average. It is now almost 40% or over $1100 behind the price. In absolute terms, this is the largest gap since 2011 and in relative terms since 2020. This difference makes the potential for a correction that could take the price to $2000 within a year or two enormous.
The accumulated overbought conditions in gold does not imply an immediate reversal. On the contrary, the most violent part of the rally, with a massive short squeeze, may still be ahead. However, traders should also be on the lookout for signs of growth exhaustion, which could follow a very sharp correction.
BTCUSD – Bulls Likely to Take a Breather Following Repeated Failure at 200DMA Barrier
BTCUSD edged higher on Friday and hit new three week high, in attempts to extend 4.6% advance on Thursday.
Bitcoin received strong boost from Fed rate cut and underpinned by dovish shift in global rate view.
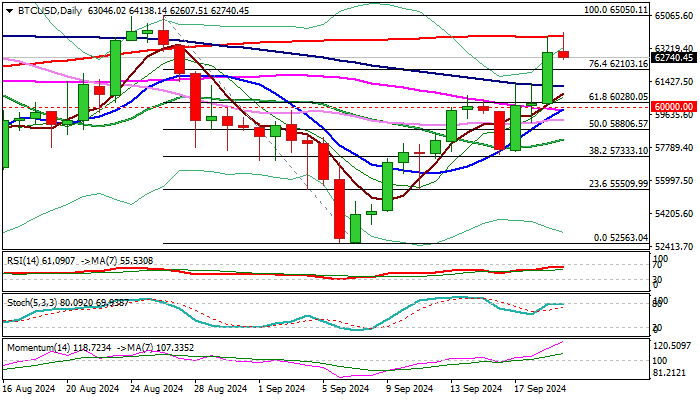
Technical picture is bullish on daily chart (multiple MA bull-crosses / 14-d momentum is in steep ascend), but bulls face headwinds from overbought conditions, which was presented through repeated failure to break pivotal 200DMA barrier at 63869.
The second consecutive daily close below 200DMA to confirm signal that bulls may take a breather for consolidation before resuming.
Dips are likely to be shallow, as overall picture is bullish and positive sentiment is strong.
Support at 61157 (100DMA) should ideally contain dips and guard lower pivots at 60000 zone (psychological / 10/55 DMA bull-cross) loss of which would sideline bulls.
Res: 63869; 64138; 64500; 65050
Sup: 62607; 62103; 61928; 61156
Sunset Market Commentary
Markets
Main potential market movers already hit the screens this morning before the start of European dealings with the BOJ policy decision and the UK consumer data. The BOJ as expected left its policy rate unchanged at 0.25%, but communication on the timing of future rate hikes was more balanced than expected.
The BOJ upgraded its assessment on private consumption (on a moderate increasing trend versus being reliant previously) as the virtuous cycle from income to spending gradually intensifies. With respect to consumer prices the BOJ still sees (underlying) inflation at a level that is generally consistent with the price stability target in the second half of the policy horizon, even as the impact from past rise in import prices is waning. The statement didn’t reveal any intentions on (the timing of) further hikes. In the news conference, governor Ueda indicated that the BOJ is still prepared to raise rates further, but there’s no rush. Uncertainty on the economic outlook overseas and instability on financial markets are a reason to take time to assess developments. The rise of the yen also eased the upside risk to prices. The BOJ apparently doesn’t want to further accelerate the sharp rise of the yen since late July. More aggressive Fed rate cuts in this respect are also important input for the path of BOJ normalization. An October rate hike now looks unlikely. The yen early this week touched peak levels below USD/JPY 140 for the first time since end-July last year, but today rebounded further to the 144 area.
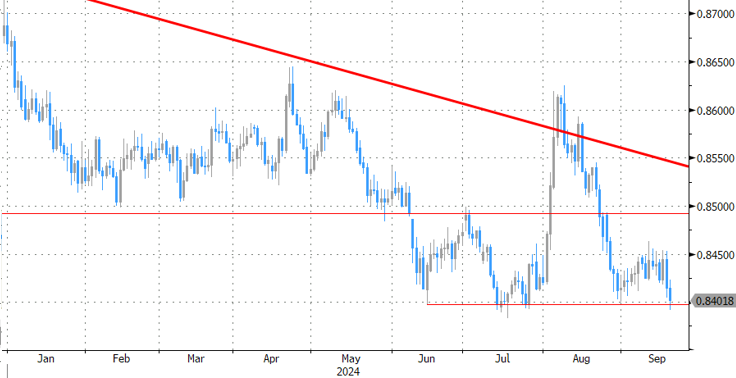
UK consumer data were mixed. GFK consumer confidence unexpectedly tumbled from -13 to -20 as consumers turn more negative on their personal situation and on the global economy. On the other hand, August retail sales showed solid growth for the second consecutive month (Aug +1.0%, July upwardly revised from 0.5% to 0.7%). The UK data only had limited impact on UK interest rate markets. Gilts are trending in line with Bunds (UK yields +/- 1 bp higher across the curve). EUR/GBP tested the key support at 0.8383, but no sustained break occurred.
Trading on core US and European markets took a pause as positions have been adapted to the 50 bps Fed rate cut, and new guidance. US yields are rising modestly (2-y + 4.5 bps, 30-y +2.5 bps). Markets need more data to become more convinced on potential additional 50 bps steps later this year. In the meantime, key support levels are ‘blocking’ further downside in yields. German yields are rising about 1 bp. After yesterday’s reflationary jump, especially European equites are falling prey to profit taking (Eurostoxx 50 -1.2%, S&P 500 -0.2%). Despite a less buoyant risk sentiment, the dollar is holding near recent lows (DXY 100.75, EUR/USD 1.116), with USD/JPY the exception (cf supra).
News & Views
Belgian consumer confidence took a dive in September from -3 to -7, matching the previous one-year low from May and settling at just below its long-term average. The National Bank of Belgium noted that the loss of confidence affected all components of the indicator. Economic expectations for the next twelve months are down sharply. Concerns about a resurgence in unemployment shot up to its highest level in almost two years. Expectations on the current general economic situation also deteriorated after a rebound last month. The NBB said that the gloom that’s affecting the Belgian industry, particularly the automotive sector, is sapping consumer morale. Households are planning to save less in the months to come and have become slightly less optimistic about their financial situation for the next twelve months.
French prime minister Michel Barnier sat down with president Macron late yesterday to discuss a proposal for a new government. Barnier labelled the talks as constructive and said that after some final changes he’ll announce the team by Sunday. Getting the vote of confidence by parliament is the tricky part though. Not a single group has a majority, so each of them can sink the proposal. Bloomberg citing French media reported that most of the team is made up of figures from Macron’s centrist group and Barnier’s conservative Republicans party. Should the cabinet get the seal of approval, it immediately faces a daunting task: presenting the budget bill to rein in worsening deficits.
Graphs
USD/JPY: yen eases further off recent highs as BOJ turns more balanced on pace of policy normalization.
EUR/GBP testing YTD low on solid UK retail sales. No sustained break yet.
Dow Jones pausing near all-time top as markets are pondering the impact of the Fed turning to support growth.
Gold ($ p/oz): easier global financial conditions propel gold to new record, irrespective of risk sentiment.
EUR/USD Mid-Day Outlook
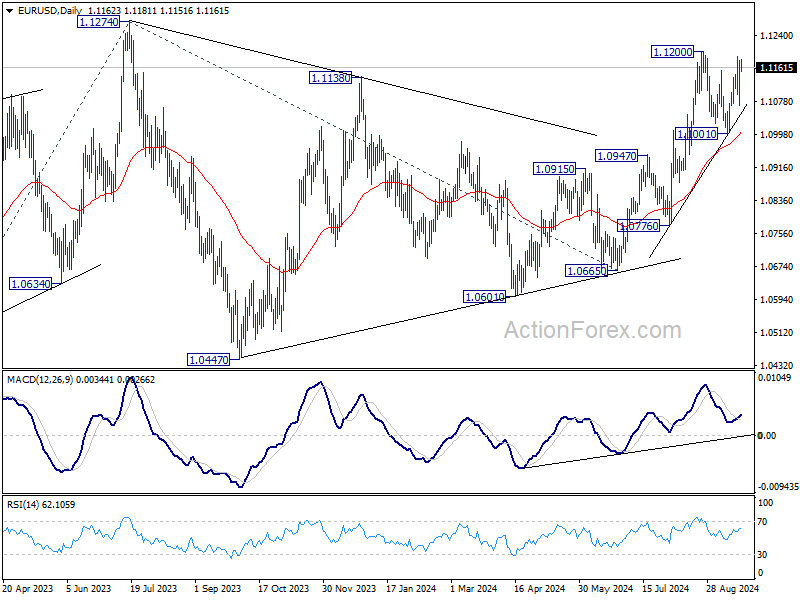
Daily Pivots: (S1) 1.1096; (P) 1.1137; (R1) 1.1204; More....
No change in EUR/USD's outlook and intraday bias stays on the upside. Decisive break of 1.1200will resume larger the rally from 1.0665 to 1.1274 high. Firm break there will resume larger up trend. On the downside, however, break of 1.1072 will turn bias back to the downside for 1.1001 support instead.
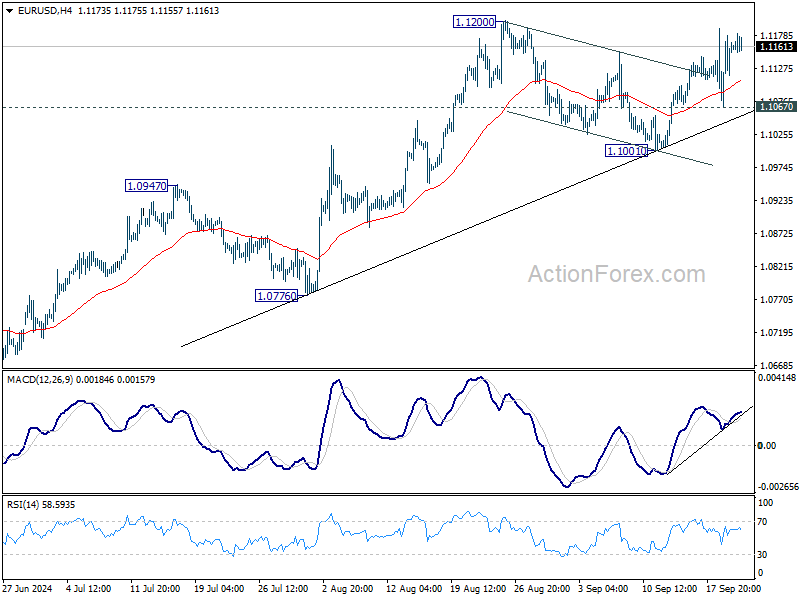
In the bigger picture, prior break of 1.1138 resistance indicates that corrective pattern from 1.1274 might have completed at 1.0665 already. Decisive break of 1.1274 (2023 high) will confirm resumption of whole up trend from 0.9534 (2022 low). Next target will be 61.8% projection of 0.9534 to 1.1274 from 1.0665 at 1.1740. This will now be the favored case as long as 1.0947 resistance turned support holds.
USD/CHF Mid-Day Outlook
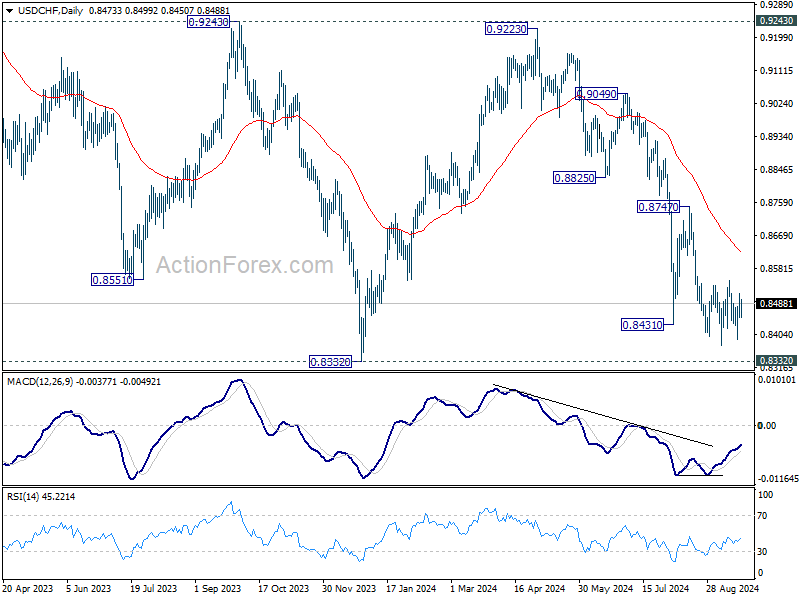
Daily Pivots: (S1) 0.8446; (P) 0.8480; (R1) 0.8512; More…
No change in USD/CHF's outlook as range trading continues. Intraday bias remains neutral at this point. On the downside, break of 0.8374 will resume the fall from 0.9223 to retest 0.8332 low. Decisive break there will indicate larger down trend resumption. However, considering bullish convergence condition in 4H MACD, break of 0.8548 resistance will confirm short term bottoming, and turn bias back to the upside for 0.8747 resistance.
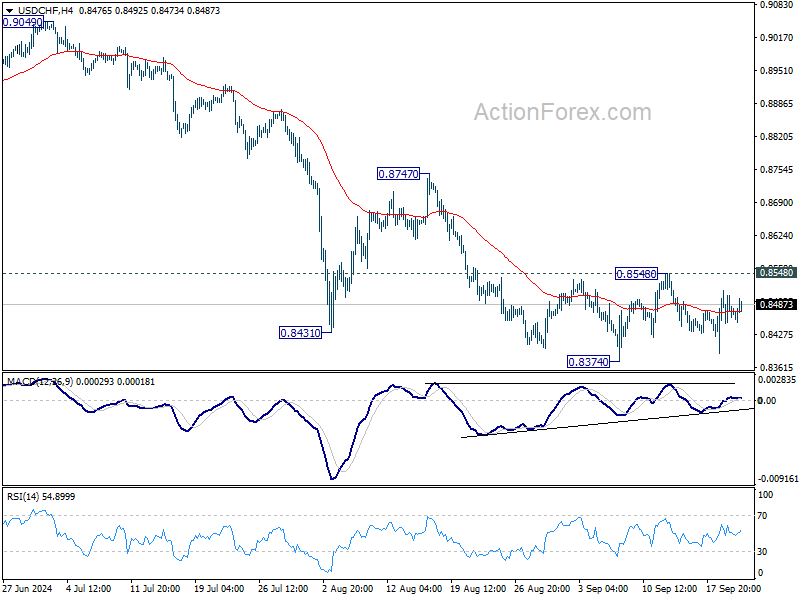
In the bigger picture, price actions from 0.8332 (2023 low) are currently seen as a medium term corrective pattern, with fall from 0.9223 as the second leg. Strong support could be seen from 0.8332 to bring rebound. Yet, overall outlook will continue to stay bearish as long as 0.9243 resistance holds. Firm break of 0.8332, however, will resume larger down trend from 1.0146 (2022 high).
USD/JPY Mid-Day Outlook
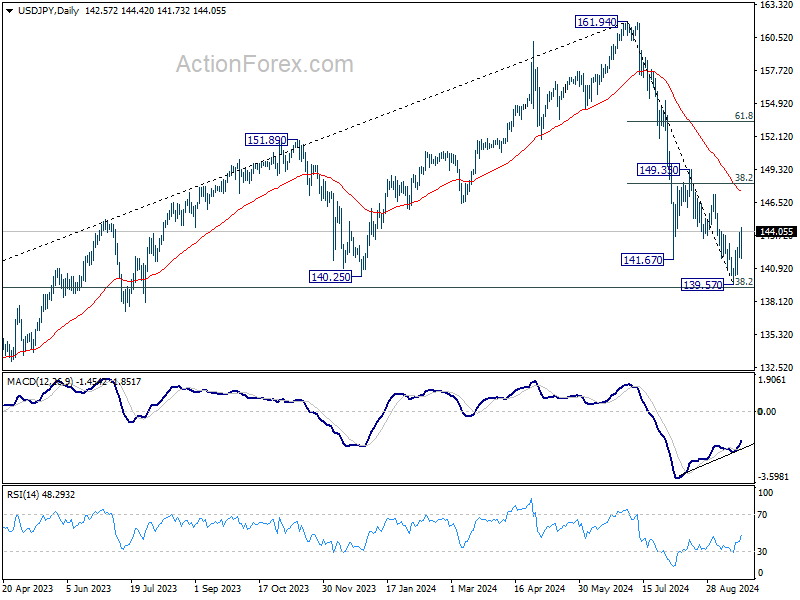
Daily Pivots: (S1) 141.70; (P) 142.82; (R1) 143.76; More...
Intraday bias in USD/JPY remains on the upside at this point. Rebound from 139.57 short term bottom should target 55 D EMA (now at 147.37), and possibly further to 38.2% retracement of 161.94 to 139.57 at 148.11. On the downside, below 141.73 minor support will turn bias to the downside for retesting 139.57 instead.
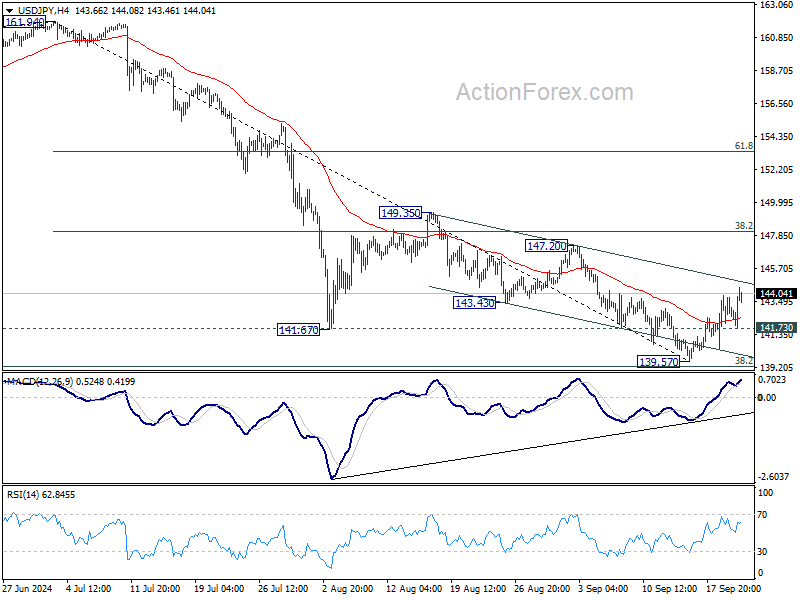
In the bigger picture, fall from 161.94 medium term top is seen as correcting whole up trend from 102.58 (2021 low). Strong support could be seen from 38.2% retracement of 102.58 to 161.94 at 139.26 to contain downside, at least on first attempt. But in any case, risk will stay on the downside as long as 149.35 resistance holds. Sustained break of 139.26 would open up deeper medium term decline to 61.8% retracement at 125.25.
Canada: Retail Sales Recover from Two-Month Slump.
Retail sales rose by 0.9% month-on-month (m/m) in July, reversing the two-month downward trend. This was higher than the Statistics Canada's advanced estimate of a 0.6% gain.
Adjusting for the impact of inflation, the volume of retail sales was up 1.0% m/m in July.
Sales at motor vehicle and parts dealers rose by 2.2% m/m, following June's 2.1% contraction attributed to operational difficulties due to a series of cyberattacks.
Receipts at gas stations and fuel vendors fell 0.5% m/m in nominal terms, despite higher prices at the pump (2.4% m/m growth in July).
Excluding auto sales and receipts at gas stations, core retail sales were up by 0.6% m/m in July.
- The gain in core sales was led by food and beverage stores and general merchandise stores, which both gains 0.8% on the month.
- Building material and garden equipment and supplies dealers (-1.4% m/m) was the largest loser of today's report.
E-commerce sales rose by 3.4% m/m following an upwardly revised reading in June ( +0.2% m/m from -2.4% m/m reported in the advance estimate).
Statistics Canada's advanced estimate for August points to another month of growth of 0.5% m/m.
Key Implications
Today's rebound in retail sales was led by stronger auto sales, which recovered from an operational setback in June. This was enough to bring three-month average auto sales growth into positive territory for the first time since January. The rest of the categories also told an encouraging story as growth in core sales accelerated on the month, likely driven by strong population. We expect the rebound in durable goods will support growth in goods spending for Q3 resulting in total personal consumption expenditures gain of 1.0% quarter-on-quarter (annualized).
A good start to the quarter is unlikely to sway the odds decisively on whether the Bank of Canada will cut rates by 50 basis points in October. Despite the good news today and another month of projected growth, the downward trend in retail spending per capita is clear. In addition to employment and inflation figures, the Bank’s communication will be critical to watch for any signs of change in the pace of easing.