Sample Category Title
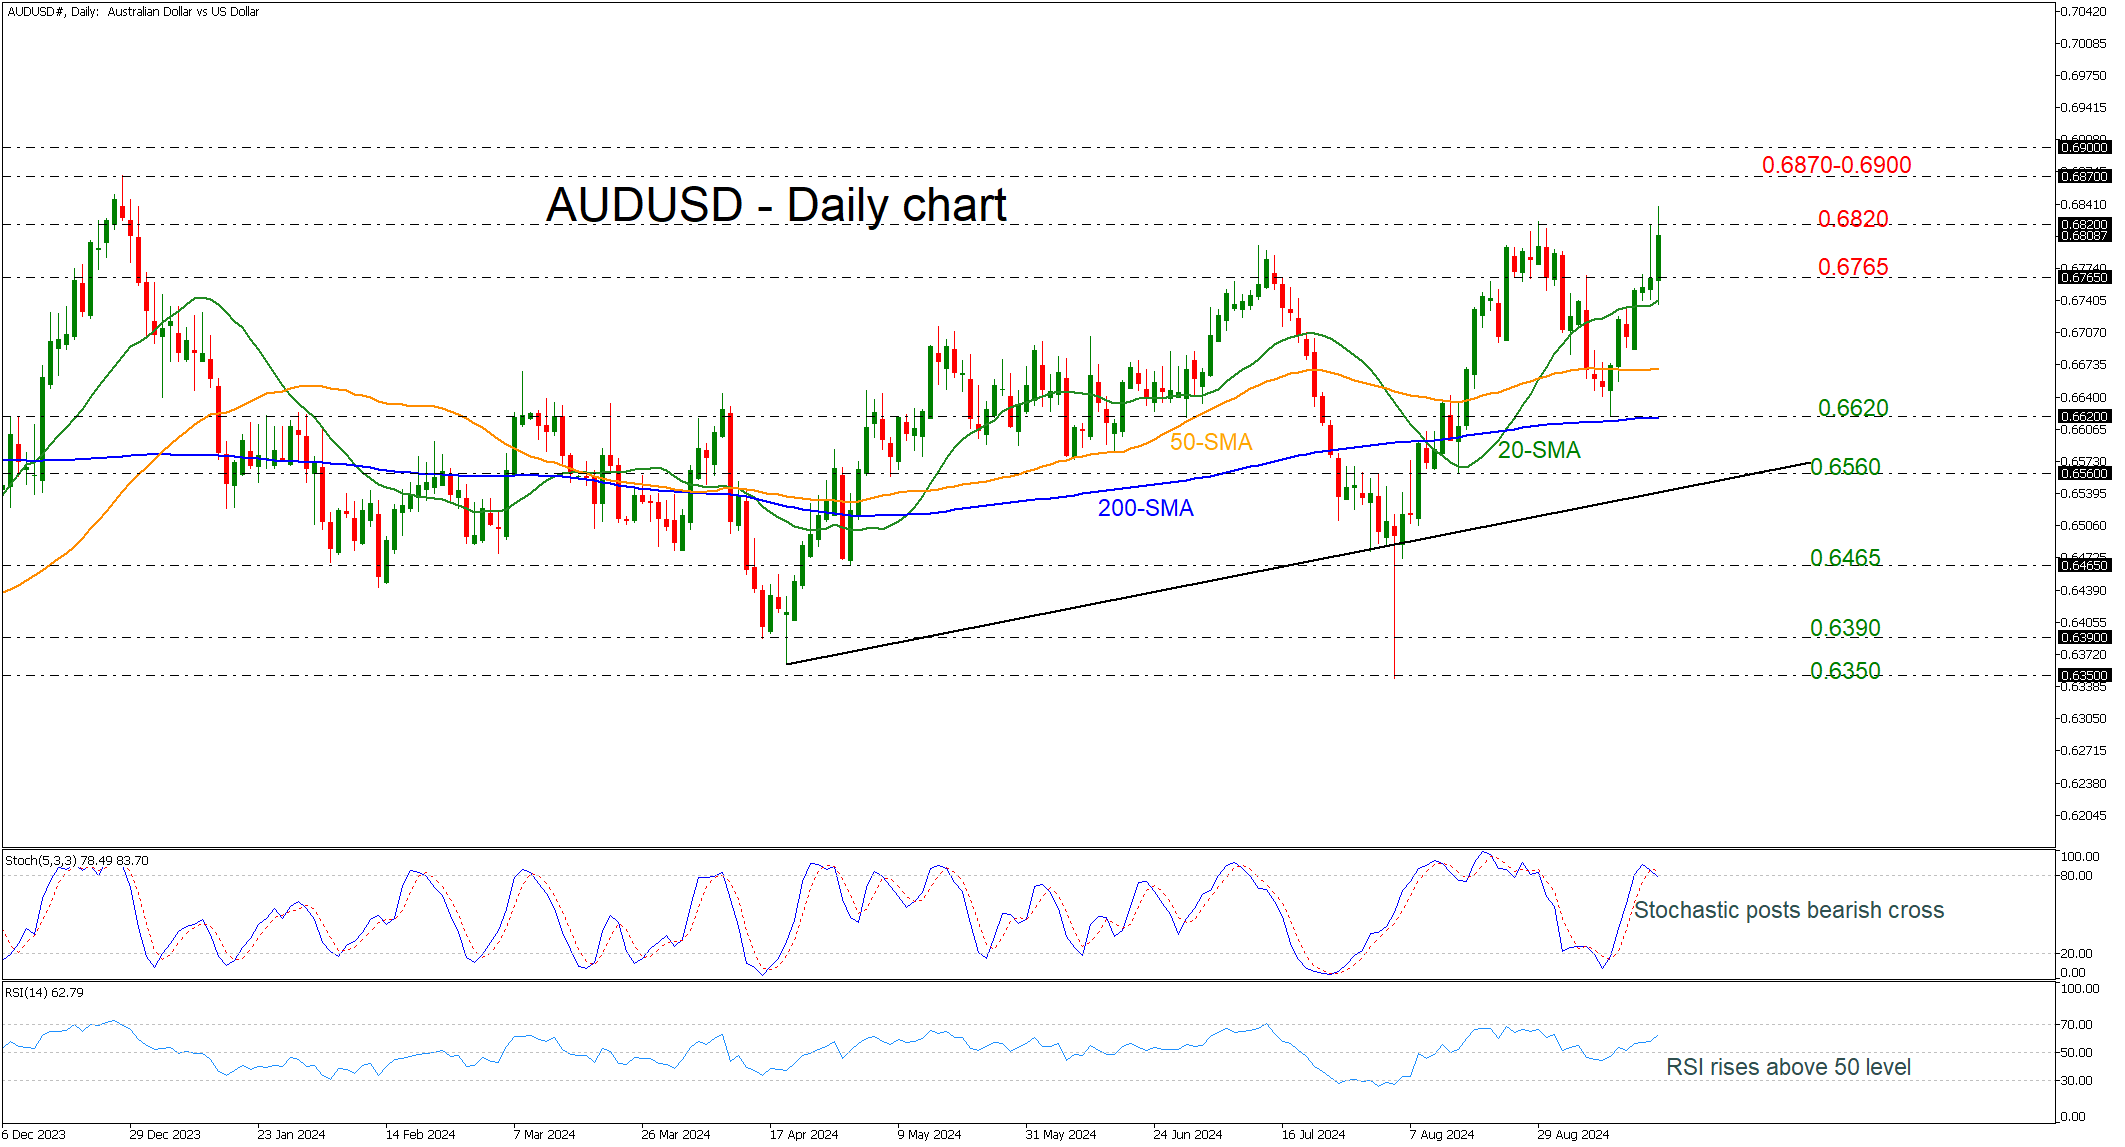
AUDUSD Posts New 9-Month High
- AUDUSD rally continues after bounce off 200-day SMA
- Technical oscillators are mixed
AUDUSD has printed a fresh nine-month high of 0.6838 earlier today, creating the fourth consecutive green candle. The pair found significant support at the 200-day simple moving average (SMA) at 0.6620, continuing the medium-term bullish structure.
The technical oscillators are showing some contradicting sings in the daily chart. The stochastic posted a bearish crossover within its %K and %D lines in the overbought region; however, the RSI is keep rising momentum above the 50 territory.
More upside pressure could open the way for a test of the 0.6870-0.6900 resistance region, taken from the highs in December 2023 and in June 2023.
Alternatively, a decline below the 0.6765 support could raise the speculation for a negative correction taking the market until the 50-day SMA at 0.6670 and then towards the 0.6620 barricade.
All in all, AUDUSD has been in a bullish tendency since April and only a dive below the uptrend line could change the current outlook.
Sunset Market Commentary
Markets
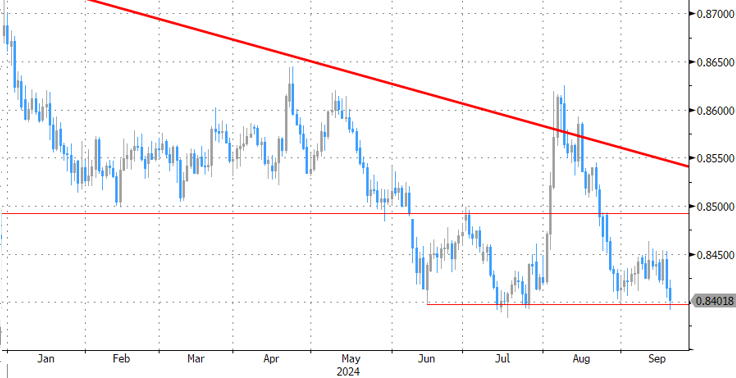
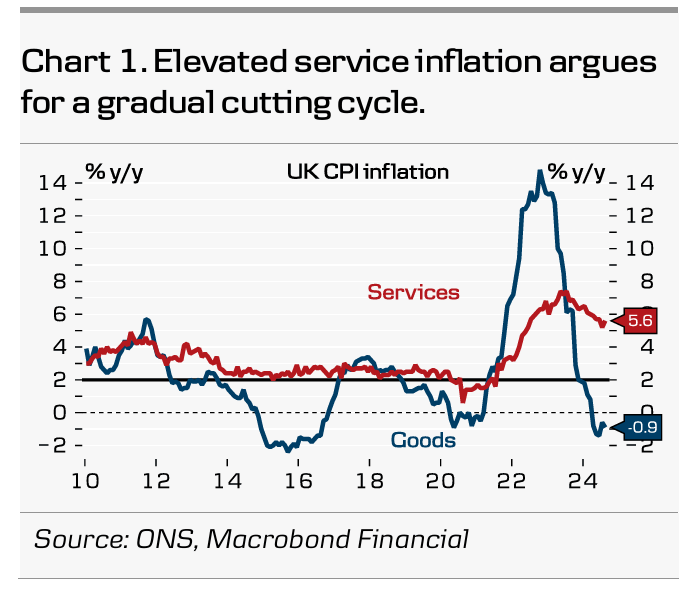
The Bank of England left its policy rate unchanged at 5% in a 8-1 majority vote. Swati Dhingra dissented in favour of a 25 bps rate cut, on the back of last month’s inaugural move. The central bank also announced an intention to reduce the stock of UK government bond purchases held for monetary policy purposes, and financed by the issuance of central bank reserves, by £100bn over the next 12 months, to a total of £558bn. That’s the same pace as the past 12 months and implies limited active sales (£13bn) given the growing amount of naturally maturing UK Gilts (£87bn). There had been some speculation of an accelerated winddown to address liquidity issues at the front end of the curve where a lot of Gilts are stuck at the BoE balance sheet and where debt issuance is scarce. There has generally been limited news in UK economic indicators relative to the Committee’s expectations in the August Monetary Policy Report. Headline GDP growth is expected to return to its underlying pace of around 0.3% per quarter in the second half of the year. CPI inflation was 2.2% Y/Y in August, and is expected to increase to around 2.5% towards the end of this year as declines in energy prices last year fall out of the annual comparison. Services consumer price inflation remained elevated at 5.6% in August. Private sector regular average weekly earnings growth declined to 4.9% in the three months to July. The MPC suggests that in the absence of material developments, a gradual approach to removing policy restraint remains appropriate. We take this hint as a quarterly rate cut approach similar to the one of the ECB. In case of the BoE, we expect another 25 bps rate cut at the next November policy meeting which includes a new Monetary Policy Report. UK gilt yields add 3.7 bps (2-yr) to 5.8 bps (10-yr) as some expected a follow-up rate cut today. Sterling outperformed with EUR/GBP testing the 0.84 big figure/support zone. Cable (GBP/USD) set a minor new cycle high at 1.3314.
Global markets digested yesterday’s bumper 50 bps FOMC rate cut. US Treasuries rallied with the front end of the curve outperforming up until the release of early US eco data. They showed a slightly better improvement in Philly Fed business outlook, but especially a drop in weekly jobless claims (219k). Together with bullish risk sentiment on stock markets, this currently helps US yields up to 6 bps higher at the very long end of the curve. The dollar initially traded on the backfoot, but EUR/USD’s rally ran into trouble together with US Treasuries (1.1180 intraday top).
News & Views
The Norwegian central bank kept the policy rate unchanged at 4.5% and signaled this will remain the case through end 2024. Inflation has eased by more than expected but underlying gauges have not fallen by the same extent. Particularly worrying the Norges Bank is the larger than expected depreciation of the Norwegian krone. It is seen as a risk to the ongoing disinflation process. While the NB refrained from cutting rates, its governor Wolden Bache did note the time to do so is coming closer. The new policy rate forecasts entails a marginally steeper path down through 2025 (3.75% by end next year). Growth and inflation forecasts were little changed with a still above-target 2.4% inflation in 2027. The NOK is one of the top performers today. EUR/NOK is down from 11.77 to 11.66 with money markets paring bets for a December inaugural cut from 100% yesterday to just 60% today. The ECB’s 25 bps cut last week and especially the Fed’s 50 bps move yesterday probably created some dovish expectations going into the NB meeting today as well. The start of the easing cycle is now seen to take off in early 2025.
The Turkish central bank kept the policy rate steady at 50%. The expected decision was accompanied by a less anticipated drop in language that specifically endorsed further tightening “in case of a significant and persistent deterioration in inflation.” The central bank said that Q3 indicators suggest an ongoing slowdown in domestic demand, resulting in a diminishing inflationary impact. Goods inflation is low and an improvement in services inflation is expected to start next quarter. Both headline and core inflation were above 51% in August. While a significant 10 ppt improvement from the month before, it is still a long way from the central bank’s 38% end-of-year projection and still tenfold the official 5% target. Today’s dovish twist to the statement is seen as the beginning of a U-turn in CBRT policy, probably partially inspired by yesterday’s Fed decision. USD/TRY (34.02) is slightly down for the day but that is by far dollar driven. EUR/TRY by contrast ekes out a gain to just south of 38. The Turkish lira trades near record lows in both cases.
Graphs
EUR/NOK: NOK rallies as central bank pushes back against rate cut expectations for this year

US 10-yr yield extends comeback following FOMC meeting in bullish risk climate

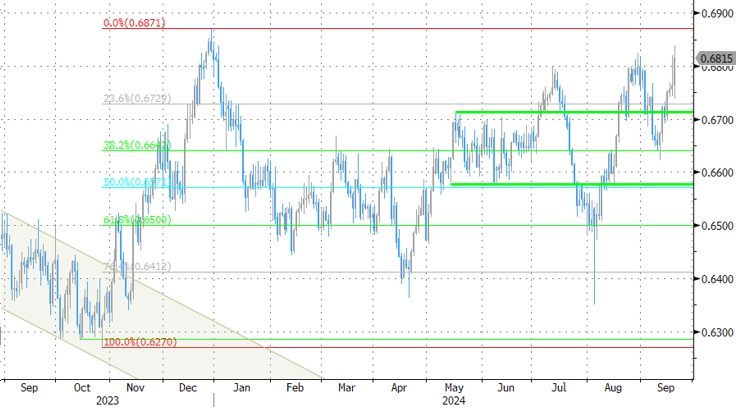
AUD/USD: Aussie labour market supports RBA’s higher-for-longer stance
EUR/GBP tests 0.84 support zone on BoE status quo but break lower becomes a touch nut to crack
EUR/CHF Mid-Day Outlook
Daily Pivots: (S1) 0.9386; (P) 0.9405; (R1) 0.9427; More....
EUR/CHF's break of 0.9444 resistance suggests that pull back from 0.9579 has completed at 0.9305 already. Rise from there is seen as the third leg of the pattern from 0.9209. Intraday bias is back on the upside for 0.9579 resistance next. On the downside, below 0.9380 minor support will turn bias back to the downside for 0.9305 support instead.
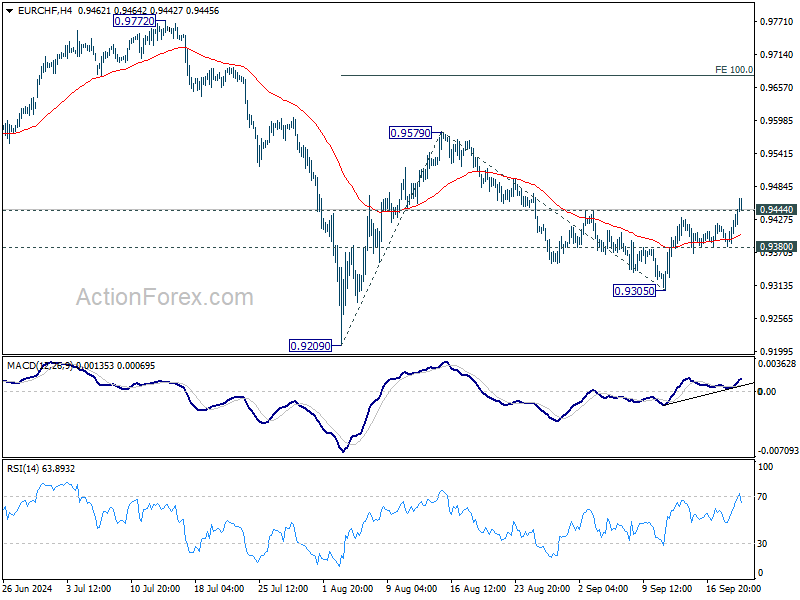
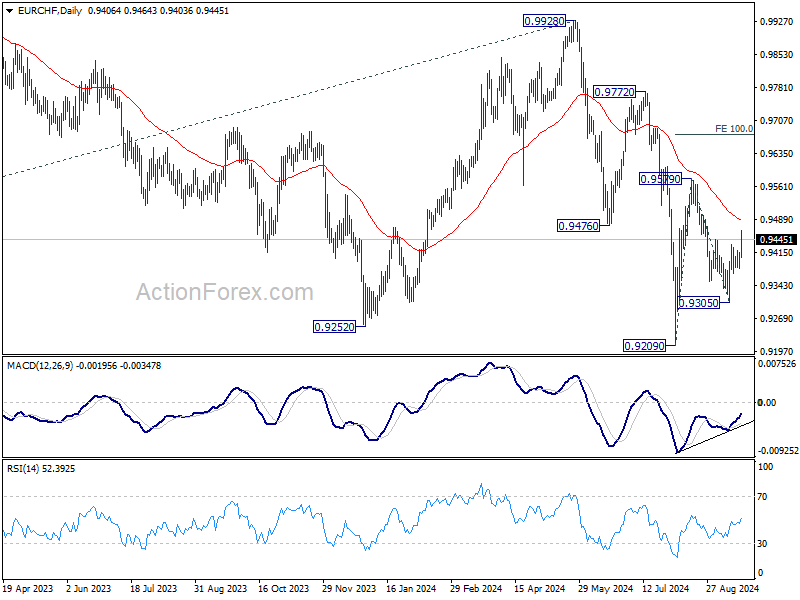
In the bigger picture, medium term corrective pattern from 0.9407 (2022 low) might have completed with three waves to 0.9928. Decisive break of 0.9252 (2023 low) will confirm long term down trend resumption. Next target will be 61.8% projection of 1.1149 to 0.9407 from 0.9928 at 0.8851. For now, outlook will stay bearish as long as 0.9928 resistance holds, even in case of strong rebound.
USD/JPY Mid-Day Outlook
Daily Pivots: (S1) 140.89; (P) 141.80; (R1) 143.16; More...
Intraday bias in USD/JPY remains mildly on the upside at this point. Rebound from 139.57 short term bottom should target 55 D EMA (now at 147.58), and possibly further to 38.2% retracement of 161.94 to 139.57 at 148.11. For now, risk will stay on the upside as long as 139.57 support holds, in case of retreat.
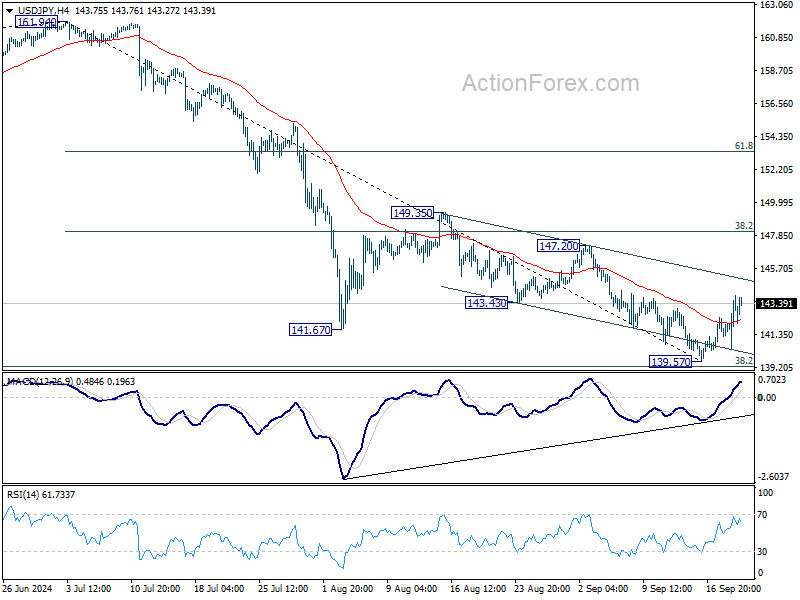
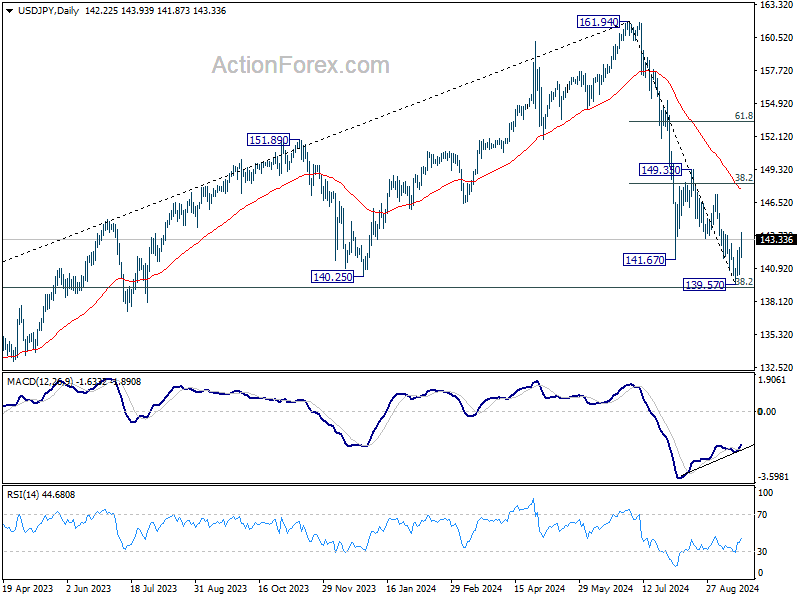
In the bigger picture, fall from 161.94 medium term top is seen as correcting whole up trend from 102.58 (2021 low). Strong support could be seen from 38.2% retracement of 102.58 to 161.94 at 139.26 to contain downside, at least on first attempt. But in any case, risk will stay on the downside as long as 149.35 resistance holds. Sustained break of 139.26 would open up deeper medium term decline to 61.8% retracement at 125.25.
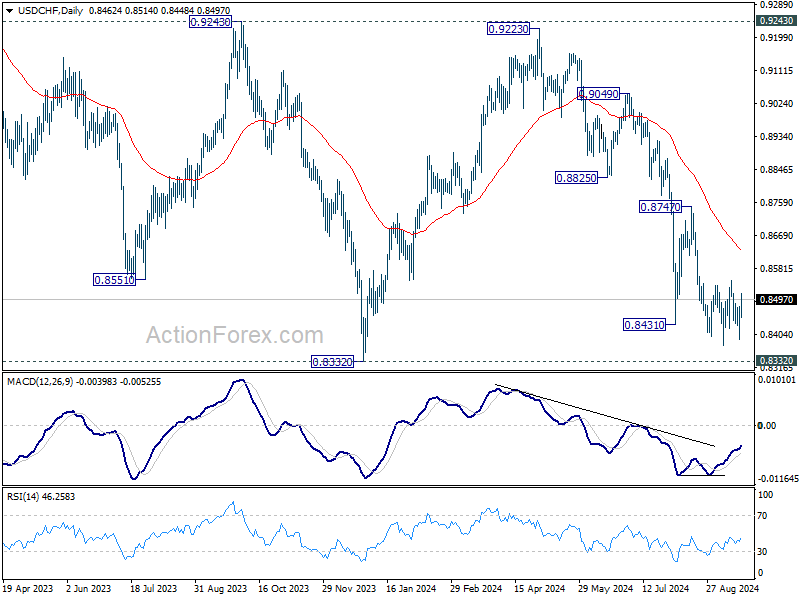
USD/CHF Mid-Day Outlook
Daily Pivots: (S1) 0.8409; (P) 0.8445; (R1) 0.8498; More…
Sideway trading continues in USD/CHF and intraday bias remains neutral. On the downside, break of 0.8374 will resume the fall from 0.9223 to retest 0.8332 low. Decisive break there will indicate larger down trend resumption. However, considering bullish convergence condition in 4H MACD, break of 0.8548 resistance will confirm short term bottoming, and turn bias back to the upside for 0.8747 resistance.
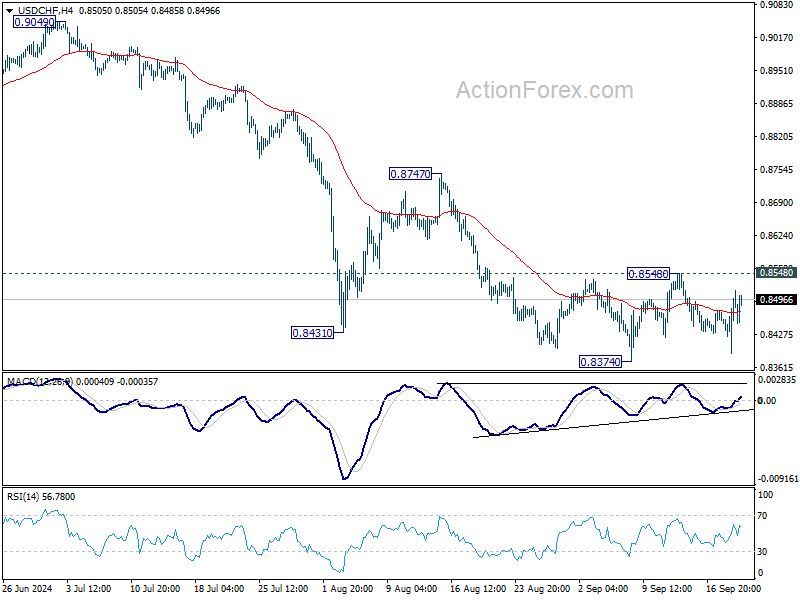
In the bigger picture, price actions from 0.8332 (2023 low) are currently seen as a medium term corrective pattern, with fall from 0.9223 as the second leg. Strong support could be seen from 0.8332 to bring rebound. Yet, overall outlook will continue to stay bearish as long as 0.9243 resistance holds. Firm break of 0.8332, however, will resume larger down trend from 1.0146 (2022 high).
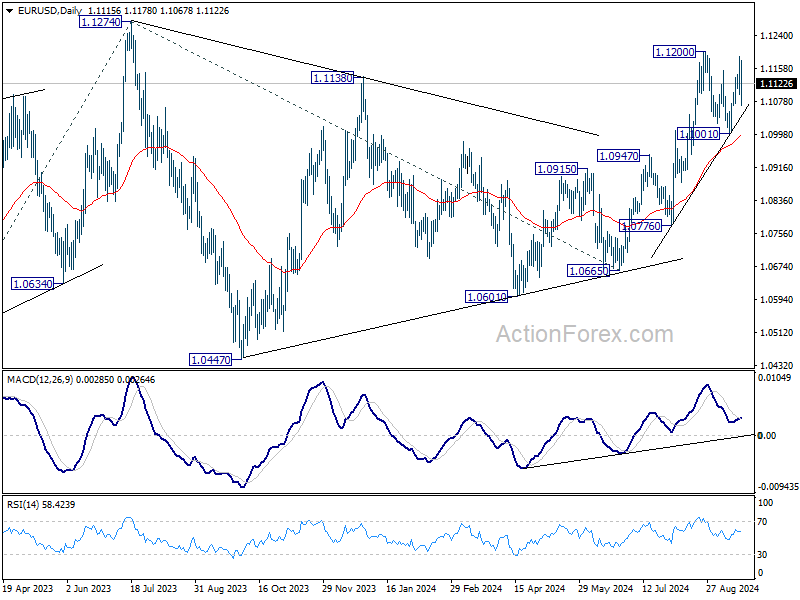
EUR/USD Mid-Day Outlook
Daily Pivots: (S1) 1.1080; (P) 1.1135; (R1) 1.1172; More....
Intraday bias in EUR/USD stays mildly on the upside at this point. Decisive break of 1.1200 will resume larger rally from 1.0665 to 1.1274 high next. On the downside, however, break of 1.1072 will turn bias back to the downside for 1.1001 support instead.
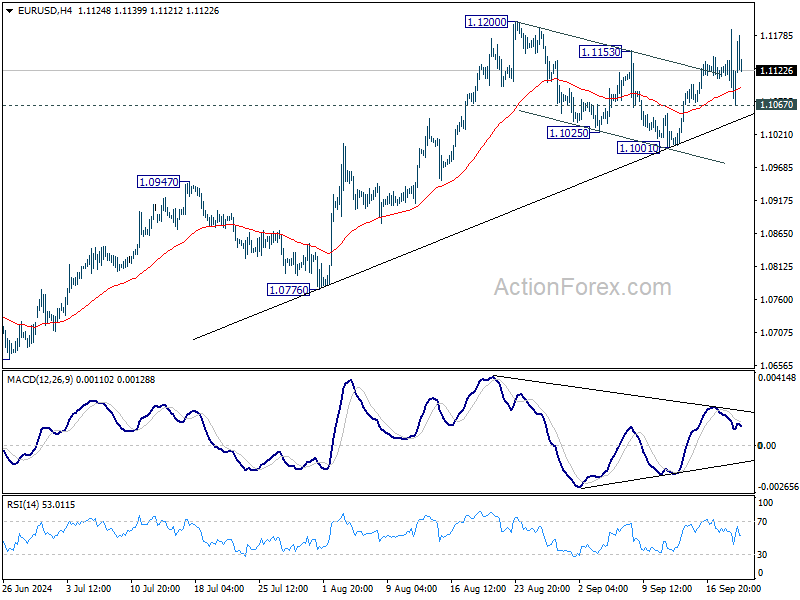
In the bigger picture, prior break of 1.1138 resistance indicates that corrective pattern from 1.1274 might have completed at 1.0665 already. Decisive break of 1.1274 (2023 high) will confirm whole up trend from 0.9534 (2022 low). Next target will be 61.8% projection of 0.9534 to 1.1274 from 1.0665 at 1.1740. This will now be the favored case as long as 1.0947 resistance turned support holds.
Bank of England Review – Gradual Easing Cycle Supports GBP
- At today's monetary policy meeting the BoE left the Bank Rate unchanged at 5.00% as widely expected.
- The BoE delivered a hawkish twist to its guidance emphasising their gradual approach to reducing the restrictiveness of monetary policy. We think this supports our base case of the next cut in November and a pause in December.
- Gilt yields tracked higher and EUR/GBP moved lower on the hawkish vote split and communication.
As expected, the Bank of England (BoE) decided to keep the Bank Rate unchanged at 5.00%. The vote split was 8-1 with the majority of members voting for an unchanged decision and dove Dhingra voting for a 25bp cut.
The BoE retained much of its previous guidance noting that "monetary policy will need to continue to remain restrictive for sufficiently long until the risks to inflation returning sustainably to the 2% target in the medium term have dissipated further" but added that "In the absence of material developments, a gradual approach to removing policy restraint remains appropriate". Combined with the vote split, this delivered a slight hawkish twist pushing back on market expectations of a cut at every meeting. While data on balance has been slightly better than expected compared to the August MPR, the BoE noted upside risks to pay growth. Likewise, the BoE noted that "Bank staff expected services inflation to ease slightly further in Q4", which at 5.6% y/y in August remains uncomfortably elevated.
We think the communication today further supports our call of a more gradual approach to a cutting cycle. We expect the next 25bp cut in November with the Bank Rate ending the year at 4.75%.
On QT, the MPC announced another GBP 100bn of quantitative tightening for the coming year starting October. Given the maturity profile, the largest part will stem from maturities (GBP 87bn) and to a much lesser extent from sales (GBP 13bn).
Rates. 2Y Gilt yields moved higher on the statement but overall, the reaction in rates markets was muted. Markets price 28bp for November and 14bp in December. We see it as more likely that the BoE will pause in December.
FX. EUR/GBP moved lower on the announcement following the slightly hawkish vote split and notion of a gradual cutting cycle. The guidance delivered today highlights the more cautious approach of the BoE, which supports our case of a continued move lower in EUR/GBP. This is further amplified by UK economic outperformance and tight credit spreads. The key risk is policy action from the BoE. We stay long GBP/CHF.
Our call. We expect the BoE to deliver the next 25bp cut in November and this to be the final cut this year, making it less than markets expect (42bp by YE 2024). In 2025, we expect cuts at every meeting starting in February and until H2 2025 where we expect a step Bank of England Review - Gradual easing cycle supports GBP Bank of England Review - Gradual easing cycle supports GBP down to a quarterly pace. This leaves the Bank Rate at 3.25% by YE 2025.
GBP/USD Mid-Day Outlook
Daily Pivots: (S1) 1.3145; (P) 1.3221; (R1) 1.3290; More...
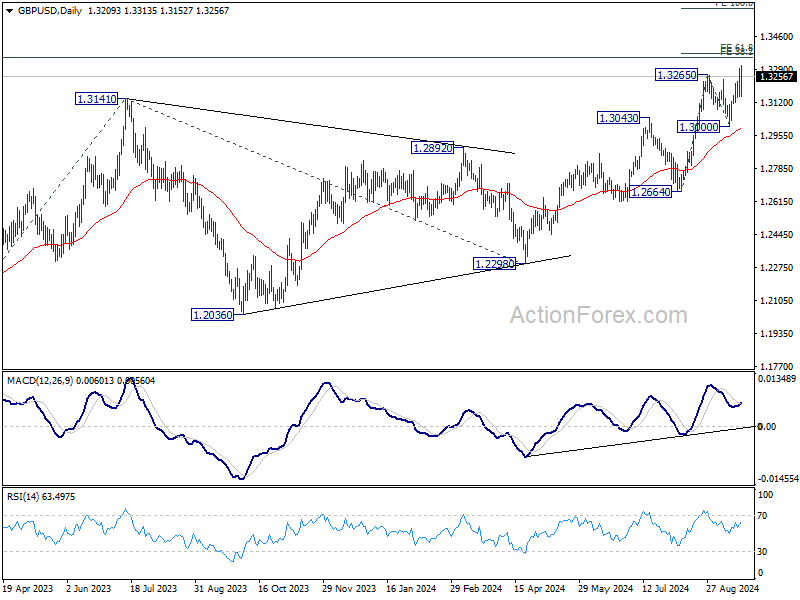
Intraday bias in GBP/USD remains on the upside at this point. Current rally should target 61.8% projection of 1.2664 to 1.3265 from 1.3000 at 1.3371 in the near term. Firm break there will pave the way to 100% projection at 1.3601 next. On the downside, however, break of 1.3145 support will turn bias to the downside for deeper pullback to 1.3000 support next.
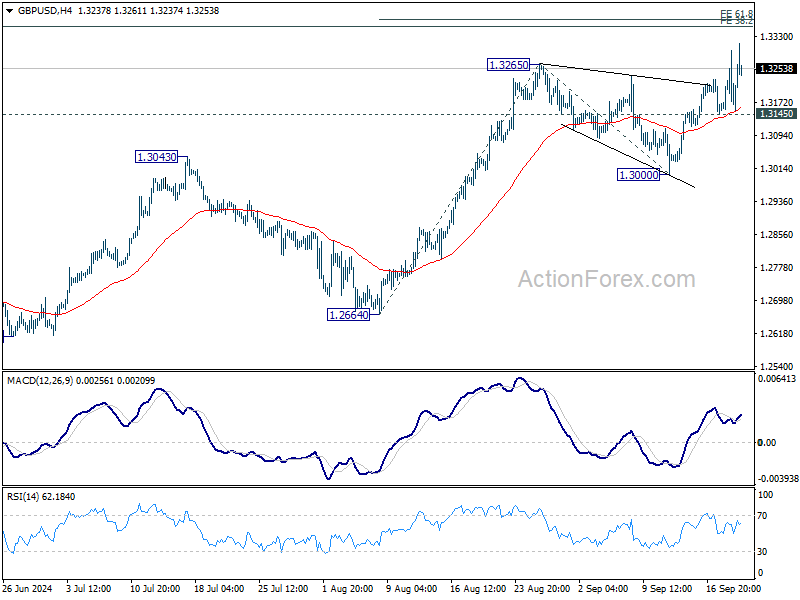
In the bigger picture, up trend from 1.0351 (2022 low) is in progress. Next target is 38.2% projection of 1.0351 to 1.3141 from 1.2298 at 1.3364. Sustained break there will target 61.8% projection at 1.4022. For now, outlook will stay bullish as long as 1.2664 support holds, even in case of deep pullback.
Sterling Gains on Cautious BoE, Investors Embrace Fed’s Message
Sterling surged notably today and reached its highest level against Dollar since March 2022. The move followed BoE's decision to hold interest rates steady as expected. The surprise came from Deputy Governor Dave Ramsden, who chose not to vote for a rate cut. The overall tone from BoE suggests that while further rate cuts are still on the horizon, they will likely proceed with caution. Concerns over persistently high inflation, especially in the services sector, remain a key issue for policymakers. For now, November is still seen as the most likely time for the next rate cut, but the path forward is far from set in stone.
Meanwhile, US markets seem to have come to terms with yesterday's 50 bps rate cut by Fed. Stock futures point to a sharp rally, with both DOW and S&P 500 poised to hit new all-time highs. At the same time, 10-year Treasury yields surged past 3.75%. Fed fund futures now price in a 67% chance of a smaller 25bps cut in November. The mix of rising stock prices, higher yields, and fed pricing reflects the market's confidence in Fed's strategy, with Jerome Powell having successfully conveyed that the aggressive rate cut was a preemptive measure rather than a panic reaction to economic weakness. Investors remain optimistic even with a gradual pace of easing moving forward.
Overall, Aussie and Kiwi have outpaced Sterling as the day's strongest performers so far, buoyed by risk-on sentiment. Aussie received additional support from strong employment data released earlier in the Asian session. Meanwhile, Yen and Swiss Franc are the weakest performers, reacting to the positive market sentiment and rising US and European yields. Dollar is also softening but cushioned by rising yields, while Euro and Canadian Dollar are in the middle of the pack.
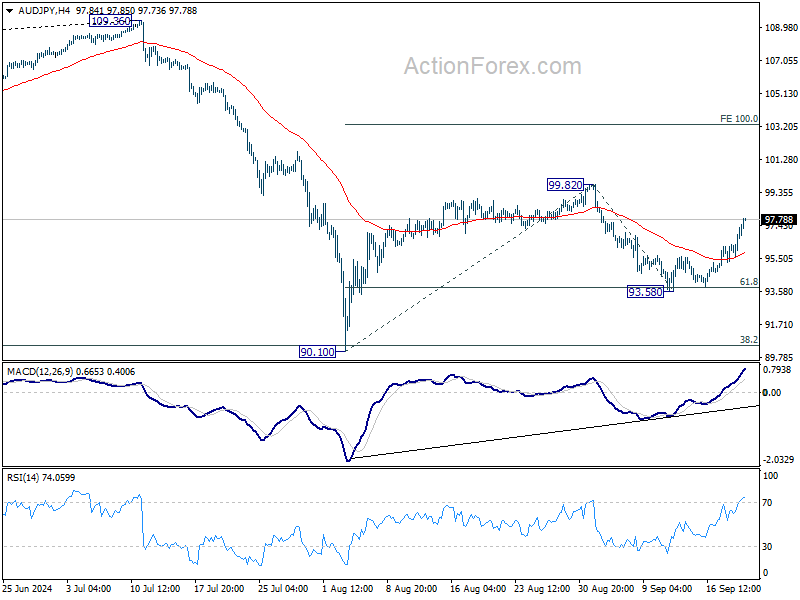
Technically, AUD/JPY is currently the top mover of the day, and the strong rally suggests that pull back from 99.82 has completed at 93.58 already, after drawing support from 61.8% retracement of 90.10 to 99.82. Further rise is now expected as long as 55 4H EMA holds (now at 95.88). Firm break of 99.82 will resume the whole rebound from 90.10. and target 100% projection of 90.10 to 99.82 from 93.58 at 103.30. Japan's CPI release and BoJ rate decision could both be the trigger of the next move.
In Europe at the time of writing, FTSE is up 0.98%. DAX is up 1.57%. CAC is up 1.95%. UK 10-year yield is up 0.050 at 3.896. Germany 10-year yield is up 0.005 at 2.202. Nikkei rose 2.13%. Hong Kong HSI rose 2.00%. China Shanghai SSE rose 0.69%. Singapore Strait Times rose 1.13%. Japan 10-year JGB yield rose 0.0268 to 0.854.
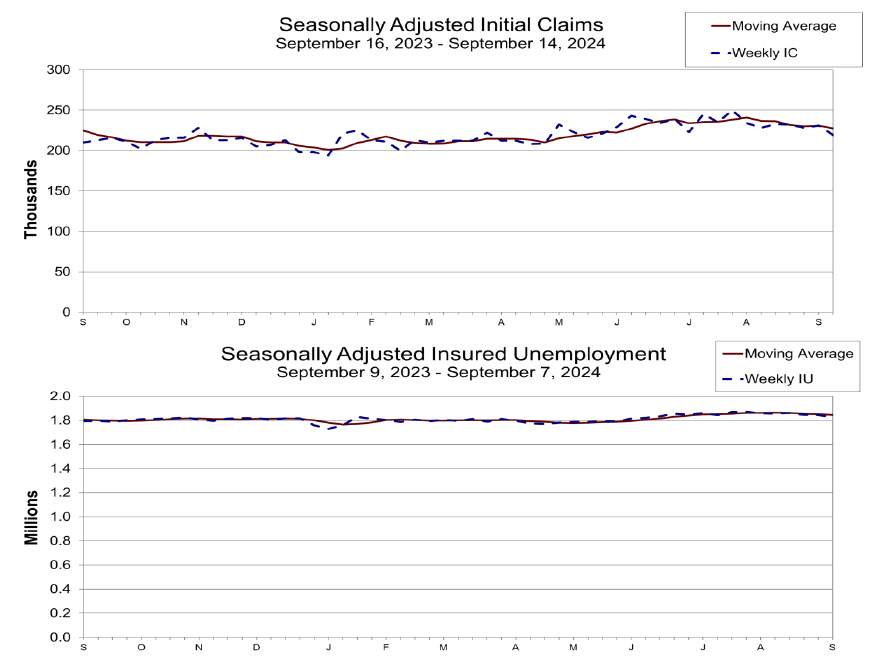
US jobless claims falls to 219k, vs exp 232k
US initial jobless claims fell -12k to 219k in the week ending September 14, below expectation of 232k. Four-week moving average of initial claims fell -3.5k to 227.5k.
Continuing claims fell -14k to 1829k in the week ending September 7. Four-week moving average of continuing claims fell -6.5k to 1844k.
BoE holds rates steady at 5% by hawkish 8-1 vote
BoE opted to keep the Bank Rate unchanged at 5.00%, as expected, with an 8-1 vote. Swati Dhingra, a known dove, was the only member voting for a 25bps rate cut. Deputy Governor Dave Ramsden, who has consistently supported cuts since May, chose not to vote for a reduction this time.
In its statement, BoE noted that UK economic indicators have shown "limited news" relative to expectations outlined in the August MPR. Inflation stood at 2.2% in August and is anticipated to rise to around 2.5% by year-end as the effects of last year's energy price declines drop out of the annual comparison. Services inflation remains notably elevated at 5.6%, while private sector wage growth slowed to 4.9% in the three months to July.
BoE emphasized that "absence of material developments", it will continue to follow a "gradual approach" to unwinding policy restrictions. Monetary policy is expected to stay restrictive for a sufficiently long period until inflation risks subside, ensuring it returns to the 2% target. The central bank reaffirmed its commitment to closely monitor inflation persistence and determine the necessary level of restrictiveness "at each meeting."
ECB's Schnabel: Sticky services inflation persists, wage growth expected to ease
In a speech today, ECB Executive Board member Isabel Schnabel noted the ongoing challenge of "sticky" services inflation, which continues to keep headline inflation elevated. She highlighted that price pressures within the services sector are "broad-based and global," and that the momentum remains high, well above levels that would be consistent with price stability. This persistent inflation in services is a key concern for the ECB's outlook.
However, there is some optimism regarding easing wage pressures. Schnabel pointed to expectations that wage growth will slow as the effects of past price shocks begin to fade. Additionally, firms are projecting moderation in selling price increases, as "profit margins buffer higher wages". She also noted that while demand for services has remained resilient, there are signs it is beginning to soften.
Schnabel also addressed the risks posed by geopolitical uncertainty, stating that it continues to be a significant factor influencing inflationary pressures. She cautioned that inflation perceptions remain high, which makes inflation expectations more "fragile to new shocks."
SECO: Swiss economic growth sluggish in 2024, moderate recovery expected in 2025
Switzerland's State Secretariat for Economic Affairs forecasts the economy to perform "considerably below average" in 2024, with modest growth expected to pick up in 2025. Adjusted for major sporting events, GDP growth is projected to be at 1.2% for 2024, unchanged from June's estimates. However, the outlook for 2025 has been slightly downgraded to 1.6%, compared to June forecast of 1.7%.
Inflation is now expected to decline faster than previously thought, with projections for 2024 revised down to 1.2% (from 1.4% in June) and 0.7% for 2025 (down from 1.1%). This easing of inflationary pressures reflects lower price growth, especially in sectors impacted by the strong appreciation of the Swiss Franc.
SECO acknowledged the challenges posed by sluggish economic activity in Europe, which, alongside the real appreciation of the Swiss Franc, is straining export-sensitive sectors in Switzerland this year. Looking ahead, gradual recovery in Europe is expected to support Swiss exports and boost investments in 2025, helping to stabilize growth across key sectors.
New Zealand GDP contracts - 0.2% qoq in Q2, manufacturing offers some resilience
New Zealand's GDP contracted by -0.2% qoq in Q2, slightly better than the expected -0.4% qoq decline. Despite the overall negative figure, 7 out of 16 industries posted increases, with manufacturing leading the growth.
GDP per capita also saw a decline, falling by -0.5%, marking the fourth consecutive quarter of contraction in this metric. The last time GDP per capita increased was back in Q3 2022.
On the expenditure side, GDP was flat for the quarter, showing no growth or contraction at 0.0%. Household spending, however, provided a small positive with a 0.4% increase. Real gross national disposable income was also flat at 0.0%, reflecting limited income growth in the face of economic headwinds.
Australia's employment grows 47.5k in Aug, labor market remains tight
Australia's employment grew by a robust 47.5k in August, significantly exceeding expectations of 25.3k. While full-time employment declined slightly by -3.1k, part-time jobs saw a sharp increase of 50.6k, boosting the overall figure. The employment-to-population ratio edged up by 0.1% to 64.3%, just shy of the record high of 64.4% set in November 2023.
Unemployment rate held steady at 4.2%, as anticipated, with the number of unemployed individuals falling by -10.5k, a -1.6% mom decline. Participation in the labor force remained strong, with the participation rate unchanged at 67.1%. Additionally, monthly hours worked rose by 0.4% mom, reflecting continued labor demand.
Kate Lamb, head of labor statistics at ABS, commented: "The employment and participation measures remain historically high, while unemployment and underemployment measures are still low, especially compared with what we saw before the pandemic. This suggests the labor market remains relatively tight."
GBP/USD Mid-Day Outlook
Daily Pivots: (S1) 1.3145; (P) 1.3221; (R1) 1.3290; More...
Intraday bias in GBP/USD remains on the upside at this point. Current rally should target 61.8% projection of 1.2664 to 1.3265 from 1.3000 at 1.3371 in the near term. Firm break there will pave the way to 100% projection at 1.3601 next. On the downside, however, break of 1.3145 support will turn bias to the downside for deeper pullback to 1.3000 support next.
In the bigger picture, up trend from 1.0351 (2022 low) is in progress. Next target is 38.2% projection of 1.0351 to 1.3141 from 1.2298 at 1.3364. Sustained break there will target 61.8% projection at 1.4022. For now, outlook will stay bullish as long as 1.2664 support holds, even in case of deep pullback.
Economic Indicators Update
| GMT | CCY | EVENTS | ACT | F/C | PP | REV |
|---|---|---|---|---|---|---|
| 22:45 | NZD | GDP Q/Q Q2 | -0.20% | -0.40% | 0.20% | 0.10% |
| 01:30 | AUD | Employment Change Aug | 47.5K | 25.3K | 58.2K | 48.9K |
| 01:30 | AUD | Unemployment Rate Aug | 4.20% | 4.20% | 4.20% | |
| 06:00 | CHF | Trade Balance (CHF) Aug | 4.58B | 5.05B | 4.89B | 4.88B |
| 07:00 | CHF | SECO Economic Forecasts | ||||
| 08:00 | EUR | Eurozone Current Account (EUR) Jul | 39.6B | 40.3B | 50.5B | |
| 11:00 | GBP | BoE Interest Rate Decision | 5.00% | 5.00% | 5.00% | |
| 11:00 | GBP | MPC Official Bank Rate Votes | 0--1--8 | 0--2--7 | 0--5--4 | |
| 12:30 | USD | Initial Jobless Claims (Sep 13) | 219K | 232K | 230K | 231K |
| 12:30 | USD | Philadelphia Fed Manufacturing Survey Sep | 1.7 | 2.4 | -7 | |
| 12:30 | USD | Current Account (USD) Q2 | -266.8B | -260B | -238B | -241B |
| 14:00 | USD | Existing Home Sales Aug | 3.85M | 3.95M | ||
| 14:30 | USD | Natural Gas Storage | 53B | 40B |
US jobless claims falls to 219k, vs exp 232k
US initial jobless claims fell -12k to 219k in the week ending September 14, below expectation of 232k. Four-week moving average of initial claims fell -3.5k to 227.5k.
Continuing claims fell -14k to 1829k in the week ending September 7. Four-week moving average of continuing claims fell -6.5k to 1844k.