
Sample Category Title
EUR/USD Daily Outlook
Daily Pivots: (S1) 1.1080; (P) 1.1135; (R1) 1.1172; More....
Intraday bias in EUR/USD is now on the upside with breach of 1.1153 resistance. Firm break of 1.1200 will resume larger rally from 1.0665 to 1.1274 high next. On the downside, however, break of 1.1072 will turn bias back to the downside for 1.1001 support instead.
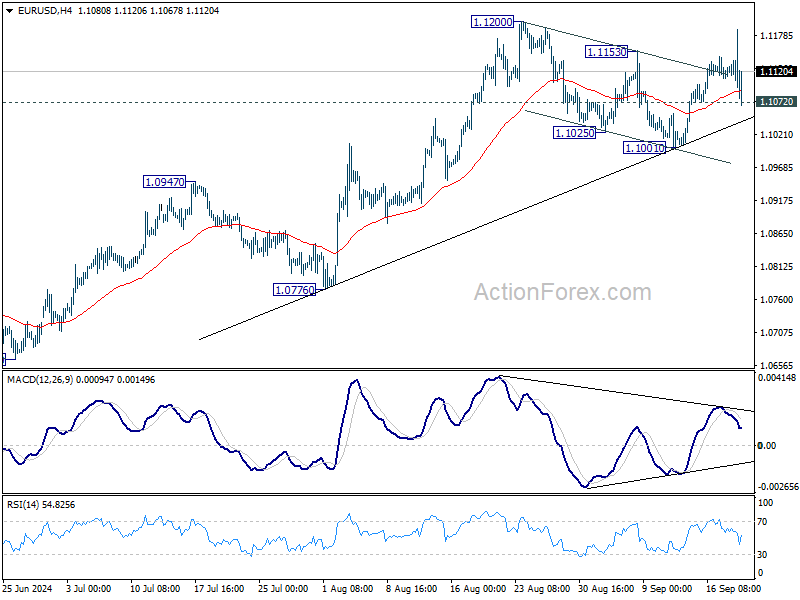
In the bigger picture, prior break of 1.1138 resistance indicates that corrective pattern from 1.1274 might have completed at 1.0665 already. Decisive break of 1.1274 (2023 high) will confirm whole up trend from 0.9534 (2022 low). Next target will be 61.8% projection of 0.9534 to 1.1274 from 1.0665 at 1.1740. This will now be the favored case as long as 1.0947 resistance turned support holds.
GBP/USD Daily Outlook
Daily Pivots: (S1) 1.3145; (P) 1.3221; (R1) 1.3290; More...
GBP/USD's breach of 1.3265 resistance suggests that larger rally is resuming. Intraday bias is mildly on the upside at this point, and further rise should be seen to 1.3364 projection level next. On the downside, however, break of 1.3145 support will turn bias to the downside for deeper pullback to 1.3000 support next.
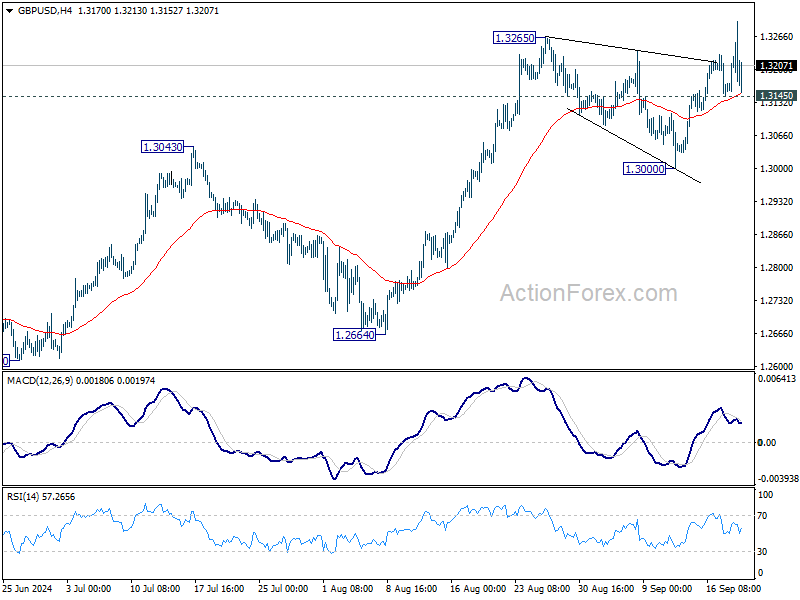
In the bigger picture, up trend from 1.0351 (2022 low) is in progress. Next target is 38.2% projection of 1.0351 to 1.3141 from 1.2298 at 1.3364. For now, outlook will stay bullish as long as 1.2664 support holds, even in case of deep pullback.
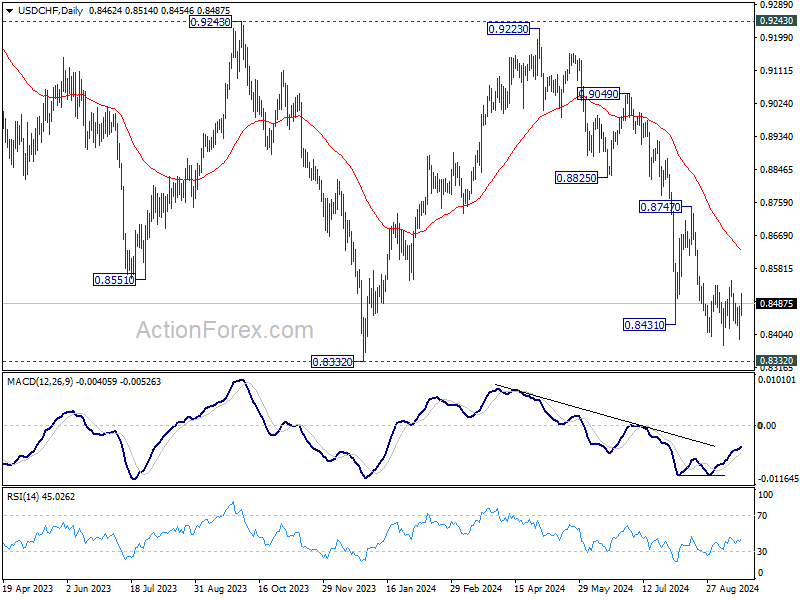
USD/CHF Daily Outlook
Daily Pivots: (S1) 0.8409; (P) 0.8445; (R1) 0.8498; More…
No change in USD/CHF's outlook as it's still bounded in range of 0.8374/8548. Intraday bias remains neutral for the moment. With 0.8548 resistance intact, further decline is still expected. On the downside, break of 0.8374 will resume the fall from 0.9223 to retest 0.8332 low. Decisive break there will indicate larger down trend resumption. However, considering bullish convergence condition in 4H MACD, break of 0.8548 resistance will confirm short term bottoming, and turn bias back to the upside for 0.8747 resistance.
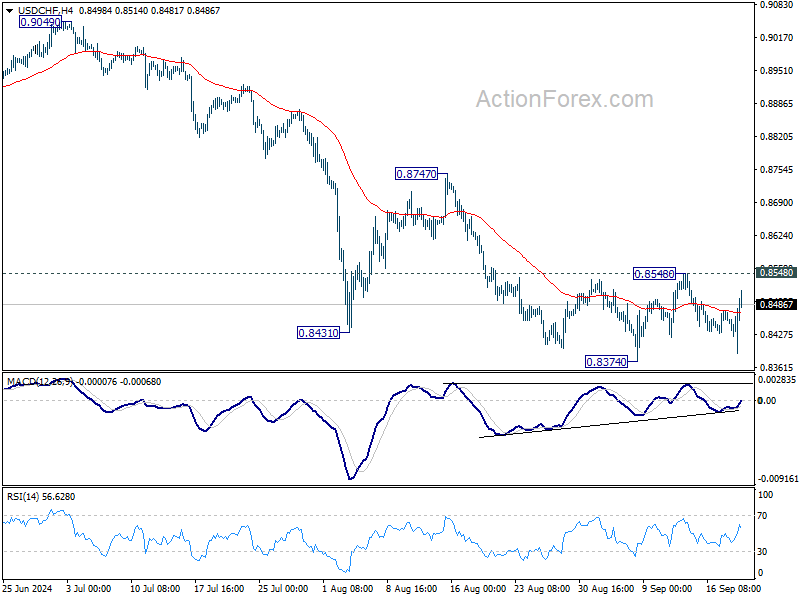
In the bigger picture, price actions from 0.8332 (2023 low) are currently seen as a medium term corrective pattern, with fall from 0.9223 as the second leg. Strong support could be seen from 0.8332 to bring rebound. Yet, overall outlook will continue to stay bearish as long as 0.9243 resistance holds. Firm break of 0.8332, however, will resume larger down trend from 1.0146 (2022 high).
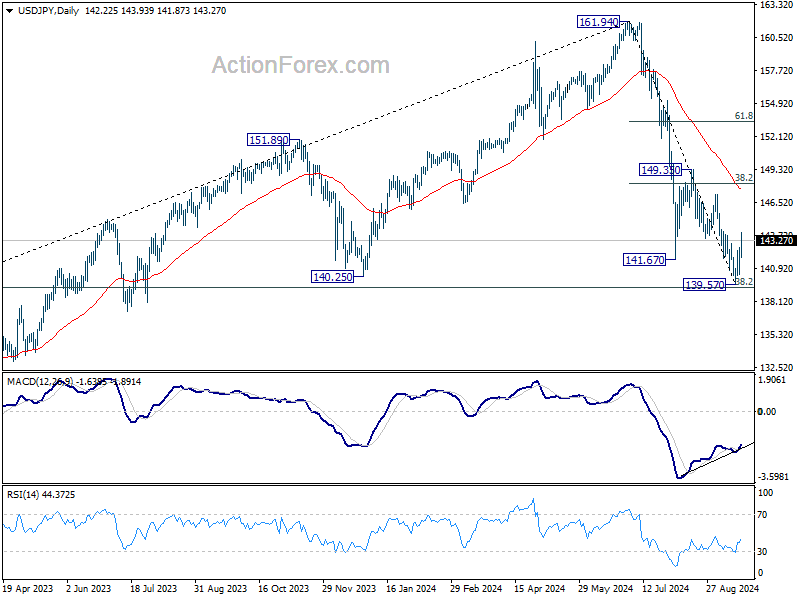
USD/JPY Daily Outlook
Daily Pivots: (S1) 140.89; (P) 141.80; (R1) 143.16; More...
USD/JPY's break of 143.03 resistance suggests short term bottoming at 139.57, on bullish convergence condition in 4H MACD. That also came just ahead of 139.26 fibonacci level. Intraday bias is back on the upside for stronger rebound to 55 D EMA (now at 147.58), and possibly further to 38.2% retracement of 161.94 to 139.57 at 148.11.
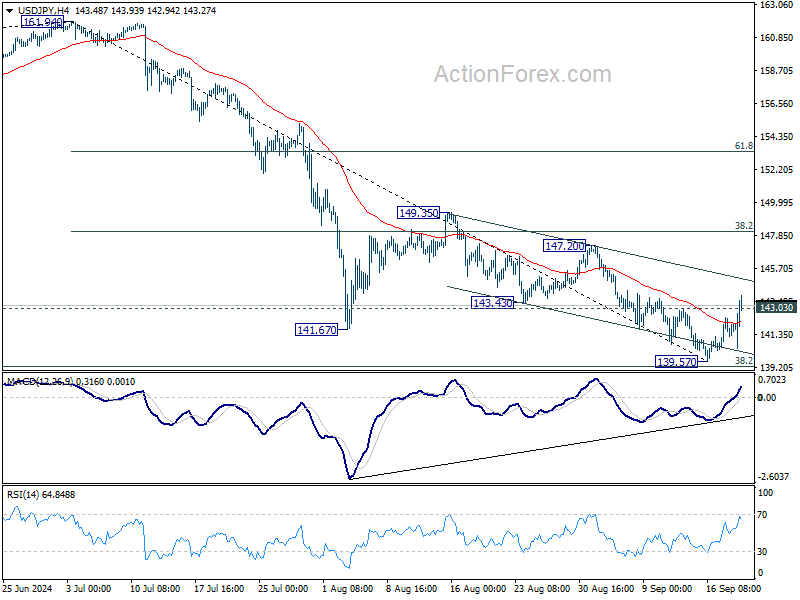
In the bigger picture, fall from 161.94 medium term top is seen as correcting whole up trend from 102.58 (2021 low). Strong support could be seen from 38.2% retracement of 102.58 to 161.94 at 139.26 to contain downside, at least on first attempt. But in any case, risk will stay on the downside as long as 149.35 resistance holds. Sustained break of 139.26 would open up deeper medium term decline to 61.8% retracement at 125.25.
No Fireworks After Fed Cut, Attention Turns to BoE
Market reactions were indecisive after Fed's much-anticipated rate cut overnight. The initial optimism that sparked a rally in US stocks quickly fizzled out, with major indexes closing in the red, while Treasury yields staged a recovery.
The reaction was somewhat anticlimactic but understandable given the unusually high level of uncertainty surrounding this FOMC meeting. In hindsight, the market was prepared for unpredictability, making any actual surprise less impactful.
Dollar rebounded following an initial selloff, but failed to carry momentum into Asian session. The greenback remains capped below resistance levels across major currency pairs, with the exception of Yen. As such, risk remains to the downside for Dollar in the near term.
The spotlight is now on BoE's rate decision today, with markets broadly expecting the central bank to keep its Bank Rate unchanged at 5.00%. This move comes after a closely contested 5-4 vote in August where rates were cut from a 16-year high.
The expectation now is that the MPC will return to a 7-2 split, favoring a rate hold. However, should more members advocate for another cut, this could increase the likelihood of further reductions in November.
So far this week, Aussie has been the best-performing currency, additionally supported by strong employment data released today. Kiwi is close behind, while Sterling also ranks as one of the top performers as it gears up for BoE decision. On the other end of the spectrum, Yen has been the weakest performer, reacting negatively to the recovery in Treasury yields. Loonie is also struggling, and Dollar is following suit, while Euro and Swiss Franc are trading mixed in the middle.
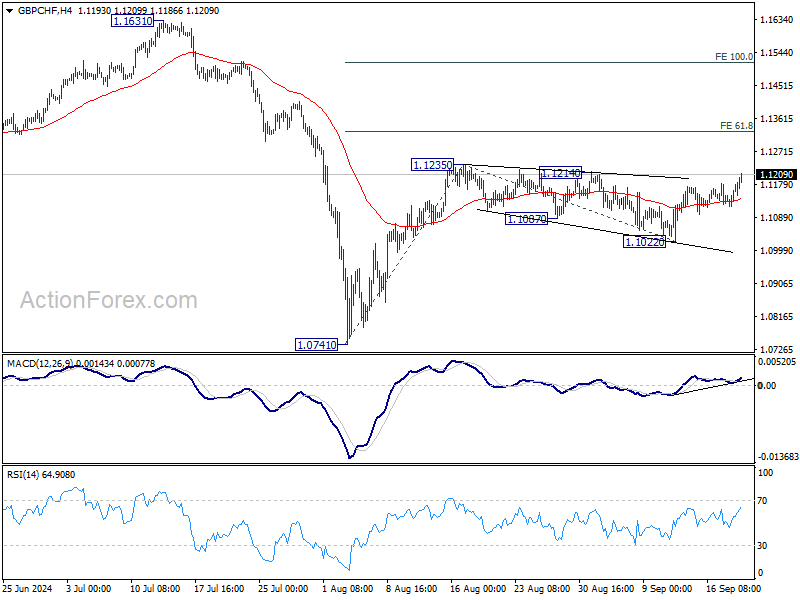
Technically, EUR/GBP has made some progress yesterday by breaking 0.8417 might support. Further break of 0.8399 will argue that larger down trend might be ready to resume through 0.8382 low. At the same time, GBP/CHF's rebound from 1.1022 resumed after drawing support from 55 4H EMA. Immediate focus is now on 1.1235 resistance. Decisive break there will resume the rally from 1.0741 to 61.8% projection of 1.0741 to 1.1235 from 1.1022 at 1.1327, and possibly further to 100% projection at 1.1516. The moves in EUR/GBP and GBP/CHF could reinforce each other.
In Asia, at the time of writing, Nikkei is up 2.48%. Hong Kong HSI is up 1.81%. China Shanghai SSE is up 0.59%. Singapore Strait Times is up 0.72%. Japan 10-year JGB yield is up 0.0230 at 0.850. Overnight, DOW fell -0.25%. S&P 500 fell -0.29%. NASDAQ fell -031%. 10-year yield rose 0.0430 to 3.865.
Stocks end in red as Fed's 50bps cut seen as catch-up, not new pace
Despite initial rally, major US stock indexes closed lower after Fed officially began its policy easing cycle with a 50bps rate cut, bringing the target range to 4.75-5.00%. While some may attribute the late selloff to the classic "buy the rumor, sell the fact" dynamic, Fed Chair Jerome Powell's press conference and the new economic projections pointed to a more cautious pace ahead. These suggested that Fed's bold move was more about catching up from July's inaction rather than setting an aggressive pace for future cuts.
Powell acknowledged that Fed "might well have" started lowering rates back in July if the employment data had been available earlier. He emphasized that the 50bps cut was "a sign of our commitment not to get behind" the curve in normalizing rates, calling it "a strong move." Additionally, he was quick to clarify that this cut is not indicative of a "new pace," stating, "The economy can develop in a way that would cause us to go faster or slower."
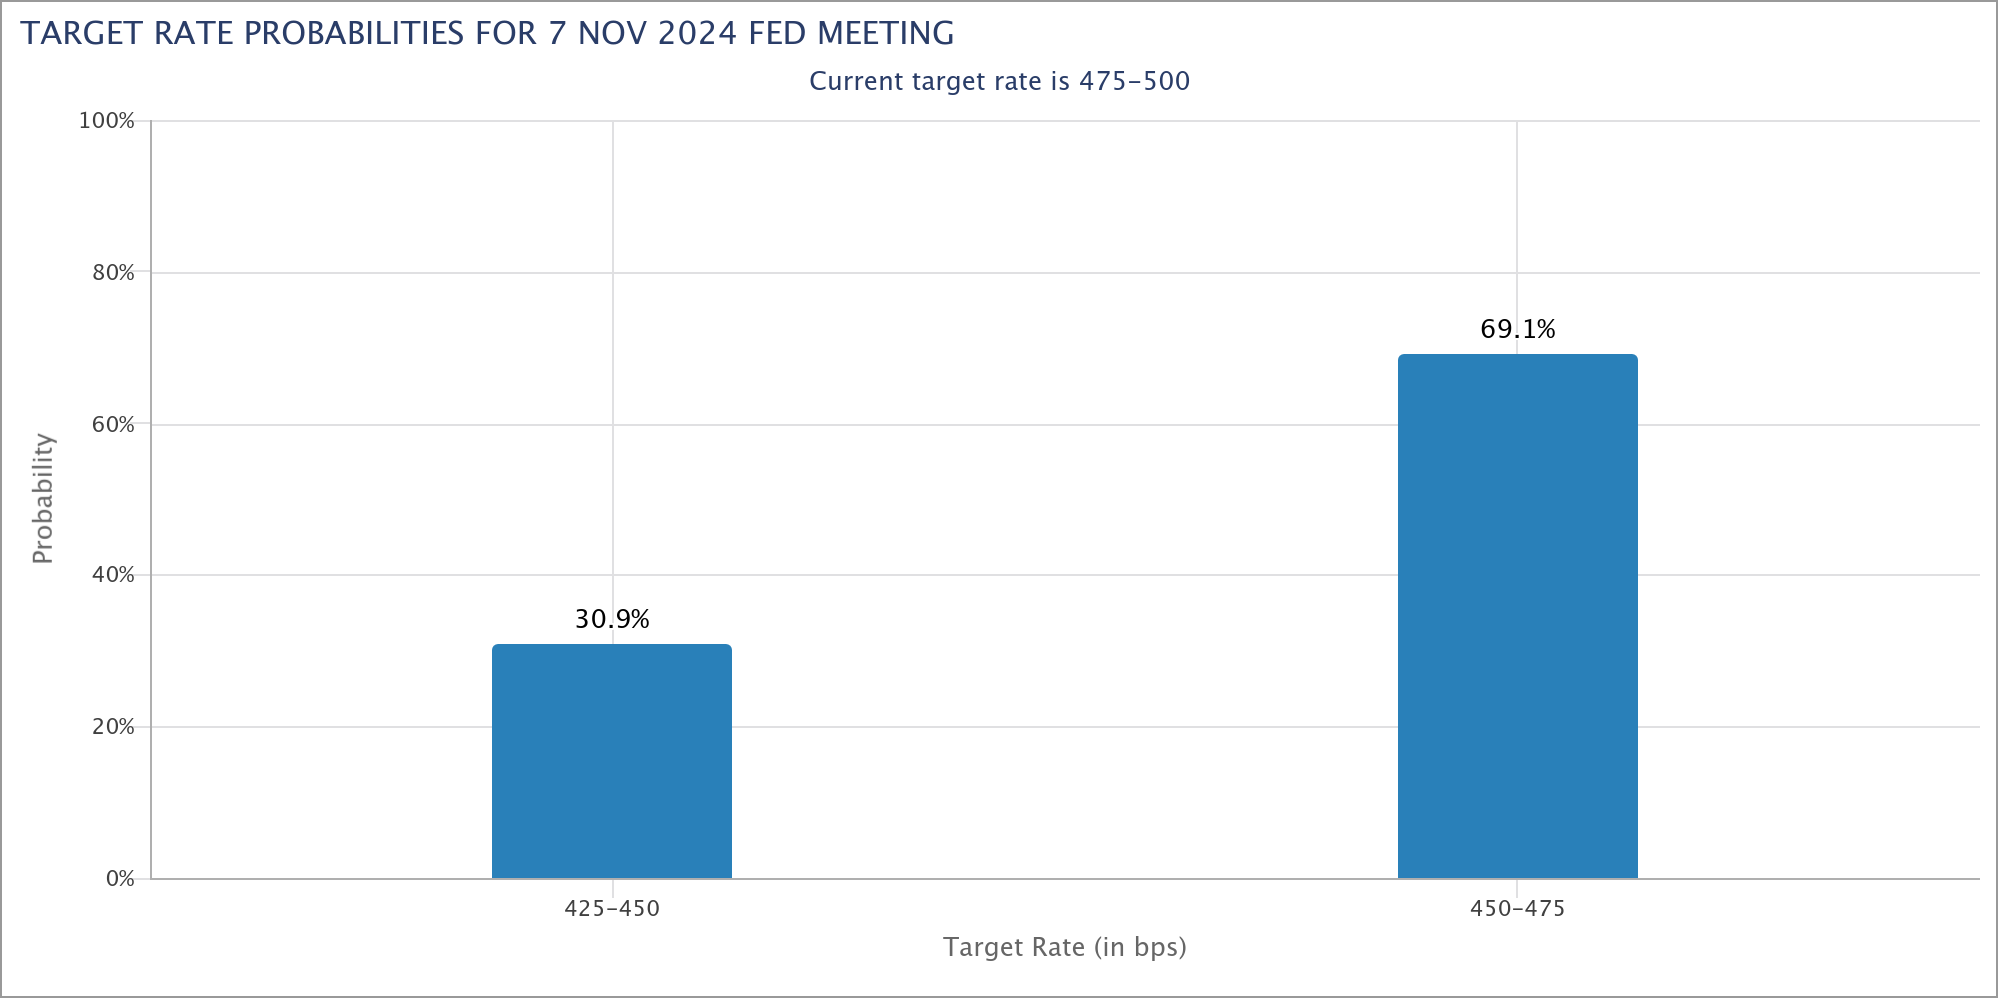
The updated dot plot also revealed a divided Fed. Of the 19 participants, 10 penciled in another 50bps cut by year-end, bringing rates down to 4.25-4.50%, while 9 saw only a 25bps cut to 4.50-4.75%. This suggests Fed would revert to smaller cuts in the coming months, with November likely seeing a 25bps reduction, followed by another 25bps cut in December, or even a few cuts if inflation risks persist.
This sentiment is reflected in market pricing, with fed funds futures currently indicating around 70% chance of a 25bps cut in November and 30% chance of a larger 50bps move.
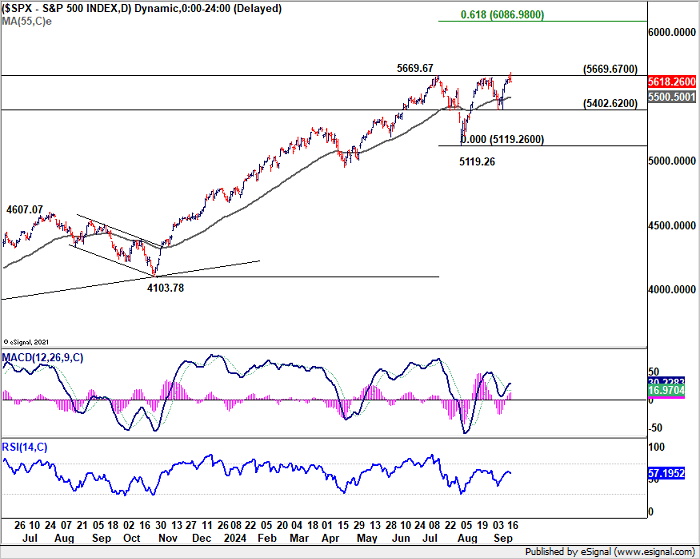
Technically, while S&P 500 struggled to sustain above 5669.67 key resistance, and some retreat might be seen in the near term, outlook will stay bullish as long as 5402.62 support holds. Sustained trading above 5669.67 will extend the long term up trend to 61.8% projection of 4103.78 to 5669.67 from 5119.26 at 6086.98 later in the year.
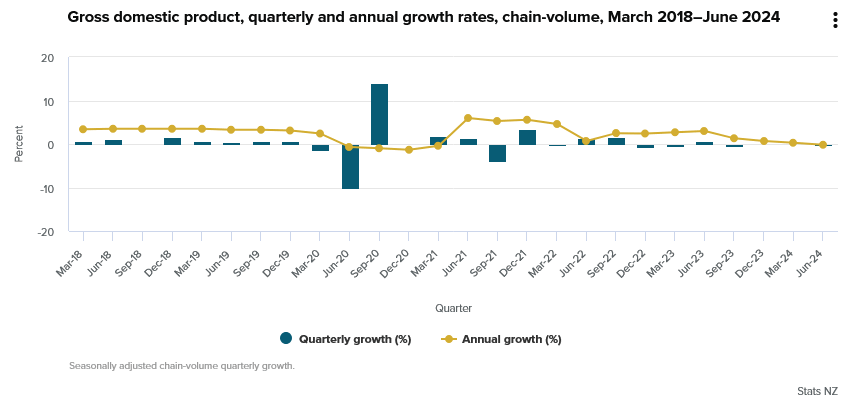
New Zealand GDP contracts - 0.2% qoq in Q2, manufacturing offers some resilience
New Zealand's GDP contracted by -0.2% qoq in Q2, slightly better than the expected -0.4% qoq decline. Despite the overall negative figure, 7 out of 16 industries posted increases, with manufacturing leading the growth.
GDP per capita also saw a decline, falling by -0.5%, marking the fourth consecutive quarter of contraction in this metric. The last time GDP per capita increased was back in Q3 2022.
On the expenditure side, GDP was flat for the quarter, showing no growth or contraction at 0.0%. Household spending, however, provided a small positive with a 0.4% increase. Real gross national disposable income was also flat at 0.0%, reflecting limited income growth in the face of economic headwinds.
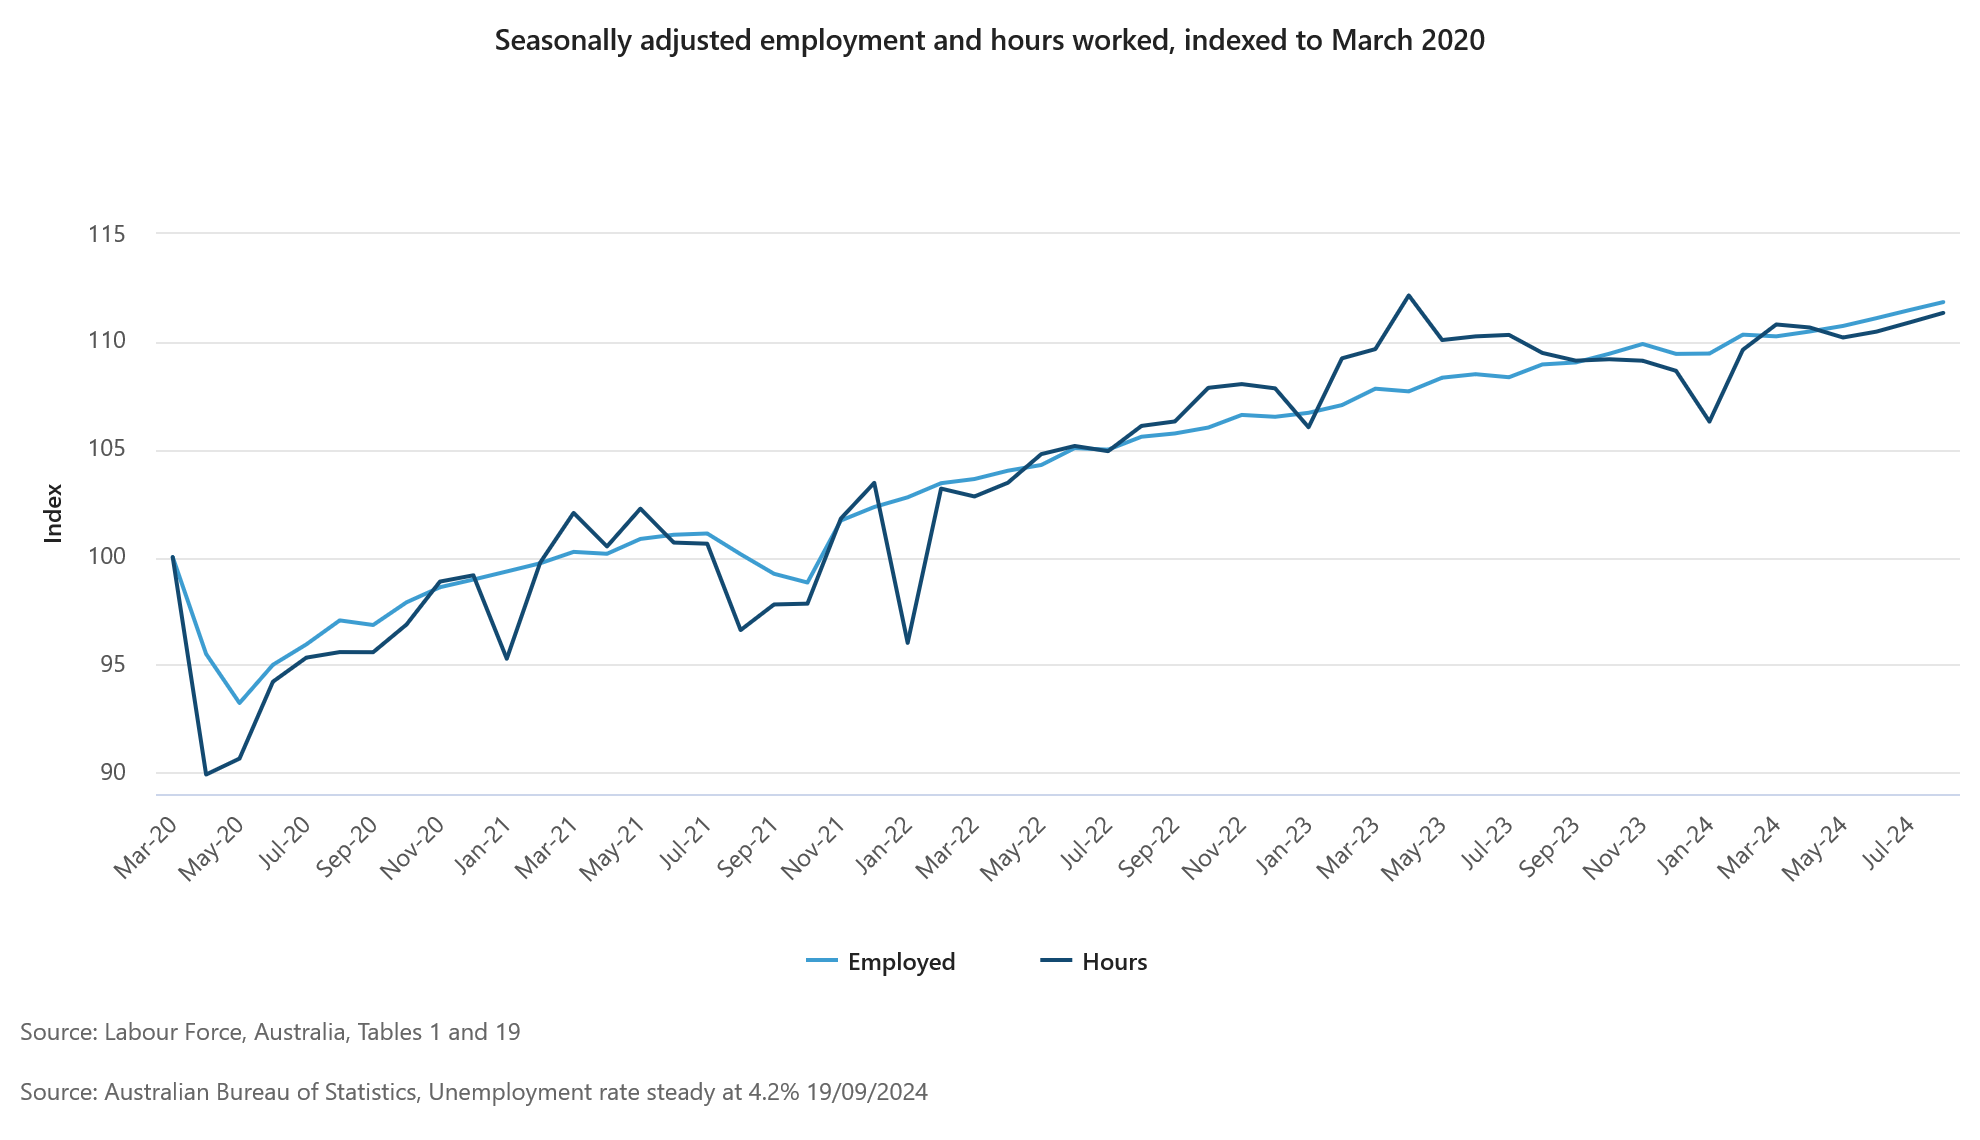
Australia's employment grows 47.5k in Aug, labor market remains tight
Australia's employment grew by a robust 47.5k in August, significantly exceeding expectations of 25.3k. While full-time employment declined slightly by -3.1k, part-time jobs saw a sharp increase of 50.6k, boosting the overall figure. The employment-to-population ratio edged up by 0.1% to 64.3%, just shy of the record high of 64.4% set in November 2023.
Unemployment rate held steady at 4.2%, as anticipated, with the number of unemployed individuals falling by -10.5k, a -1.6% mom decline. Participation in the labor force remained strong, with the participation rate unchanged at 67.1%. Additionally, monthly hours worked rose by 0.4% mom, reflecting continued labor demand.
Kate Lamb, head of labor statistics at ABS, commented: "The employment and participation measures remain historically high, while unemployment and underemployment measures are still low, especially compared with what we saw before the pandemic. This suggests the labor market remains relatively tight."
USD/JPY Daily Outlook
Daily Pivots: (S1) 140.89; (P) 141.80; (R1) 143.16; More...
USD/JPY's break of 143.03 resistance suggests short term bottoming at 139.57, on bullish convergence condition in 4H MACD. That also came just ahead of 139.26 fibonacci level. Intraday bias is back on the upside for stronger rebound to 55 D EMA (now at 147.58), and possibly further to 38.2% retracement of 161.94 to 139.57 at 148.11.
In the bigger picture, fall from 161.94 medium term top is seen as correcting whole up trend from 102.58 (2021 low). Strong support could be seen from 38.2% retracement of 102.58 to 161.94 at 139.26 to contain downside, at least on first attempt. But in any case, risk will stay on the downside as long as 149.35 resistance holds. Sustained break of 139.26 would open up deeper medium term decline to 61.8% retracement at 125.25.
Economic Indicators Update
| GMT | CCY | EVENTS | ACT | F/C | PP | REV |
|---|---|---|---|---|---|---|
| 22:45 | NZD | GDP Q/Q Q2 | -0.20% | -0.40% | 0.20% | 0.10% |
| 01:30 | AUD | Employment Change Aug | 47.5K | 25.3K | 58.2K | 48.9K |
| 01:30 | AUD | Unemployment Rate Aug | 4.20% | 4.20% | 4.20% | |
| 06:00 | CHF | Trade Balance (CHF) Aug | 5.05B | 4.89B | ||
| 07:00 | CHF | SECO Economic Forecasts | ||||
| 08:00 | EUR | Eurozone Current Account (EUR) Jul | 40.3B | 50.5B | ||
| 11:00 | GBP | BoE Interest Rate Decision | 5.00% | 5.00% | ||
| 11:00 | GBP | MPC Official Bank Rate Votes | 0--2--7 | 0--5--4 | ||
| 12:30 | USD | Initial Jobless Claims (Sep 13) | 232K | 230K | ||
| 12:30 | USD | Philadelphia Fed Manufacturing Survey Sep | 2.4 | -7 | ||
| 12:30 | USD | Current Account (USD) Q2 | -260B | -238B | ||
| 14:00 | USD | Existing Home Sales Aug | 3.85M | 3.95M | ||
| 14:30 | USD | Natural Gas Storage | 53B | 40B |
Australia’s employment grows 47.5k in Aug, labor market remains tight
Australia's employment grew by a robust 47.5k in August, significantly exceeding expectations of 25.3k. While full-time employment declined slightly by -3.1k, part-time jobs saw a sharp increase of 50.6k, boosting the overall figure. The employment-to-population ratio edged up by 0.1% to 64.3%, just shy of the record high of 64.4% set in November 2023.
Unemployment rate held steady at 4.2%, as anticipated, with the number of unemployed individuals falling by -10.5k, a -1.6% mom decline. Participation in the labor force remained strong, with the participation rate unchanged at 67.1%. Additionally, monthly hours worked rose by 0.4% mom, reflecting continued labor demand.
Kate Lamb, head of labor statistics at ABS, commented: "The employment and participation measures remain historically high, while unemployment and underemployment measures are still low, especially compared with what we saw before the pandemic. This suggests the labor market remains relatively tight."
New Zealand GDP contracts – 0.2% qoq in Q2, manufacturing offers some resilience
New Zealand’s GDP contracted by -0.2% qoq in Q2, slightly better than the expected -0.4% qoq decline. Despite the overall negative figure, 7 out of 16 industries posted increases, with manufacturing leading the growth.
GDP per capita also saw a decline, falling by -0.5%, marking the fourth consecutive quarter of contraction in this metric. The last time GDP per capita increased was back in Q3 2022.
On the expenditure side, GDP was flat for the quarter, showing no growth or contraction at 0.0%. Household spending, however, provided a small positive with a 0.4% increase. Real gross national disposable income was also flat at 0.0%, reflecting limited income growth in the face of economic headwinds.
USD/CAD Eyes Additional Gains, Fed Slashes Rates By 0.5%
Key Highlights
- USD/CAD started a decent increase above the 1.3500 resistance.
- A key bullish trend line is forming with support at 1.3550 on the 4-hour chart.
- GBP/USD remained in a bullish zone above the 1.3150 level.
- The Fed reduced interest rates from 5.50% to 5.00%.
USD/CAD Technical Analysis
The US Dollar found support near the 1.3440 zone against the Canadian Dollar. USD/USD started a decent increase above the 1.3500 resistance zone.
Looking at the 4-hour chart, the pair climbed above the 23.6% Fib retracement level of the downward move from the 1.3946 swing high to the 1.3437 low. The pair even cleared the 100 simple moving average (red, 4-hour), but it stayed below the 200 simple moving average (green, 4-hour).
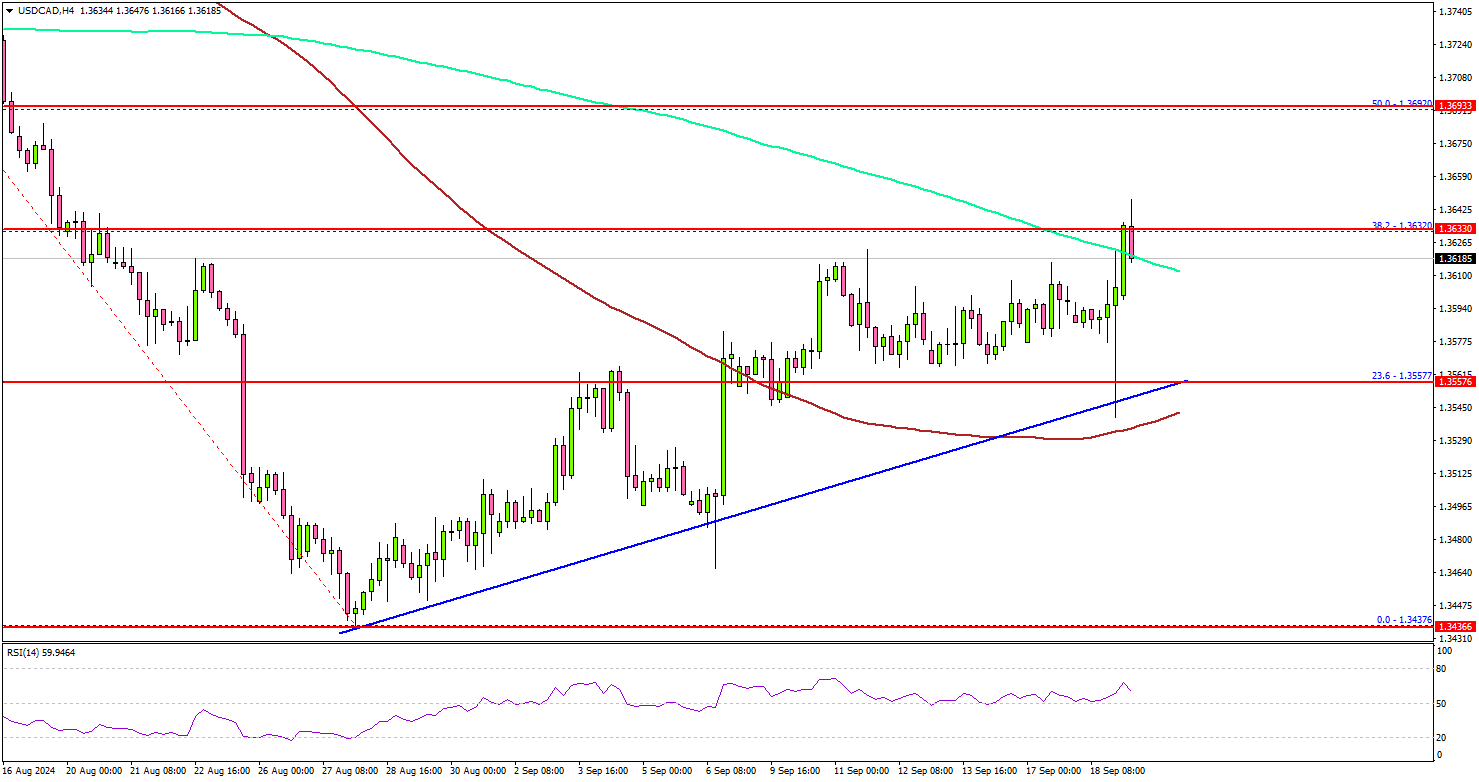
It seems like the pair is now facing hurdles near 1.3620, the 200 simple moving average (green, 4-hour), and the 38.2% Fib retracement level of the downward move from the 1.3946 swing high to the 1.3437 low.
A clear move above the 1.3620 zone might set the pace for a move toward 1.3700. Any more gains might call for a test of the 1.3750 zone.
On the downside, immediate support sits near the 1.3550 level. There is also a key bullish trend line forming with support at 1.3550 on the same chart, below which the pair might test the 100 simple moving average (red, 4-hour).
The next key support sits near the 1.3500 level, below which the pair could dive toward the 1.3440 support zone or the last swing low.
Looking at GBP/USD, the pair remained stable above 1.3150, spiked higher after the UK CPI release, and might aim for more upsides in the near term.
Upcoming Economic Events:
- US Existing Home Sales for August 2024 (MoM) - Forecast -0.1%, versus +1.3% previous.
- US Initial Jobless Claims - Forecast 230K, versus 230K previous.
Stocks end in red as Fed’s 50bps cut seen as catch-up, not new pace
Despite initial rally, major US stock indexes closed lower after Fed officially began its policy easing cycle with a 50bps rate cut, bringing the target range to 4.75-5.00%. While some may attribute the late selloff to the classic “buy the rumor, sell the fact” dynamic, Fed Chair Jerome Powell’s press conference and the new economic projections pointed to a more cautious pace ahead. These suggested that Fed's bold move was more about catching up from July's inaction rather than setting an aggressive pace for future cuts.
Powell acknowledged that Fed "might well have" started lowering rates back in July if the employment data had been available earlier. He emphasized that the 50bps cut was “a sign of our commitment not to get behind” the curve in normalizing rates, calling it “a strong move.” Additionally, he was quick to clarify that this cut is not indicative of a "new pace," stating, “The economy can develop in a way that would cause us to go faster or slower.”
The updated dot plot also revealed a divided Fed. Of the 19 participants, 10 penciled in another 50bps cut by year-end, bringing rates down to 4.25-4.50%, while 9 saw only a 25bps cut to 4.50-4.75%. This suggests Fed would revert to smaller cuts in the coming months, with November likely seeing a 25bps reduction, followed by another 25bps cut in December, or even a few cuts if inflation risks persist.
This sentiment is reflected in market pricing, with fed funds futures currently indicating around 70% chance of a 25bps cut in November and 30% chance of a larger 50bps move.
Technically, while S&P 500 struggled to sustain above 5669.67 key resistance, and some retreat might be seen in the near term, outlook will stay bullish as long as 5402.62 support holds. Sustained trading above 5669.67 will extend the long term up trend to 61.8% projection of 4103.78 to 5669.67 from 5119.26 at 6086.98 later in the year.
NZ First Impressions: GDP, June Quarter 2024
New Zealand’s GDP fell by 0.2% in the June quarter. The result wasn’t as weak as expected, and will ease concerns that the economy might have been taking a turn for the worse.
Key results
- Quarterly change: -0.2% (last: +0.1%, Westpac f/c: -0.4%, market f/c: -0.4%, RBNZ -0.5%)
- Annual change: -0.5% (Last +0.3%, Westpac f/c -0.6%, RBNZ -0.7%)
The New Zealand economy shrank by 0.2% in the June quarter. Estimated growth in the March quarter was trimmed back to a 0.1% rise (previously estimated to be up 0.2%), and there were modest revisions to earlier quarters that largely balanced out.
The 0.2% fall in production GDP was smaller than the 0.4% fall that we and the market were forecasting. Reinforcing that surprise, the less-followed expenditure measure of GDP was unchanged, and the income measure actually rose by 0.2% in real terms.
As we signalled in our preview, the performance across industries was a mixed bag. Retailing, wholesaling and forestry saw the most significant declines. On the positive side, manufacturing saw a strong 1.9% rise, and personal services such as healthcare and recreation held up better than we expected.
As Stats NZ had noted, changes in the timing of tobacco imports have disrupted the pattern of quarterly GDP to some degree, boosting growth in the March quarter and acting as a drag on growth this time.
On the expenditure measure of GDP, there were gains in household spending, government spending and business investment. Goods exports were the main drag on growth, falling back by 4.4% after a strong rise in the March quarter.
Implications
While still soft, these results come as something of a relief. Higher-frequency activity data had taken a marked turn lower in May and especially June, raising concerns that the New Zealand economy’s drawn-out slowdown could be entering a new, much tougher phase. However, not only has the monthly data improved somewhat in July and August, but in GDP terms the June quarter itself turned out to be no worse than what we’ve seen over the last couple of years.
We continue to expect the RBNZ to cut the OCR by 25bps each at the October and November reviews. While financial markets will no doubt fixate on the idea that the US Fed’s decision this morning has opened the door for 50bp rate cuts elsewhere, there isn’t much in the local data that argues for the RBNZ to step up the pace of easing beyond what it had already signalled in its August policy statement.