Sample Category Title
Elliott Wave View on EURJPY Expects Rally to Fail
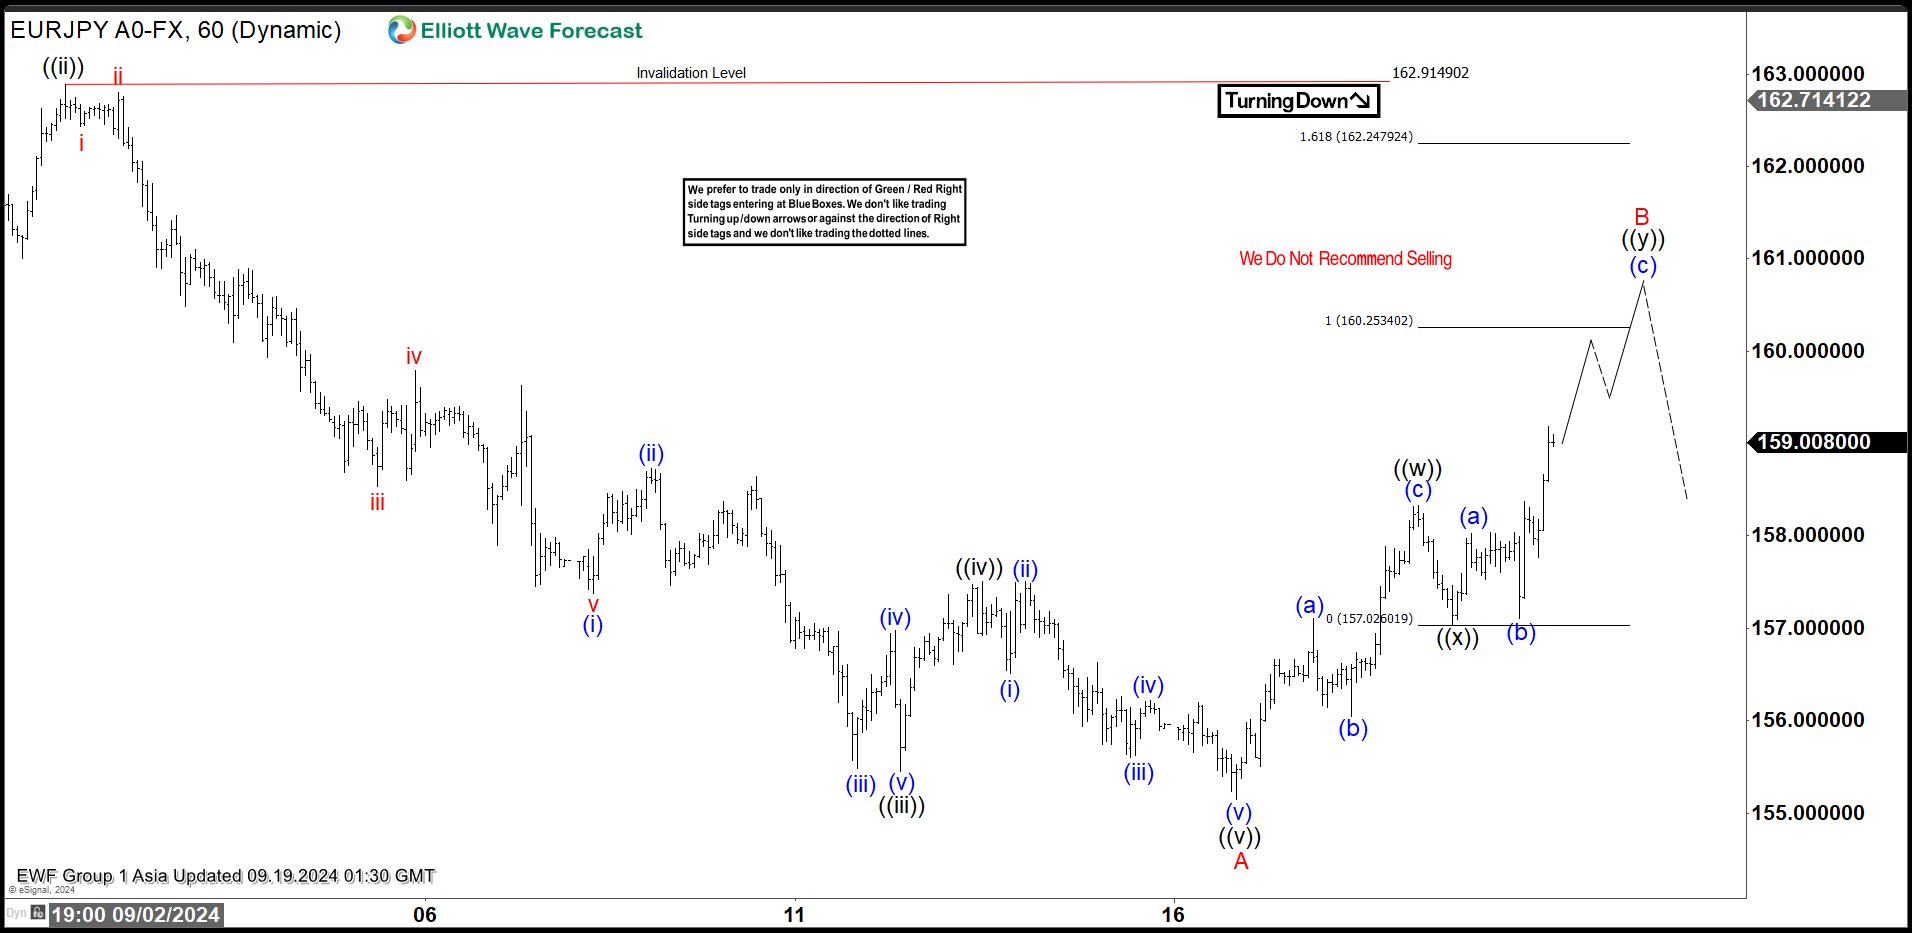
Short term Elliott Wave view on EURJPY suggests cycle from 8.16.2024 high ended at 155.14 as wave A. Internal subdivision of wave A unfolded as 5 waves impulse. Down from 8.16.2024 high, wave ((i)) ended at 160 and wave ((ii)) rally ended at 162.89. Wave ((iii)) lower ended at 155.446 and rally in wave ((iv)) ended at 157.51. The pair then extended lower in wave ((v)) towards 155.14 which completed wave A.
Wave B rally is currently in progress to correct cycle from 8.15.2024 high. Internal subdivision of wave B is unfolding as a double three Elliott Wave structure. Up from wave A, wave (a) ended at 157.1 and pullback in wave (b) ended at 156.04. The pair then rallied higher in wave (c) towards 158.33 which completed wave ((w)). Pullback in wave ((x)) ended at 157.03 and it has since turned higher again in wave ((y)). Up from wave ((x)), wave (a) ended at 158.03 and pullback in wave (b) ended at 157.10. Wave (c) higher is now in progress towards 160.25 – 162.24 and this should also complete wave ((y)) of B in higher degree. Near term, as far as pivot at 162.91 high stays intact, expect rally to fail in 3, 7, 11 swing for further downside.
EURJPY 60 Minutes Elliott Wave Chart
EURJPY Elliott Wave Video
https://www.youtube.com/watch?v=5nUdihd7Zjo
Fed Took a First, Bold Step
Markets
We’re finally here. The US Fed took a first, bold step in paring back monetary restrictiveness after keeping rates steady for more than a year. The decision to cut by 50 bps (to 4.75-5%) in the new pursuit to neutral comes amid a shift in the balance of risks in its employment and inflation goals. The statement is now saying that both are roughly in balance (vs. being in the process of). Money markets were divided on the size of yesterday’s cut. For Powell the near-unanimous (Fed governor Bowman dissented) move was a way to demonstrate the central bank’s resolve to protect the labour market and economy from further undue weakness. The dot plot showed another 50 bps of cuts this year, followed by 100 bps more in 2025 and 50 bps in 2026 with a flat rate in the first print for 2027 (2.75-3%). Just as Powell did in the presser we’d downplay the relevance of these individual guesstimates, especially in an easing cycle - which is never as gradual as the dot plot suggests. The chair referred to the dot plot as a baseline scenario from which they can deviate. All it takes is one downside surprise in one of the two payrolls reports due between today and the November 7 meeting and the Fed is ready to jump in. Adding to the argument is their very conservative 4.4% peak forecasted for the unemployment rate which risks being caught up by reality soon. We do retain another upward appreciation of the neutral rate from 2.8% to 2.9%. Powell was explicit in saying that this equilibrium rate was “probably significantly higher” than it was before the pandemic. For most of the presser, Powell sought to spiraling market expectations by not committing to anything, just as anyone would have expected him to do. That sufficed from a daily point of view. US yields reversed kneejerk losses and ended up between 1.4 and 6.1 bps higher in a curve steepener. A similar U-turn kept the US dollar at bay. First resistance in EUR/USD (1.1119) at 1.1202 was never really under threat. We’re curious to the market’s second reading of the Fed today though. In any case we remain cautious on US yields and the dollar and look out for the first major US data releases early October.
The Bank of England is in the spotlights today. We don’t expect the central bank to follow the ECB and Fed with a cut. The one in August was a close call for some and we think the recent string of data, including yesterday’s rising (services) CPI, won’t have those same policymakers voting for another move down again just yet. The November meeting, featuring updated forecast, on the other hand is a live one. This is exactly what is priced in. Sterling’s reaction to the status quo at 5% should therefore stay limited.
News & Views
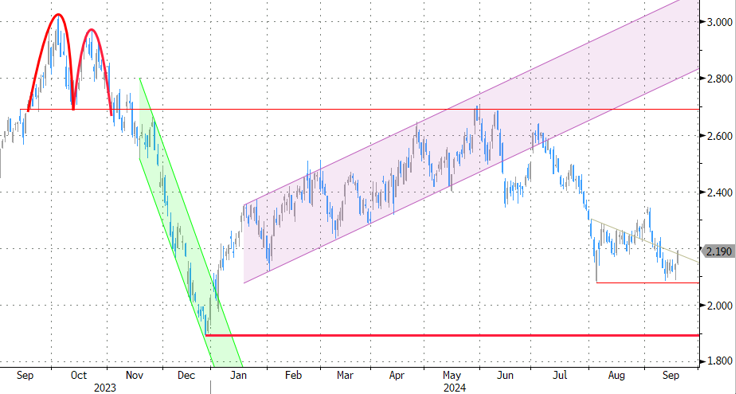
The Brazilian central bank (BCB) raised its policy rate yesterday by 25 bps, from 10.50% to 10.75%, bucking the global trend and showing what a soft landing might entail. The BCB was frontrunner in the early stages of the pandemic recovery to spot the inflation danger and start an aggressive tightening cycle, bringing the policy rate from 2% to 13.75%. As disinflation started, they gradually lowered the Selic target rate to 10.50%. It remained there since May until yesterday. Domestic indicators on the economic activity and the labour market have been stronger than expected, suggesting a positive output gap. Headline and core inflation measures moved back above the central bank’s inflation target. Inflation expectations remain deanchored and are one of the upside inflation risks together with services inflation. The BCB commits to further rate adjustments, but will let inflation decide on the pace and on the total magnitude. Lack of synchrony in monetary policy cycles across counties, and especially the US, continue to require caution. USD/BRL yesterday tested 5.40, the neckline of a technical head-and-shoulders pattern.
The August Australian labour market report was close to consensus. Employment increased by 47.5k (vs 26k expected) but following a downward revision to July figures (48.9k from 58.2k). Details showed a small decrease in the number of full-time employed people (-3.1k) with half-time jobs accountable for the August increase (+50.6k). The unemployment and labour force participation rates stabilized respectively at 4.2% and 67.1%. Head of the Australian Bureau of Statistics, Kate Lamb, said that the employment and participation measures remain historically high, while unemployment and underemployment measures are still low. This suggests the labour market remains relatively tight. The Aussie dollar profits this morning with AUD/USD testing the 0.68 resistance area as data strengthen the RBA’s current higher-for-longer approach.
Graphs
GE 10y yield
The ECB cut policy rates by 25 bps in June and in September. Stubborn inflation (core, services) make follow-up moves less evident. We expect the central bank to stick with the quarterly reduction pace. Disappointing US and unconvincing EMU activity data dragged the long end of the curve down. The move accelerated during the early August market meltdown.
US 10y yield
The Fed kicked off its easing cycle with a 50 bps move. It is headed towards a neutral stance now that inflation and employment risks are in balance. Conservative SEP unemployment forecasts risk being caught up by reality and with it the dot plot (50 bps more cuts in 2024). We hold our call for two more 50 bps cuts this year. Pressure on the front of the curve and weakening eco data keeps the long end in the defensive for now as well.
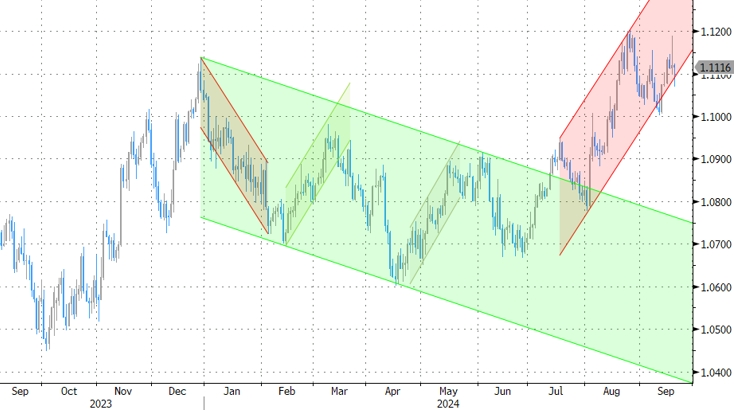
EUR/USD
EUR/USD moved above the 1.09 resistance area as the dollar lost interest rate support at stealth pace. US recession risks and bets on fast and large rate cuts trumped traditional safe haven flows into USD. EUR/USD 1.1276 (2023 top) serves as next technical references.
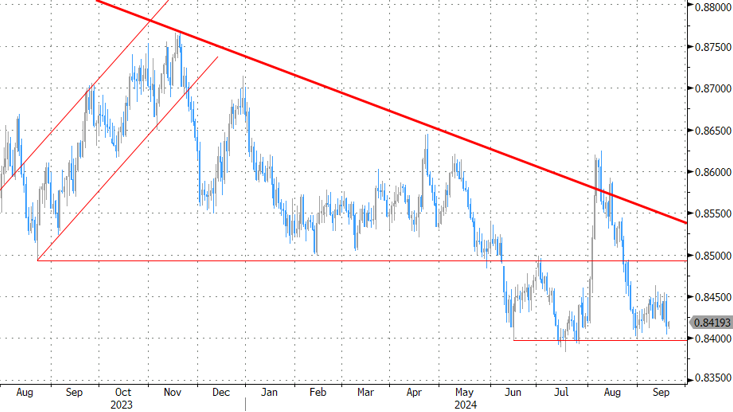
EUR/GBP
The BoE delivered a hawkish cut in August. Policy restrictiveness will be further unwound gradually on a pace determined by a broad range of data. The strategy similar to the ECB’s balances out EUR/GBP in a monetary perspective. Recent better UK activity data and a cautious assessment of BoE’s Bailey at Jackson Hole are pushing EUR/GBP lower in the 0.84/0.086 range.
Fed Delivers ‘Hawkish’ 50bp Rate Cut
In focus today
Today we will focus on multiple central bank monetary policy meetings.
Norges Bank (NB) will announce its rate decision at 10.00 CET followed by a press conference at 10.30 CET. We believe that NB will keep the policy rates unchanged, and signal that rates will be kept at that level for some time. We expect that the rate path in the monetary policy report will be adjusted downwards, signaling roughly a cut every quarter next year, significantly less than today's market price indicates, so a hawkish signal to markets.
In the UK, Bank of England (BoE) will announce its bank rate decision following the monetary policy meeting at 13.00 CET. We expect BoE to keep the bank rate unchanged at 5.00% in line with consensus and market pricing. In terms of communication, we anticipate BoE to stick to a cautious language and deliver a dovish twist to its communication. We expect a rather muted rection in EUR/GBP with risks tilted to the topside. Read more in Bank of England Preview - Proceeding with caution, 16 September.
We expect the Central Bank of Turkey to keep the policy rate unchanged today, in line with market consensus. The momentum in underlying inflation continued to accelerate in August. However, in our view this does not yet constitute a "significant and persistent deterioration in inflation" that is the CBRT's pre-condition for further policy tightening.
Early Friday, we will have a rate decision and August CPI print out of Japan. We expect no changes from the Bank of Japan following the hawkish turnaround at the late-July meeting. The bond market rally since then and cheaper oil prices have been a boon to JPY, which makes the initial motive for hiking rates less acute. We expect the next hike from the BoJ in December.
Regarding the CPI print, we previously got Tokyo CPI data indicating that price pressures picked up in August. Core inflation remains below 2%, though. The big question remains whether the recent recovery in purchasing power will support a pick-up in spending and push core inflation back above 2%.
Economic and market news
What happened yesterday
In the US, the Federal Reserve (Fed) decided to cut its target rate range by 50bp to 4.75-5.00%. This was a bigger cut than we expected. During this week markets gradually priced in a higher probability of the 50bp rate cut rather than the 25bp that we expected. The updated dot plot signals a total of 50bp of additional cuts for remainder of 2024 (so 25bp at each of the remaining meetings). For 2025, the Fed signals 4x25bp worth of additional cuts and 2x25bp also for 2026. We expect the Fed to ultimately deliver a faster and shorter cutting cycle than the 'dots' suggest. See Research US - Fed review: Going for the soft landing, 18 September.
The initial market reaction was for declining rates and weaker USD. However, the market reaction turned around and 10Y UST yields ended the session up by 6bp, while the 2Y tenor was close to unchanged. EUR/USD initially rallied towards 1.1190 following the 50bp rate cut but returned to around the 1.1120 mark after the press conference. USD strengthened further overnight where we briefly saw EUR/USD hit 1.070, but it is now back just below the 1.112 mark where it all started prior to the announcement.
In the euro area, the final HICP print confirmed the flash release at 2.2% y/y and core inflation at 2.8% y/y. Domestic inflation in the euro area measured by the ECB's 'LIMI' indicator declined to 4.22% y/y in August from 4.26% in July. With the August data we thus still see this very sticky domestic inflation with strong momentum.
In the UK, August CPIs were fully in line with consensus expectations; headline at 2.2% (prior: 2.2%), core at 3.6% (prior: 3.3%) and services at 5.6% (prior: 5.2%). Monthly pressures slightly higher in the core and service measure with upward contributions stemming from transport (air fares) and recreation and culture, explaining the slight move lower in EUR/GBP on the release. The print does not change our view of an unchanged decision from BoE later today.
Equities: Global equities were lower yesterday, but the movements were minor considering the stakes at the Federal Reserve meeting. Add to the puzzle the positive trends in Asia this morning and the markedly higher futures in Europe and the US. For those not following intraday movements, it is important to note that the initial equity market reaction to the policy statement was quite positive. It was not until after Powell's press conference that we observed a decline in equities. Without delving deeper into the details, the Fed managed to implement what we previously termed a semi-hawkish 50 basis point cut, without emphasizing the weakness in the labour markets too heavily. Although there was some divergence within sectors, it was minimal, and most notably, there was a slight outperformance in small caps. In the US yesterday, the indices closed as follows: Dow -0.3%, S&P 500 -0.3%, Nasdaq -0.3%, and Russell 2000 +0.04%. This morning, Asian markets are experiencing gains, led by a strong performance in Japan and a weakening yen. Futures in Europe and the US are also trending higher.
FI: Yesterday's 50bp rate cut 'surprise' from the Fed did not trigger significant volatility, as the central bank kept its guidance of a gradual return to normal. The initial market reaction to the rate cut announcement was a bullish steepening of the UST curve, but the move faded through the press conference as Powell struck a relatively upbeat tone on the economic outlook.
FX: The 50bp Fed cut initially led to a softer USD across the board, but most of the reactions reversed during Powell's press conference. GBP, NOK, CHF gained most against the USD in the G10 space, while EUR/USD remains more or less unchanged, just above the 1.11 mark. In the Scandies today's most important event is the Norges Bank meeting.
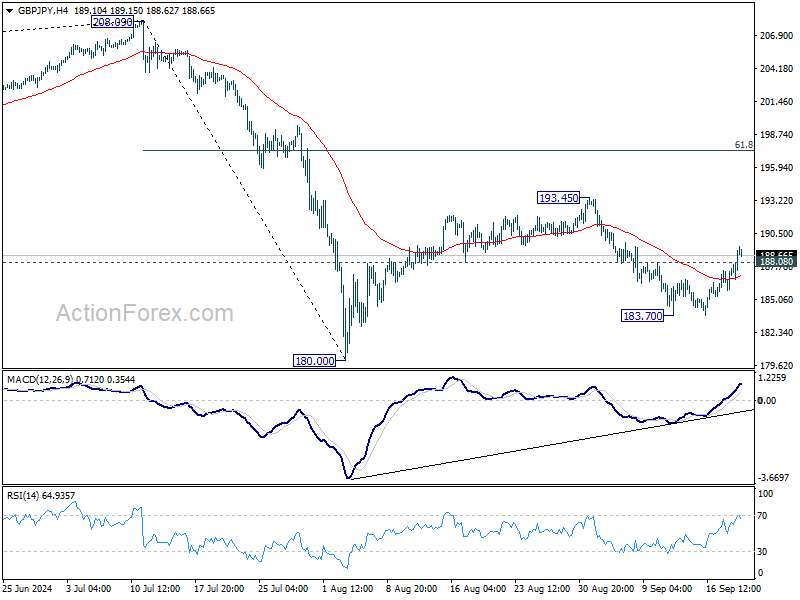
GBP/JPY Daily Outlook
Daily Pivots: (S1) 186.51; (P) 187.28; (R1) 188.74; More...
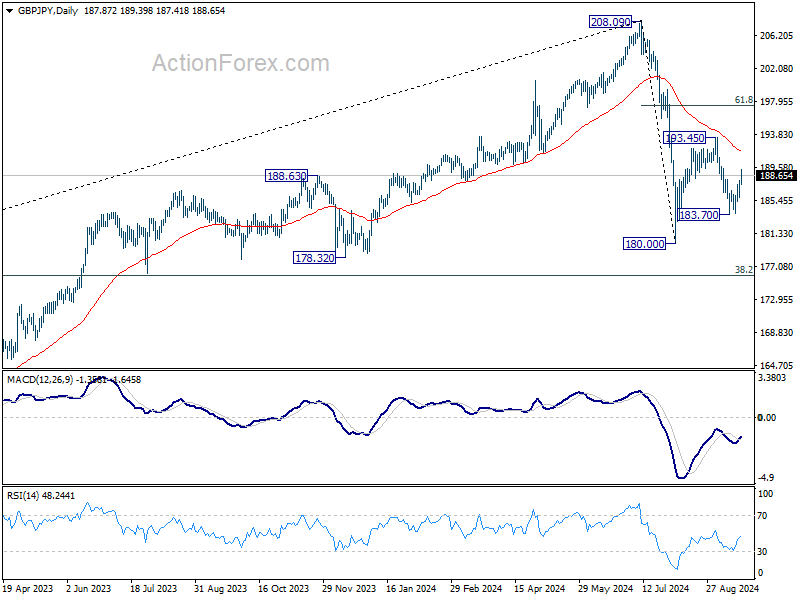
GBP/JPY's break of 188.08 minor resistance suggest that fall from 193.45 has completed at 183.70 already. Rise from there is seen as the third leg of the corrective pattern from 180.00. Intraday bias is back on the upside for 193.45 and possibly further to 61.8% retracement of 208.09 to 180.00 at 197.35.
In the bigger picture, price actions from 208.09 are seen as a correction to whole rally from 123.94 (2020 low). The range of consolidation should be set between 38.2% retracement of 123.94 to 208.09 at 175.94 and 208.09. However, decisive break of 175.94 will argue that deeper correction is underway.
EUR/JPY Daily Outlook
Daily Pivots: (S1) 157.36; (P) 157.87; (R1) 158.69; More....
EUR/JPY's break of 158.71 minor resistance suggests that fall form 163.89 has completed at 155.14 already. Rebound from there is seen as the third leg of the corrective pattern from 154.40. Intraday bias is back on the upside for 163.89, and possibly further to 61.8% retracement of 175.41 to 154.40 at 167.38.
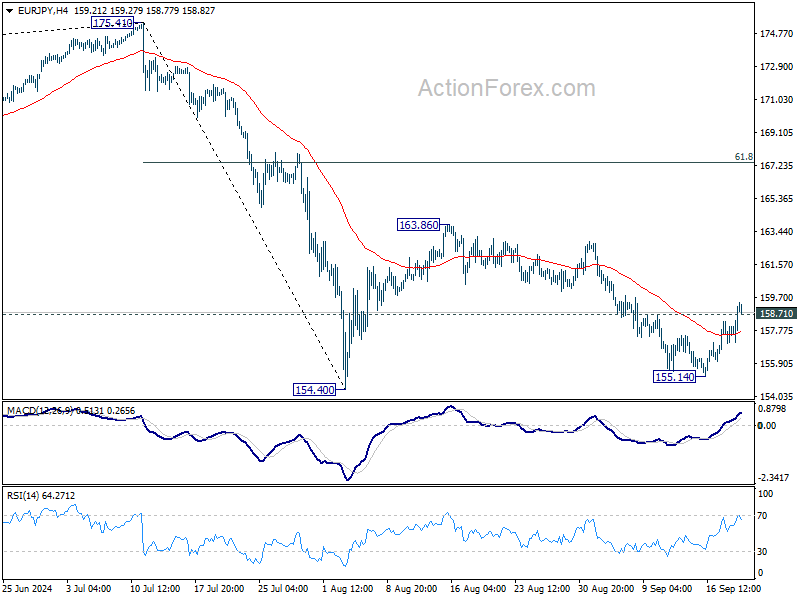
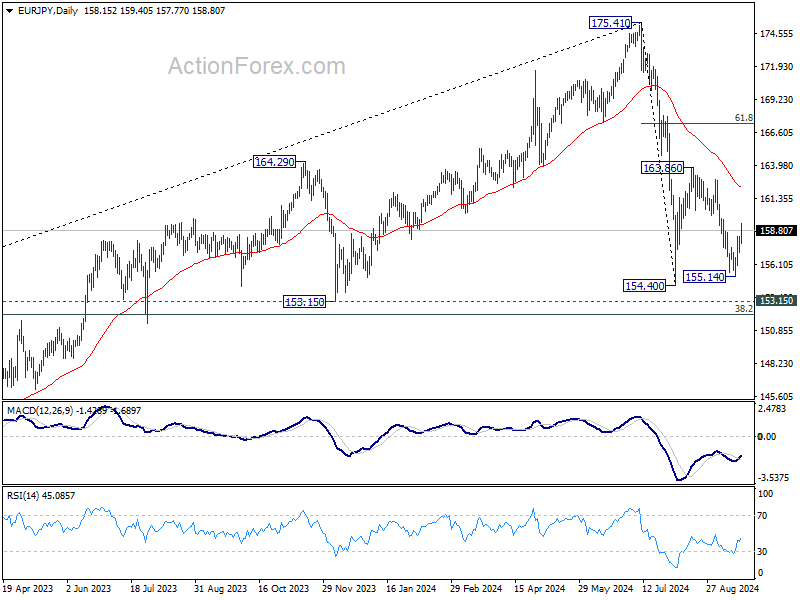
In the bigger picture, price actions from 175.41 are seen as correction to rally from 114.42 (2020 low). The range of consolidation should have been set between 38.2% retracement of 114.42 to 175.41 at 152.11 and 175.41 high. However, decisive break of 152.11 would argue that deeper correction is underway.
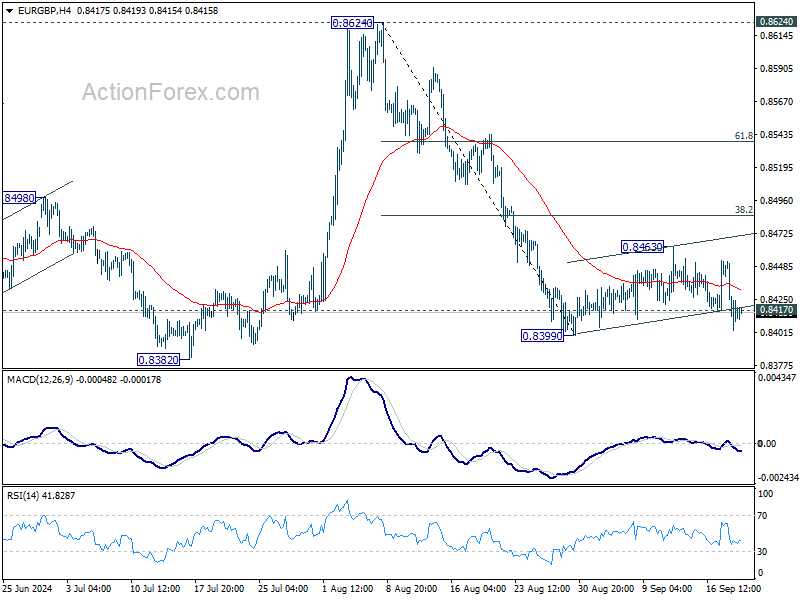
EUR/GBP Daily Outlook
Daily Pivots: (S1) 0.8394; (P) 0.8424; (R1) 0.8443; More...
Break of 0.8417 minor support suggests that consolidation pattern form 0.8399 has complete at 0.8463 already. Intraday bias is back on the downside in EUR/GBP. Break of 0.8399 will resume the decline from 0.8624 to 0.8382 low. Firm break there will resume larger down trend. For now, outlook will remain bearish as long as 0.8463 resistance holds, in case of recovery.
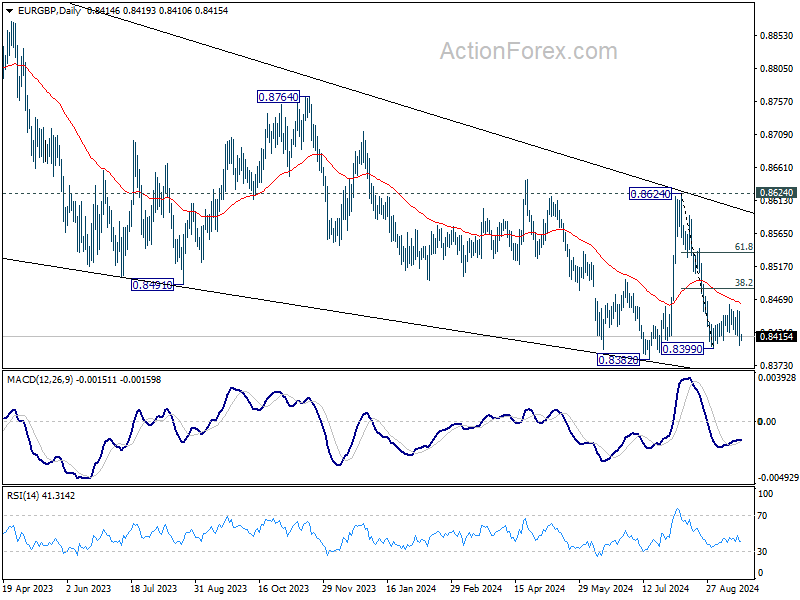
In the bigger picture, as long as 0.8624 resistance holds, down trend from 0.9267 is expected to continue. Firm break of 0.8382 will target 0.8201 (2022 low). However, decisive break of 0.8624 will indicate that such down trend has completed, and turn outlook bullish for 0.8764 resistance next.
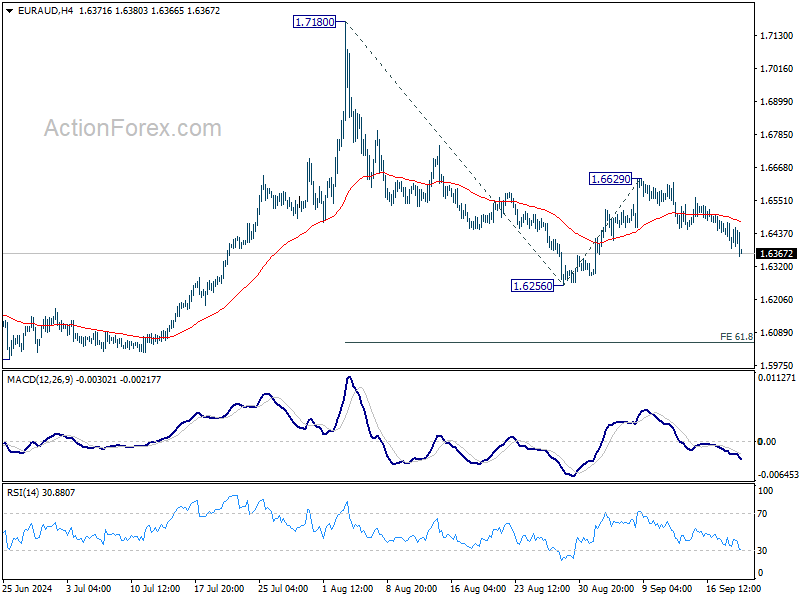
EUR/AUD Daily Outlook
Daily Pivots: (S1) 1.6389; (P) 1.6433; (R1) 1.6481; More...
Intraday bias in EUR/AUD stays on the downside for 1.6256 support first. Firm break there will resume whole fall from 1.7180 to 61.8% projection of 1.7180 to 1.6256 from 1.6629 at 1.6058. For now, risk will be on the downside as long as 1.6629 resistance holds, in case of recovery.
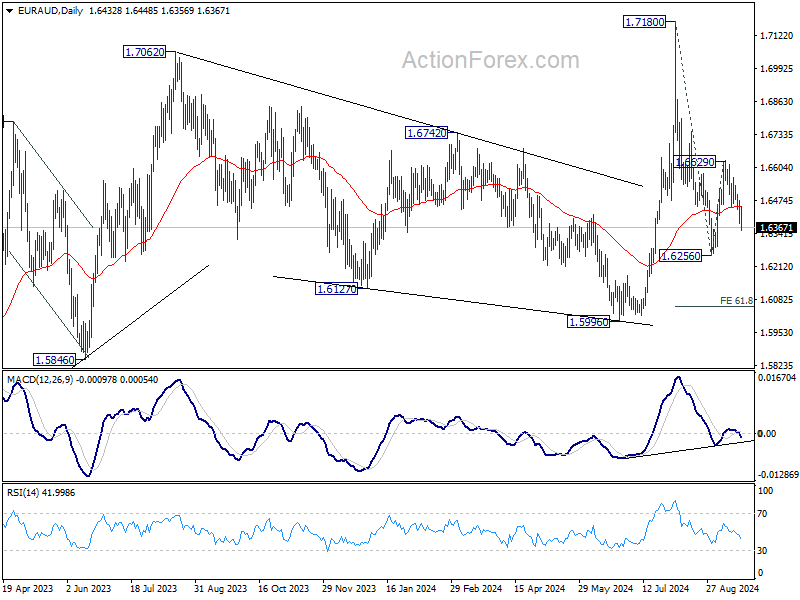
In the bigger picture, outlook is mixed up by the deeper than expected fall from 1.7180. Yet as long as 1.5996 support holds, up trend from 1.4281 (2022 low) is still in favor to resume at a later stage. Firm break of 1.7180 will pave the way to 61.8% projection of 1.4281 to 1.7062 from 1.5996 at 1.7715.
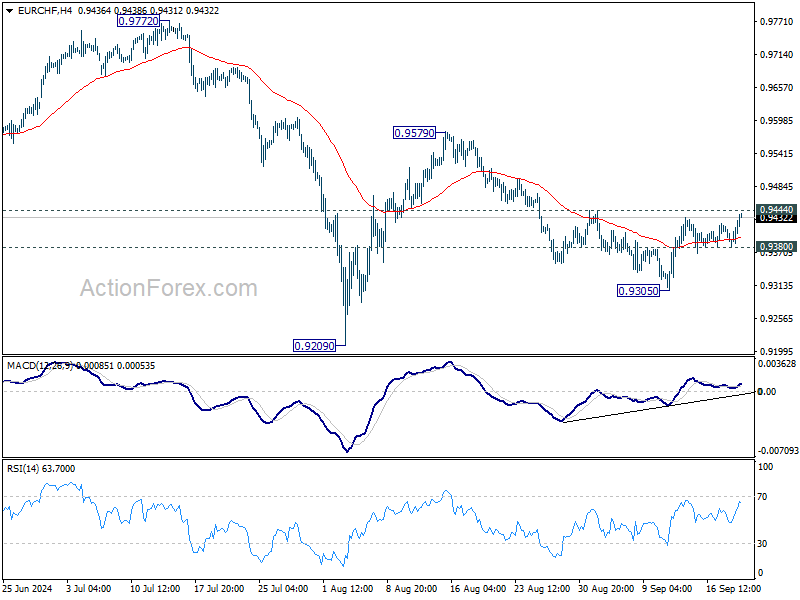
EUR/CHF Daily Outlook
Daily Pivots: (S1) 0.9386; (P) 0.9405; (R1) 0.9427; More....
Intraday bias in EUR/CHF stays neutral at this point. Break of 0.9380 minor support will turn bias to the downside for 0.9305. Further break there will resume the decline from 0.9579 to retest 0.9209 low. Nevertheless, decisive break of 0.9444 will argue that the fall from 0.9579 has completed as a corrective move. Intraday bias will be turned bias to the upside for 0.9579.
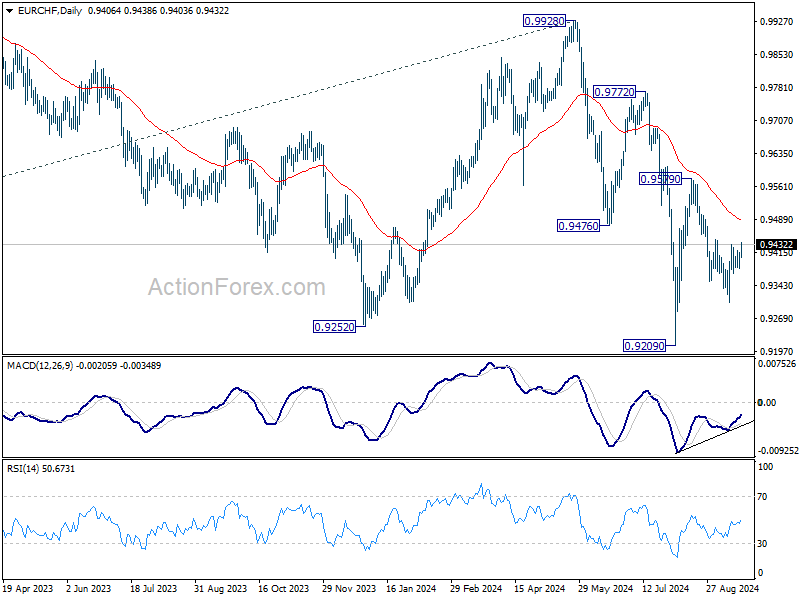
In the bigger picture, medium term corrective pattern from 0.9407 (2022 low) might have completed with three waves to 0.9928. Decisive break of 0.9252 (2023 low) will confirm long term down trend resumption. Next target will be 61.8% projection of 1.1149 to 0.9407 from 0.9928 at 0.8851. For now, outlook will stay bearish as long as 0.9928 resistance holds, even in case of strong rebound.
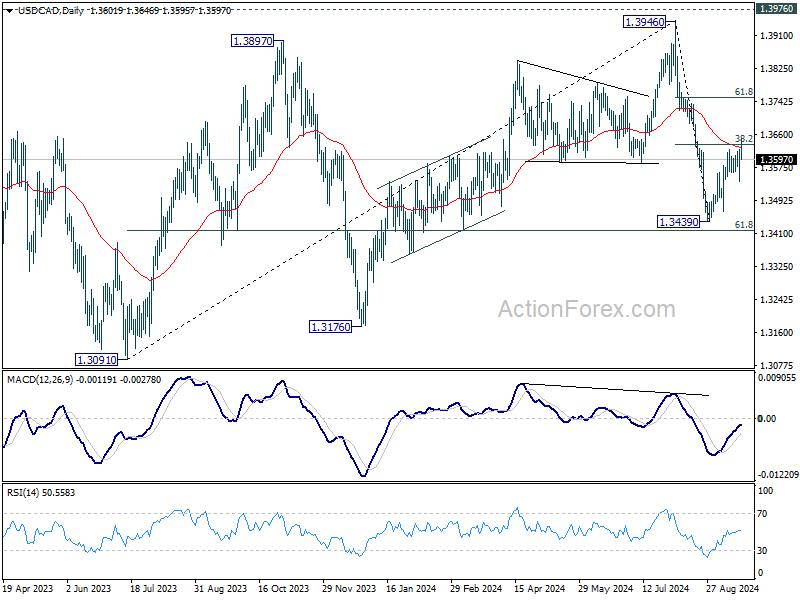
USD/CAD Daily Outlook
Daily Pivots: (S1) 1.3557; (P) 1.3590; (R1) 1.3639; More...
Intraday bias in USD/CAD remains neutral for the moment. On the downside, break of 1.3545 minor support will suggest that recovery from 1.3439 has completed, and turn bias to the downside for retesting this low. Nevertheless, decisive break of 38.2% retracement of 1.3946 to 1.3439 at 1.3633 would argue that the decline from 1.3946 has completed. Stronger rally would then be seen to 61.8% retracement at 1.3752 and above.
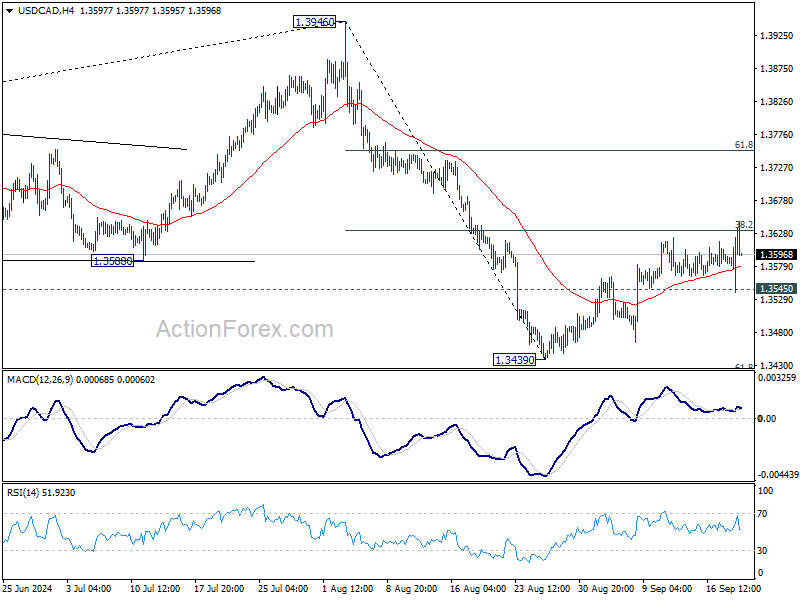
In the bigger picture, corrective pattern from 1.3976 (2022 high) is extending with another falling leg. While deeper decline could be seen, strong support should emerge above 1.2947 resistance turned support to bring rebound. Rise from 1.2005 (2021 low) is still in favor to resume at a later stage.
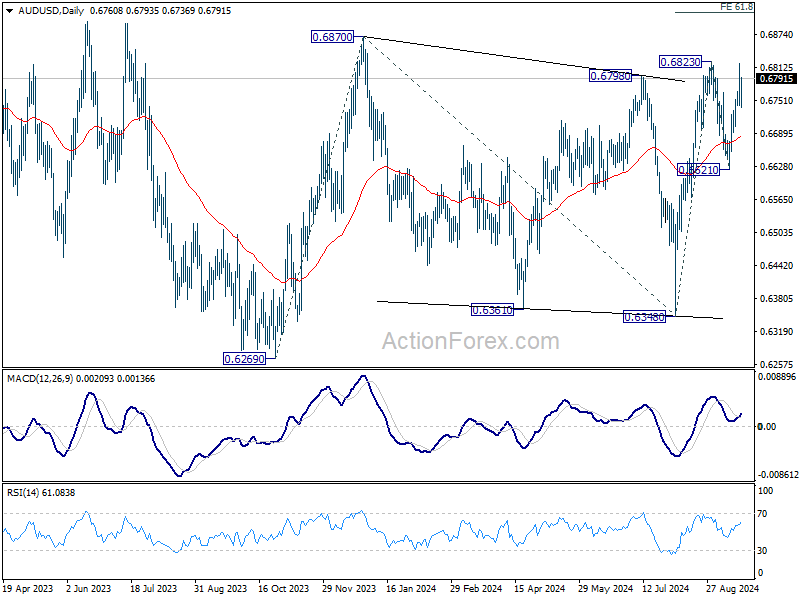
AUD/USD Daily Report
Daily Pivots: (S1) 0.6731; (P) 0.6776; (R1) 0.6808; More...
Intraday bias in AUD/USD is back on the upside with break of 0.6766 resistance. Further break of 0.6823 will confirm resumption of rally from 06348. Next target is 61.8% projection of 0.6348 to 0.6823 from 0.6621 at 0.6915. On the downside, however, below 0.6691 will turn bias back to the downside for 0.6621 support.
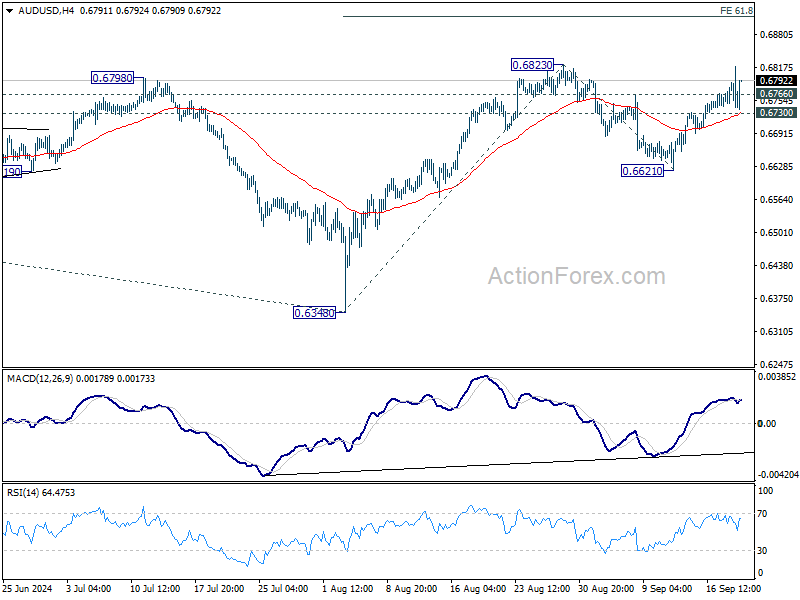
In the bigger picture, overall, price actions from 0.6169 (2022 low) are seen as a medium term corrective pattern, with rise from 0.6269 as the third leg. Firm break of 0.6798/6870 resistance zone will target 0.7156 resistance. In case of another fall, strong support should be seen from 0.6169/6361 to bring rebound.