
Sample Category Title
FOMC’s Normalisation Cycle Begins
50bps delivered and another 50bps seen by year end by the FOMC.
At the September meeting, the FOMC decided to cut by 50bps to begin their policy normalisation cycle. The Committee projects another 50bps of cuts to end-2024 (over two meetings), another 100bps of cuts in 2025, then a final 50bps in 2026, leaving the fed funds rate at 2.9%, which is also the Committee’s upwardly revised ‘longer run’ estimate of neutral.
The Committee’s statement and Chair Powell’s remarks in the press conference were worded carefully to highlight that the 50bp cut was not a signal of concern in the outlook, but rather a response to inflation slowing near target and the risks to achieving its employment and inflation goals now being “roughly in balance”.
The revised forecasts provided by FOMC members also speak to confidence in the economy. GDP growth is forecast to be 2.0%yr in 2024-2027, above their ‘longer run’ estimate of trend growth of 1.8%. The unemployment rate is consequently forecast to peak at 4.4% in 2024 then drift down to 4.2% through 2026 and 2027, where the unemployment rate is today. This implies little-to-no further deterioration in employment growth over the forecast period, in contrast to the marked deceleration in payrolls employment growth seen over the past two years – from 320k per month over the year to March 2023 to a 174k average over the 12 months to March 2024 (incorporating the BLS’ initial annual revision guidance) and now 116k in the three months to August. The inflation projections also point to an economy in robust shape over the outlook, with both headline and core inflation to trough at 2.0%yr not below.
It is worth emphasising however, while the ranges for the activity and price forecasts are narrow, the Committee’s views on the fed funds rate at end-2025, 2026 and 2027 are broad. Whereas the vast majority of the Committee see the fed funds rate only 25bps to 50bps below the current level by end-2024, the December projections for 2025 through 2027 are spread across a 150bp range. In 2027, the FOMC’s full range of estimates for the fed funds rate therefore stretches from 50bps below the their neutral estimate to 100bps above. To us, this speaks to considerable uncertainty over how the balance of risks will evolve and, as per Chair Powell’s remarks, a commitment to take “timely” action and “not to get behind” with policy. The FOMC regard the stance of policy as still materially above neutral and expect to return near it in time. How quickly they do so will be determined by incoming data and the perceived balance of risks.
To us, there is reason to be wary over a further deterioration in conditions and associated risks. We expect lower GDP growth in 2025 and 2026 of 1.8%yr and 1.7%yr versus the FOMC’s 2.0%yr. Westpac also expects a greater degree of weakness in the labour market, with the unemployment rate to rise to 4.7% in 2025 and hold there. Still, we also see inflation modestly above the FOMC’s 2.0%yr expectation in 2025 and 2026 as a result of supply-side pressures which are not easily resolved but, for the sake of inflation expectations, must be managed by the Committee. The 3.375% we have forecast for late-2025 speaks to these diverging risks and their persistence. The flow of data in coming months will be critical to assessing these uncertainties and their implications for the policy outlook.
AUDCAD Wave Analysis
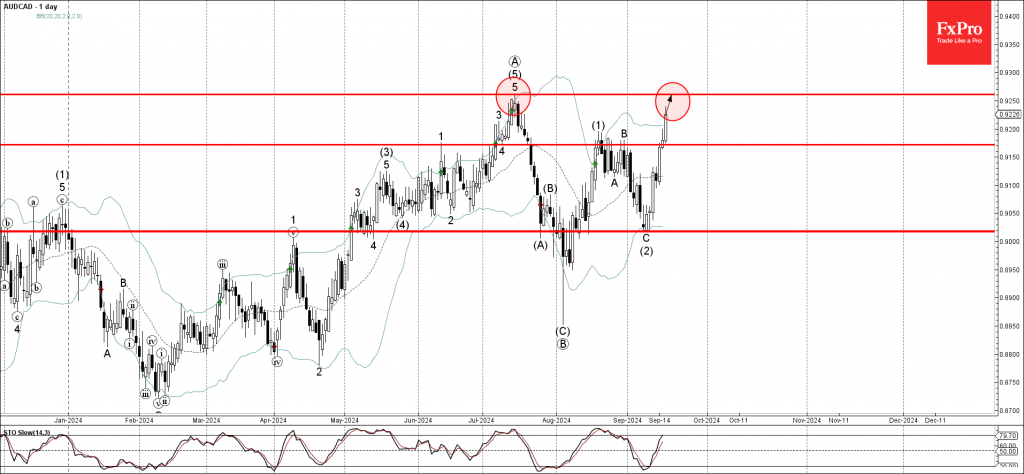
- AUDCAD broke pivotal resistance level 0.9170
- Likely to rise to resistance level 0.9260
AUDCAD currency pair recently broke above the pivotal resistance level 0.9170 (which stopped the previous waves (1) and B last month).
The breakout of the resistance level 0.9170 accelerated the active intermediate impulse wave (3).
Given the clear daily uptrend, AUDCAD currency pair can be expected to rise further to the next resistance level 0.9260 (former multi month high from July).
WTI Wave Analysis
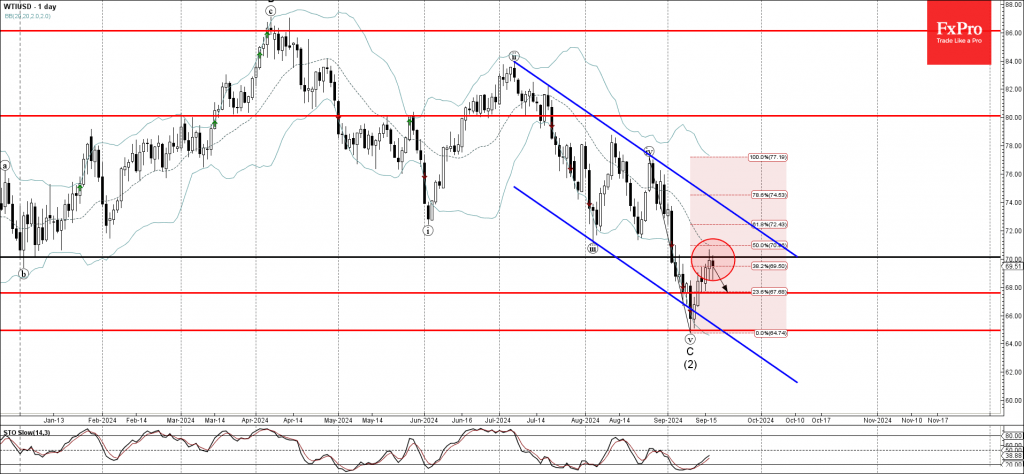
- WTI reversed from round resistance level 70.00
- Likely to fall to support level 68.00
WTI crude oil recently reversed down from the round resistance level 70.00 (former strong support from January).
The resistance level 70.00 was strengthened by the nearby 20-day moving average and by the 50% Fibonacci correction of the sharp downward impulse from last month.
Given the clear daily downtrend, WTI crude oil can be expected to fall further to the next support level 68.00.
Fed Review: Going for the Soft Landing
- The Federal Reserve cut rates by 50bp in the September meeting, against our call for only a 25bp cut. The new policy rate target is 4.75-5.00%.
- The updated dots signal a total of 50bp of additional cuts in 2024, 4x25bp of cuts in 2025 and 2x25bp cuts in 2026. Relative to our call, the Fed signals a longer but more gradual rate cutting cycle.
- Powell downplayed recession risks despite the larger-than-expected cut, and most of the decline UST yields and weakening in USD FX reversed over the course of the press conference.
Markets were historically divided between 25bp and 50bp cuts going into the FOMC's September decision. Powell accompanied the larger rate reduction with an overall positive assessment of the economy, ending the press conference saying: 'I don't see anything in the economy right now that suggests likelihood of a downturn is elevated.'
The larger move was motivated by a significant shift in the Fed's risk assessment. 12 out of 18 participants saw risks to unemployment rate tilted to the upside (prev. 4 participants), and the median unemployment rate forecast was revised up through 2024-2026. While GDP forecasts were left mostly unchanged, 7 participants saw risks tilted to the downside also for growth (prev. 3). Inflation is seen stabilizing to 2% faster than previously expected with a balanced risk outlook.
Powell also mentioned that 'it feels to me that neutral rate is probably significantly higher than it was pre-pandemic'. The median long-term 'dot' shifted to 2.9% (from 2.8%) with 7 participants now seeing the long-term rate at or above 3.25% (prev. 4). So, while the risk assessment and distribution of individual dots suggest that the Fed is open for faster rate cuts in the near-term if needed, rates could stabilize at a higher level longer-term.
Ahead of the meeting, some commentators voiced concerns over a larger cut potentially sparking rising recession fears in the markets. While most of the initial market reaction has already faded, Powell successfully maintained financial conditions on an easing trend. Yield curve steepened with 10y UST yield ending the session above its pre-announcement level. This reflects markets downplaying the probability of a recession, as faster rate cuts and consequently easing financial conditions are set to provide support for growth in 2025.
We expect the Fed to ultimately deliver a faster and shorter cutting cycle than the 'dots' suggest. We forecast 25bp cuts in every meeting until June and see the policy rate reaching 3.00-3.25% by end-2025. This is lower than the level implied by the dots (3.25-3.50%).
Markets are now pricing in a cumulative 70bp of additional cuts for the two remaining meetings of 2024, split roughly evenly between November and December. If labour market data continues weakening, we would expect markets to test the Fed's call for only 25bp cuts in the remaining meetings. While we maintain our call unchanged, the bar for another 50bp move in November is now inarguably lower than before. Finally, the Fed maintained the pace of QT unchanged and Powell made it clear that the decisions regarding QT remain separate from rate decisions. We expect QT to run well into 2025.
FOMC Starts Easing Cycle With a Bang
Summary
- The FOMC surprised some market participants today by reducing the target range for the federal funds rate by 50 bps. Concerns about the state of the labor market appear to have been the primary driver of the 50 bps move.
- But the FOMC signaled that it may not necessarily follow today's 50 bps rate cut with additional large reductions in upcoming meetings. The median dot in the so-called "dot plot" implies two 25 bps cuts if further easing is spread evenly over the two remaining meetings this year.
- Only one voter (Governor Michelle Bowman) dissented at today's policy meeting, preferring a 25 bps rate cut instead, but the dot plot indicates that a meaningful share of the Committee appears to be in no hurry to reduce the fed funds rate at a rapid clip.
- The FOMC may indeed slow the pace of rate cuts in coming meetings. But we remain of the view that monetary policy will be back near neutral in one year's time. That is, we look for the federal funds rate to be roughly 3.00%-3.25% or so by this time next year. We will formally update our meeting-by-meeting fed funds forecast in the coming days.
FOMC Front Loads Easing Cycle
Heading into today's FOMC meeting, there was more uncertainty among market participants about the outcome than there has been in some time. A rate cut, which would be the first since March 2020, was universally expected. But would the Committee reduce the target range for the federal funds rate by 25 bps or 50 bps? In the event, the FOMC decided to cut rates by 50 bps. The vote was 11-1 in favor, with the lone dissent coming from Governor Michelle Bowman. Just one dissent is not uncommon, but it is more uncommon for a member of the Board of Governors to vote against the policy decision. Today marks the first governor to dissent since 2005, and the first governor to dissent in favor of tighter policy since 1994.
The post-meeting statement highlighted the cooling in the labor market, saying that job gains had "slowed." In that regard, the economy created 267K jobs per month in the first quarter of the year, but that pace has nearly halved over the past three months (Figure 1). The statement also seemed to hint that concerns about the labor market had been the primary driver of the 50 bps move with the line "in light of the progress on inflation and the balance of risks [emphasis ours], the Committee decided to lower the target range for the federal funds rate by 1/2 percentage point." The idea that the risks are skewed to the downside for the labor market was further reinforced by the addition of a line signaling that the Committee is "strongly committed" to supporting maximum employment in addition to the existing line about returning inflation to 2%.
Summary of Economic Projections Highlights More Balanced Risks
The update to the Summary of Economic Projections (SEP) suggests today's 50 bps cut was an effort to front-load the removal of policy restriction, and that additional 50 bps cuts may not occur at upcoming meetings without a meaningful deterioration in the economy. The median participant projection for the fed funds rate at year-end slipped to 4.375%, implying two 25 bps cuts if further easing is spread evenly over the two remaining meetings this year (Nov. 7 and Dec. 18). However, seven Committee members projected rates to fall only 25 bps further this year, while two projected no change (Figure 2). In other words, only one voter may have dissented in September, but a meaningful share of the Committee is still in no hurry to reduce the fed funds rate.
The disconnect between today's action and the outlook for additional easing in the near term may stem from uncertainty about where the neutral policy setting is. The median estimate of the longer run fed funds rate rose a tick to 2.9% in September, but the range remains wide at 2.4%-3.8%. Yet by that measure, even the more hawkish members of the Committee seem to agree that the prior policy rate of 5.25%-5.50% was very restrictive, allowing space to reduce the target range without inadvertently venturing into "accommodative" territory.
Participants expect further easing in 2025, although at potentially a slower pace. The median dot for 2025 shifted down to 3.375%, implying 100 bps further easing next year.
The more balanced risks between the inflation and employment side of the Fed's mandate were evident in the economic portion of projections. The median estimate for the unemployment rate at year-end rose to 4.4% from 4.0% in June, slightly higher than most participants' longer-run estimates, and is expected to stay at 4.4% in 2025 (Figure 3). Meantime, Committee members seemed more constructive on the inflation outlook. The median estimate for headline inflation in Q4-2024 fell from 2.6% to 2.3%. The FOMC also projects core inflation to descend a touch faster than it did in the last SEP; the median estimate slipped to 2.6% for 2024 and 2.2% for 2025 compared to 2.8% and 2.3% previously. Notably, 16 of 19 participants now see the risks to core inflation as broadly balanced, compared to only seven at the June meeting (Figure 4). At the same time, the majority of the Committee (12 participants) believe the risks to the unemployment rate lie to the upside versus only four when the Committee met in June.
Coming into today's meeting, we expected a 25 bps rate cut today followed by a pair of 50 bps rate reductions at each of the November and December meetings for a cumulative 125 bps decline in the federal funds rate by year-end. With today's decision by the FOMC, a 50 bps move came a bit faster than we were anticipating, but our overarching view that the FOMC will ease materially in the coming months has not changed. It will be a close call whether we get another 50 bps move by year-end or if the Committee slows down to a more-measured 25 bps pace. The employment reports that are slated for release in the next three months will be critical inputs into the FOMC's decisions at the November and December meetings. We will formally update our meeting-by-meeting fed funds forecast in the coming days, but we remain of the view that monetary policy will be back near neutral in one year's time. That is, we look for the federal funds rate to be roughly 3.00%-3.25% or so by this time next year.
Fed Cuts Rates by an Oversized 50 Basis Points
The Federal Reserve Open Market Committee (FOMC) cut the target range for the federal funds rate by 50 basis points (bps), to 4.75% to 5.00% and announced it would continue its balance sheet runoff.
The Fed noted that it "has gained greater confidence that inflation is moving sustainably toward 2 percent", and "judges that the risks to achieving its employment and inflation goals are roughly in balance."
On the future path of policy, the statement repeated that "the Committee will continue to monitor the implications of incoming information for the economic outlook. The Committee would be prepared to adjust the stance of monetary policy as appropriate if risks emerge that could impede the attainment of the Committee's goals."
The Fed's Summary of Economic Projections was updated from June:
- The median projection for real GDP growth was largely unchanged at 2.0% in 2024, 2.0% in 2025, 2.0% in 2026, and 1.8% over the long run.
- The median unemployment rate forecast was raised to 4.4% in 2024, 4.4% in 2025, 4.3% in 2026, and 4.2% over the long run (from 4.0%, 4.2%, 4.1%, and 4.2%), respectively.
- On inflation, the median estimate for core PCE was lowered to 2.6% in 2024, 2.2% in 2025, and 2.0% in 2026 (from 2.8%, 2.3%, and 2.0%).
- The median projection for the fed funds rate was also lowered to 4.4% in 2024, 3.4% in 2025, 2.9% in 2026, and the long-run neutral rate was assumed to be 2.9% (from 5.1%, 4.1%, 3.1%, and 2.8%).
One FOMC member voted against the decision. Michelle W. Bowman preferred to cut the funds rate by a quarter point. That is the first dissent by a Fed governor since 2005.
Key Implications
Today was one of the most uncertain Fed decisions in recent memory. The central bank could have easily gone either way with this one. But given that it elected to go for an oversized 50 bps cut, it's clear that the Fed has gained sufficient confidence that inflation is headed to 2%. It can now focus on the slowing job market, where the unemployment rate has been steadily rising.
Looking at the updated Fed member forecast, the "dots", the median expectation is for only 50 bps in further cuts expected this year. This could be another 50 in November, or it could imply that the Fed will move to a slower path now that it has come out of the gates quickly, with a quarter point cut at each of the remaining meetings this year. From our point of view, the Fed's current policy stance is still roughly 200 bps above where it needs to be given the state of the economy. This implies that, no matter the specific pace, investors should expect the Fed to keep cutting through the rest of this year and next.
Fed cuts interest rate by 50bps, only Bowman dissents
Fed cuts federal funds rate by 50 bps to 4.75-5.00% today. While the decision was not unanimous, only Fed Governor Michelle Bowman dissented and voted for a 25bps cut.
Fed acknowledged that job gains have "slowed" while unemployment rate has "moved up". At the same time, inflation has made "further progress" towards 2% target. In considering further adjustments, Fed will "carefully assess incoming data, the evolving outlook, and the balance of risks".
In the new median economic projections, interest rate will fall to 4.4% by the end of 2024 (versus prior 5.1%, implying 50bps more rate cut), 3.4% by the end of 2025 (versus prior 4.1%), and then 2.9% by the end of 2026 (versus prior 3.1%). That is Fed is seeing a much faster rate cut this year, but the same pace in 2025. The longer run rate was revised slightly up from 2.8% to 2.9%.  In the new dot plot, 9 members penciled in fed funds rate to be at 4.50-4.75 or above by the end of the year. 10 members see interesting rates at 4.25-4.50% and below. So it's a pretty tight split. November FOMC meeting would be live.
(FED) Federal Reserve Issues FOMC Statement
Recent indicators suggest that economic activity has continued to expand at a solid pace. Job gains have slowed, and the unemployment rate has moved up but remains low. Inflation has made further progress toward the Committee's 2 percent objective but remains somewhat elevated.
The Committee seeks to achieve maximum employment and inflation at the rate of 2 percent over the longer run. The Committee has gained greater confidence that inflation is moving sustainably toward 2 percent, and judges that the risks to achieving its employment and inflation goals are roughly in balance. The economic outlook is uncertain, and the Committee is attentive to the risks to both sides of its dual mandate.
In light of the progress on inflation and the balance of risks, the Committee decided to lower the target range for the federal funds rate by 1/2 percentage point to 4-3/4 to 5 percent. In considering additional adjustments to the target range for the federal funds rate, the Committee will carefully assess incoming data, the evolving outlook, and the balance of risks. The Committee will continue reducing its holdings of Treasury securities and agency debt and agency mortgage‑backed securities. The Committee is strongly committed to supporting maximum employment and returning inflation to its 2 percent objective.
In assessing the appropriate stance of monetary policy, the Committee will continue to monitor the implications of incoming information for the economic outlook. The Committee would be prepared to adjust the stance of monetary policy as appropriate if risks emerge that could impede the attainment of the Committee's goals. The Committee's assessments will take into account a wide range of information, including readings on labor market conditions, inflation pressures and inflation expectations, and financial and international developments.
Voting for the monetary policy action were Jerome H. Powell, Chair; John C. Williams, Vice Chair; Thomas I. Barkin; Michael S. Barr; Raphael W. Bostic; Lisa D. Cook; Mary C. Daly; Beth M. Hammack; Philip N. Jefferson; Adriana D. Kugler; and Christopher J. Waller. Voting against this action was Michelle W. Bowman, who preferred to lower the target range for the federal funds rate by 1/4 percentage point at this meeting.
AUDUSD Rallies from the Extreme Within a Corrective Structure
Hello traders. Welcome to another trading blog where we discuss chart setups that Elliottwave-Forecast members traded. In today’s blog, the spotlight will be on AUDUSD as the pair recently reacted as expected from an extreme area thus providing profitable trade ideas for members.
Since the low of October 2022, AUDUSD has rallied and faltered multiple times. The pair has been in a range between the high of February 2023 and the low of October 2022. However, even within a range, traders can spot opportunities in the shorter time frames. As for the Aussie, the pair completed the supercycle degree wave (I) in March 2020. Since the end of wave (I), the pair has rallied sharply with an impulse sequence that ended in February 2021. Since then, it has been in a corrective cycle that we have identified as a double three structure. We update the detailed weekly and daily charts every weekend, or sometimes within the week, for members to understand the long-term path.
Our long-term forecast sees the rally from the October 2022 low as a connector that could lead to the extension of the larger bearish corrective sequence from February 2021. Meanwhile, the last setup on AUDUSD was along the path of the connector—upside. Within the 30-month range, we expected the pair to hit at least 0.6955. With this in mind, we shared a bullish bias with members on the H4 and H1 charts. Let’s look at the latest setup on this pair.
AUDUSD Elliott Wave Analysis. 09/09/2024 Update
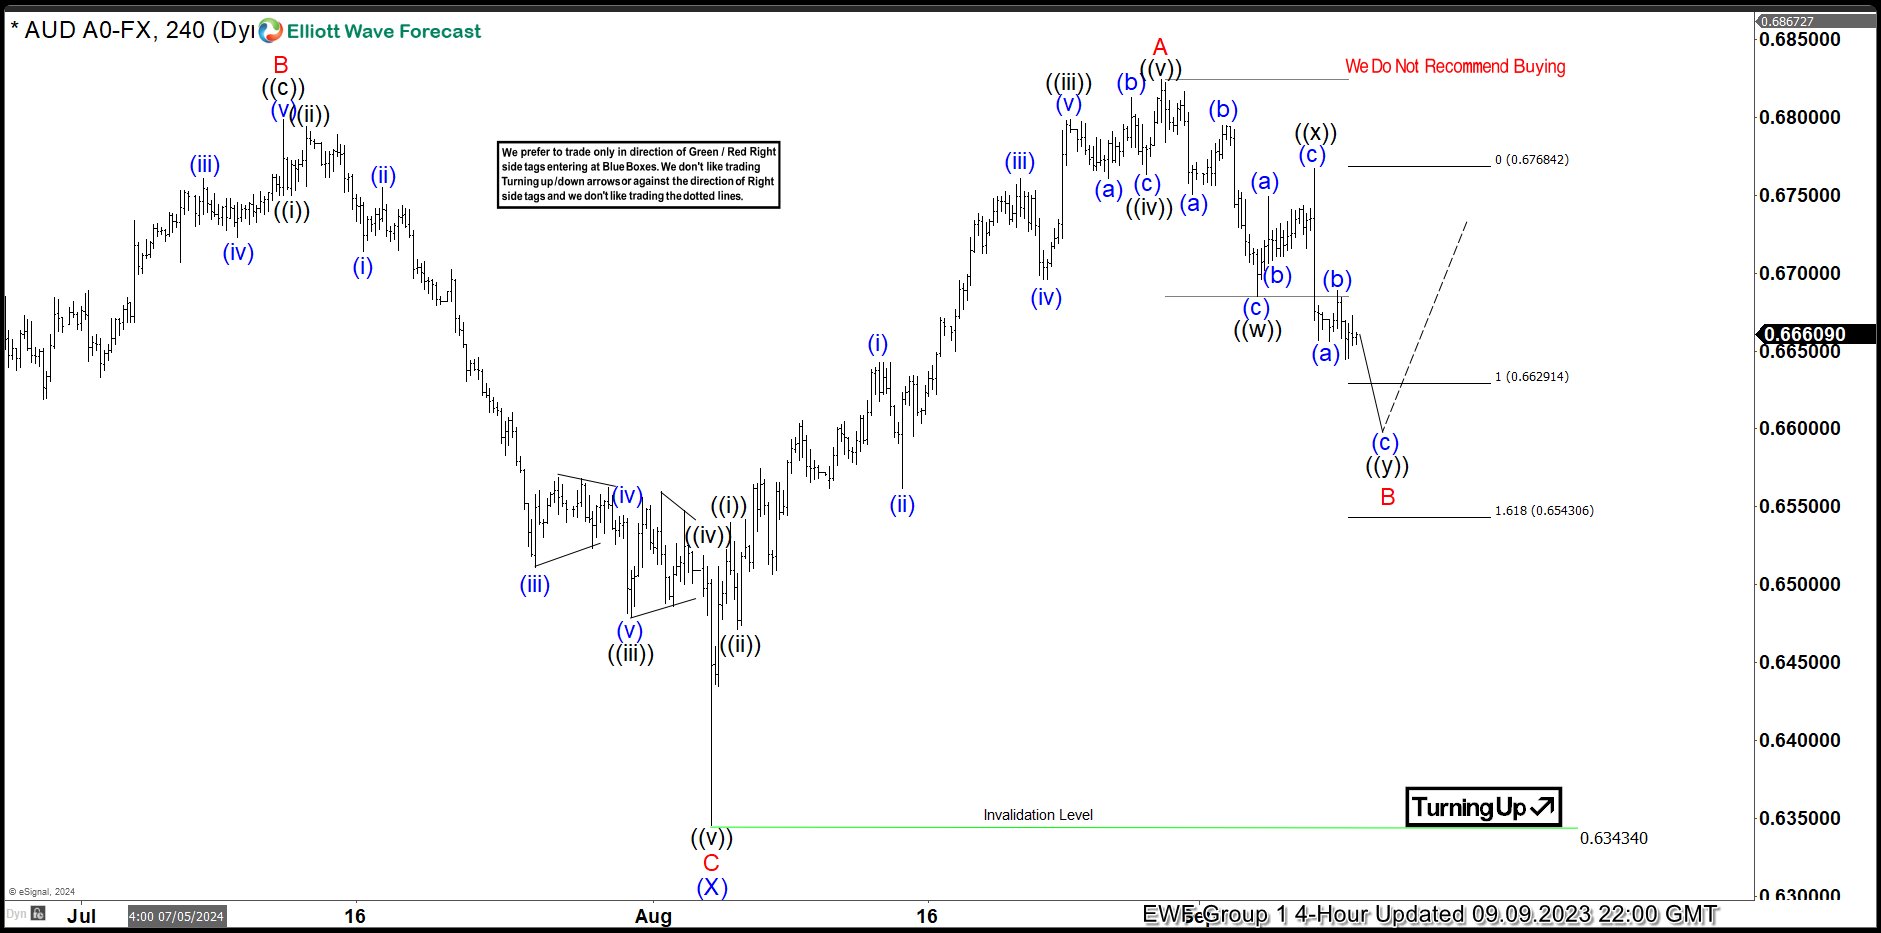
On 09.09.2024, we shared the H4 chart above with members. After the price completed wave (X) of ((X)) on 08.05.2024, it rallied sharply with an impulse structure. We identified the impulse sequence from 08.05.2025 as wave A of (Y) of ((X)). In addition, we identified the pullback that followed as a corrective double three structure, labeled as wave B. Thus, we expected that wave B would find support in the extreme zone between 0.6629 and 0.6543. From the extreme, we anticipated at least a 3-swing bounce. We provided the extreme zone for independent members who would like to buy in this kind of scenario. While that was the path we expected, we would prefer to buy after wave A’s high is breached. Consequently, we can buy the next pullback.
AUDUSD Elliott Wave Analysis. 09/09/2024 Update
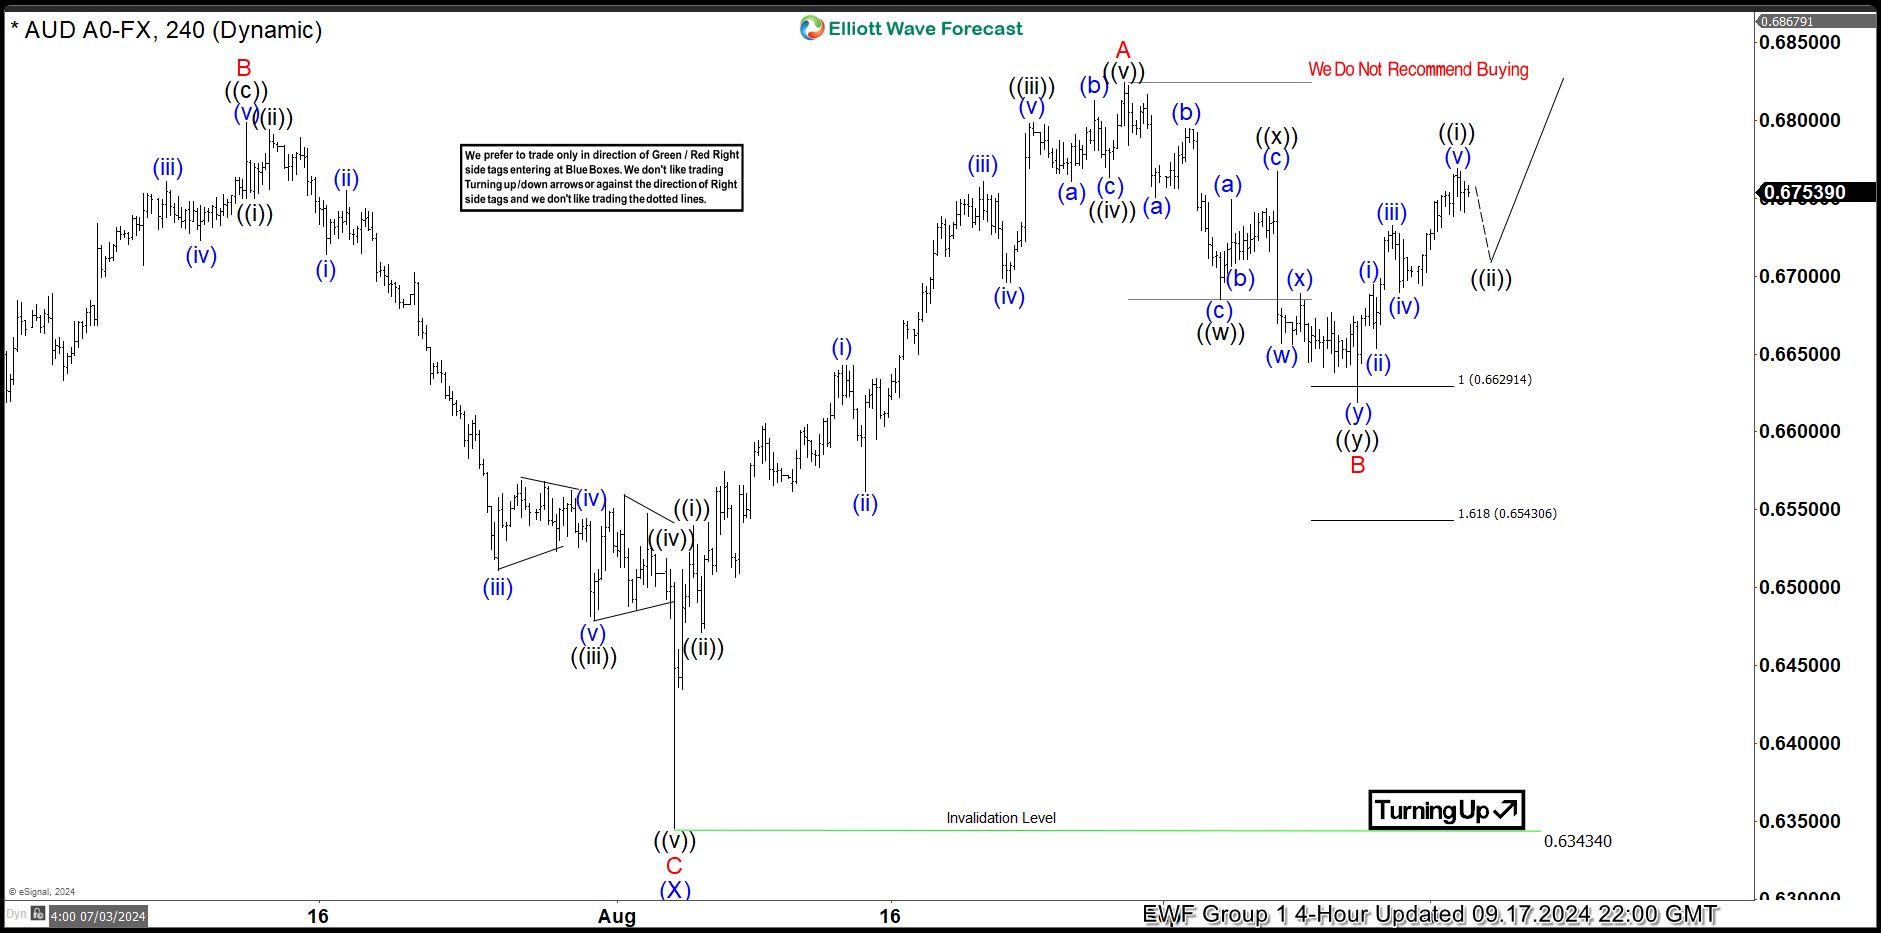
Price reached the extreme as expected, confirming the completion of a double zigzag structure for wave B. Afterwards, an impulse rally followed in wave ((i)) of C. Thus, wave C could extend to 0.7090. Meanwhile, we are expecting a breach of wave A high, opening more room to the upside and confirming that wave B has finished. Afterward, we would like to buy pullbacks when they complete 3, 7, or 11 swings.