
Sample Category Title
EUR/GBP Daily Outlook
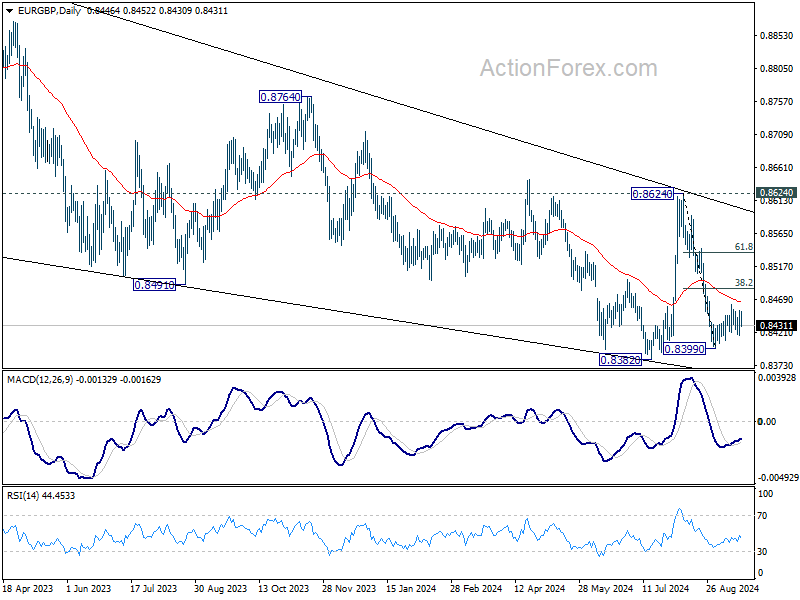
Daily Pivots: (S1) 0.8424; (P) 0.8439; (R1) 0.8460; More...
Intraday bias in EUR/GBP remains neutral and consolidation from 0.8399 could extend further. But upside should be limited by 38.2% retracement of 0.8624 to 0.8399 at 0.8485. On the downside, break of 0.8417 minor support will turn bias to the downside for 0.8399 support, and then 0.8382 low. Firm break there will resume larger down trend. However, sustained break of 0.8485 will bring stronger rally to 61.8% retracement at 0.8538 and possibly above.
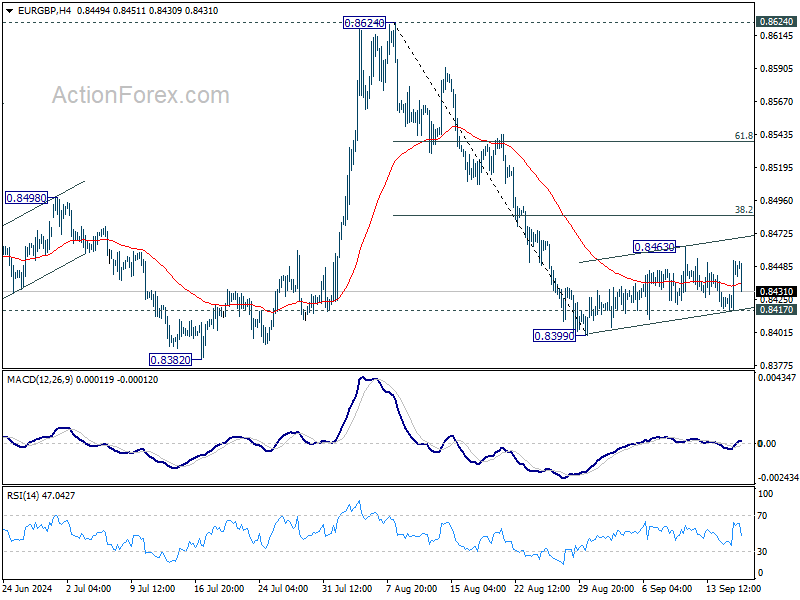
In the bigger picture, as long as 0.8624 resistance holds, down trend from 0.9267 is expected to continue. Firm break of 0.8382 will target 0.8201 (2022 low). However, decisive break of 0.8624 will indicate that such down trend has completed, and turn outlook bullish for 0.8764 resistance next.
EUR/AUD Daily Outlook
Daily Pivots: (S1) 1.6428; (P) 1.6464; (R1) 1.6488; More...
EUR/AUD's break of 1.6457 support argues that recovery from 1.6256 has completed at 1.6629 already. Intraday bias is back on the downside for 1.6256 support first. Firm break there will resume whole fall from 1.7180 to 61.8% projection of 1.7180 to 1.6256 from 1.6629 at 1.6058. For now, risk will be on the downside as long as 1.6629 resistance holds, in case of recovery.
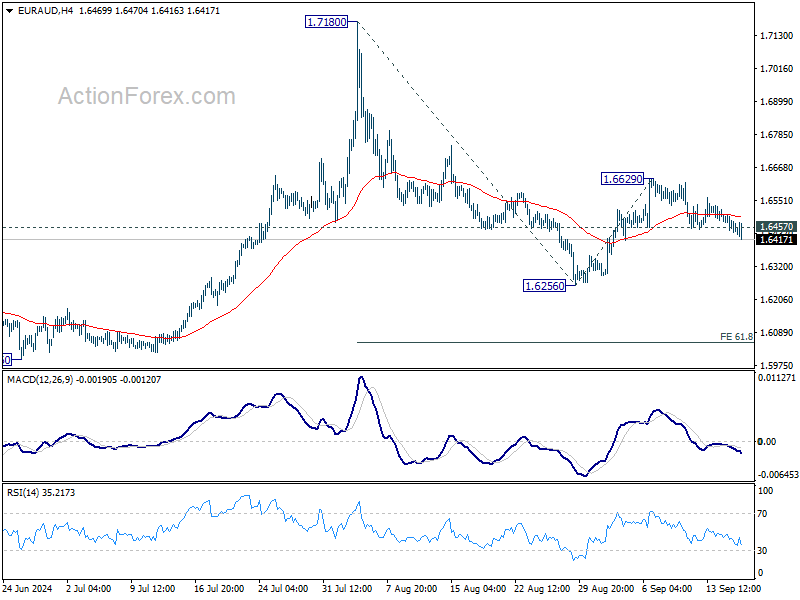
In the bigger picture, outlook is mixed up by the deeper than expected fall from 1.7180. Yet as long as 1.5996 support holds, up trend from 1.4281 (2022 low) is still in favor to resume at a later stage. Firm break of 1.7180 will pave the way to 61.8% projection of 1.4281 to 1.7062 from 1.5996 at 1.7715.

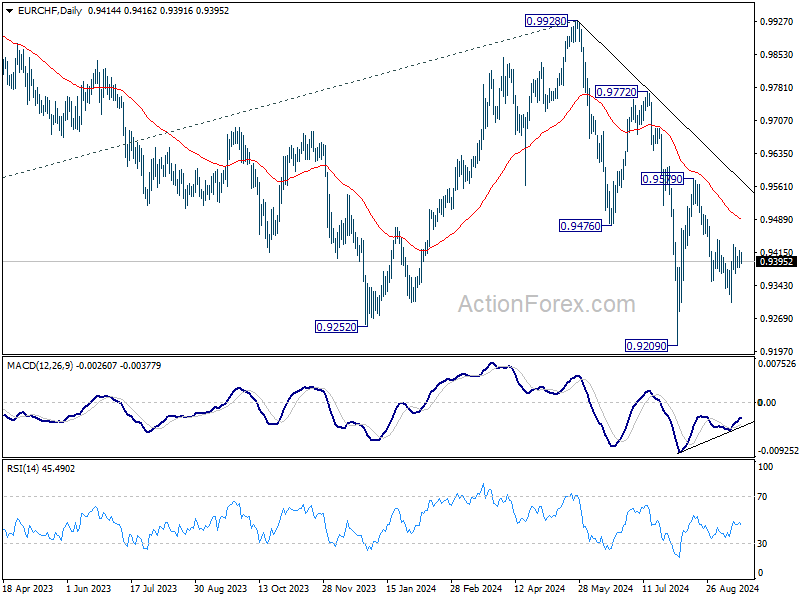
EUR/CHF Daily Outlook
Daily Pivots: (S1) 0.9393; (P) 0.9407; (R1) 0.9432; More....
Intraday bias in EUR/CHF remains neutral for the moment. With 0.9444 resistance intact, further decline is in favor. On the downside, below 0.9305 will resume the fall from 0.9579 to retest 0.9209 low. Firm break there will resume larger down trend. However, decisive break of 0.9444 will argue that the fall from 0.9579 has completed as a corrective move. Intraday bias will be turned bias to the upside for 0.9579.
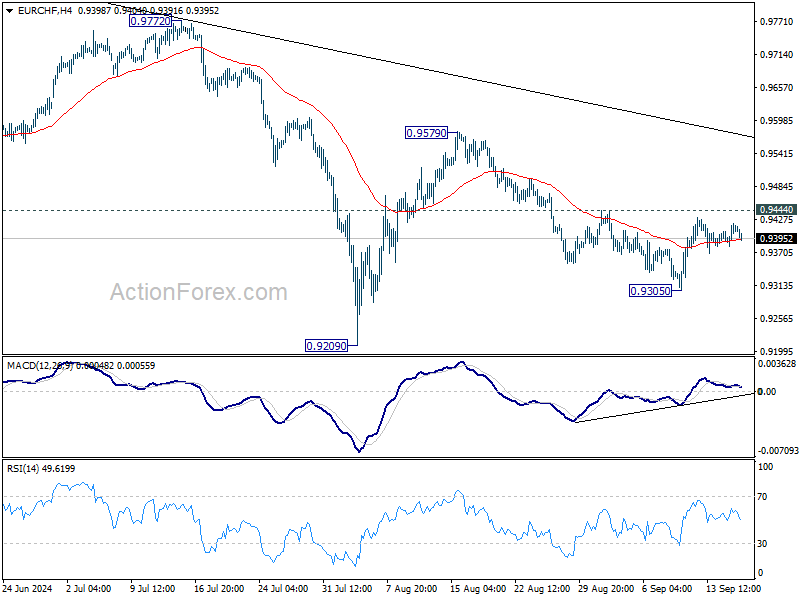
In the bigger picture, medium term corrective pattern from 0.9407 (2022 low) might have completed with three waves to 0.9928. Decisive break of 0.9252 (2023 low) will confirm long term down trend resumption. Next target will be 61.8% projection of 1.1149 to 0.9407 from 0.9928 at 0.8851. For now, outlook will stay bearish as long as 0.9928 resistance holds, even in case of strong rebound.
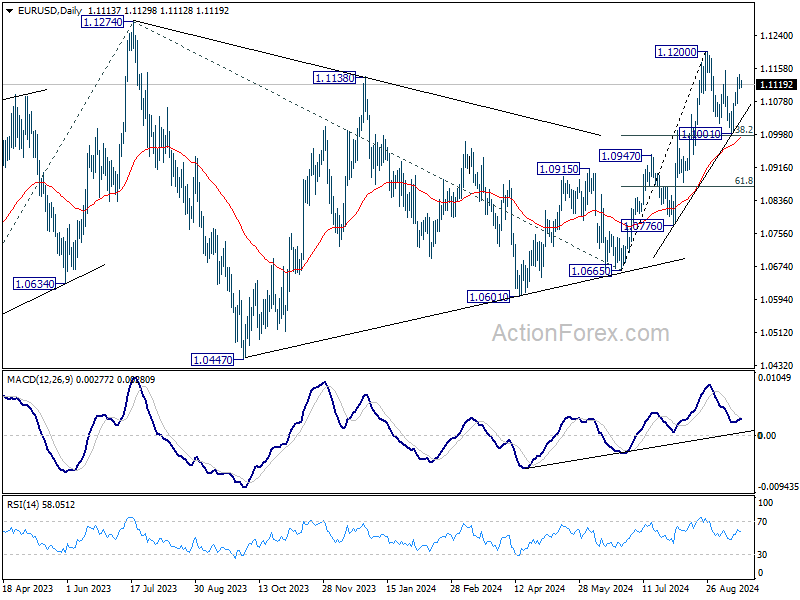
EUR/USD Daily Outlook
Daily Pivots: (S1) 1.1101; (P) 1.1124; (R1) 1.1136; More....
Range trading continues in EUR/USD and intraday bias remains neutral. On the upside, break of 1.1153 resistance will suggest that later rally is ready to resume and target 1.1200, and then 1.1274 high. On the downside, below 1.1072 minor support will turn bias back to the downside for 38.2% retracement of 1.0665 to 1.1200 at 1.0996 again.
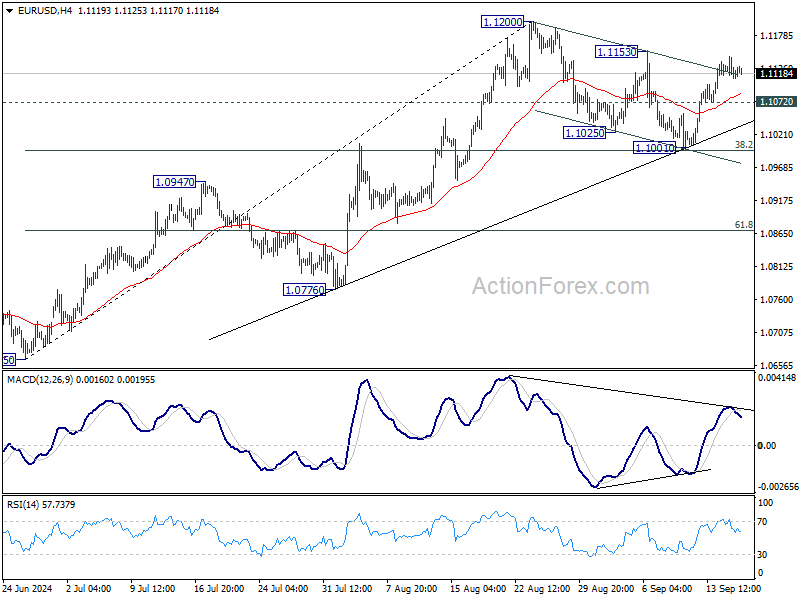
In the bigger picture, prior break of 1.1138 resistance indicates that corrective pattern from 1.1274 might have completed at 1.0665 already. Decisive break of 1.1274 (2023 high) will confirm whole up trend from 0.9534 (2022 low). Next target will be 61.8% projection of 0.9534 to 1.1274 from 1.0665 at 1.1740. This will now be the favored case as long as 1.0947 resistance turned support holds.
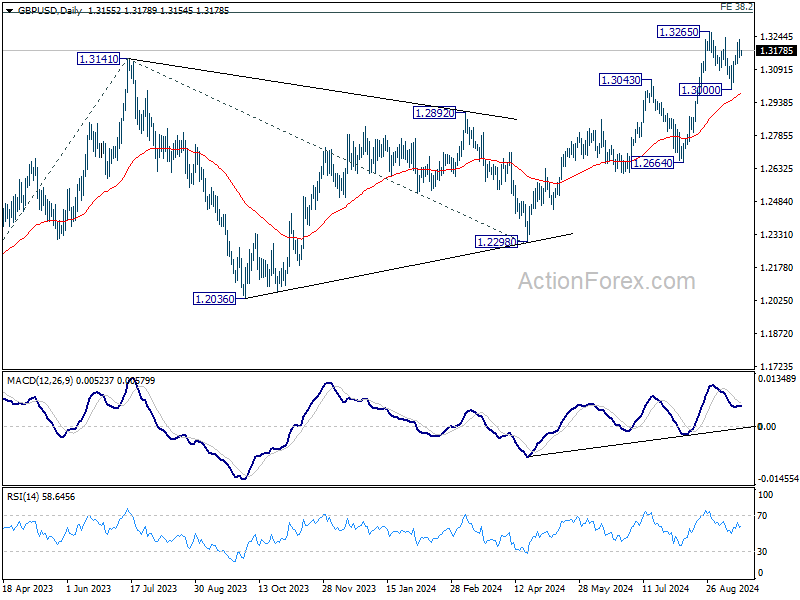
GBP/USD Daily Outlook
Daily Pivots: (S1) 1.3127; (P) 1.3178; (R1) 1.3211; More...
Intraday bias in GBP/USD remains neutral for the moment. On the upside, decisive break of 1.3265 will resume larger rally 1.3364 projection level next. On the downside, below, 1.3177 minor support will turn bias to the downside, to extend the correction from 1.3265 through 1.3000 support.
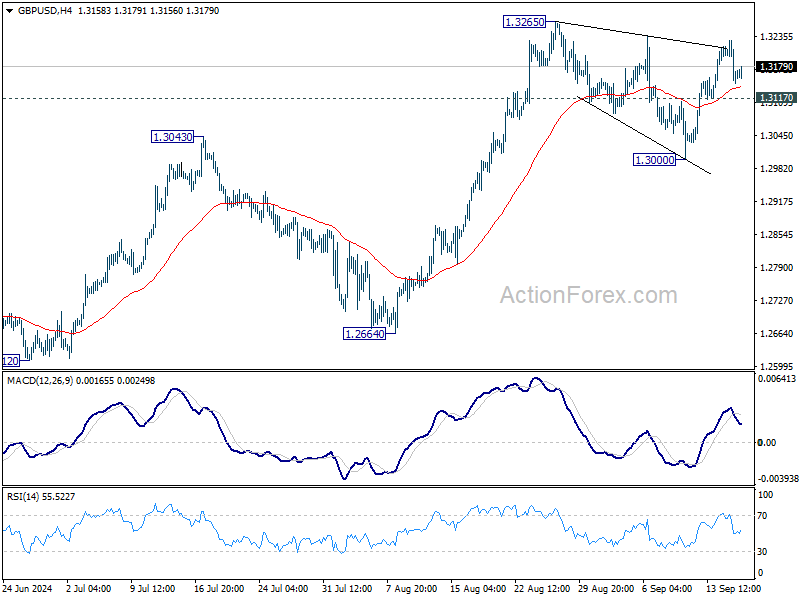
In the bigger picture, up trend from 1.0351 (2022 low) is in progress. Next target is 38.2% projection of 1.0351 to 1.3141 from 1.2298 at 1.3364. For now, outlook will stay bullish as long as 1.2664 support holds, even in case of deep pullback.
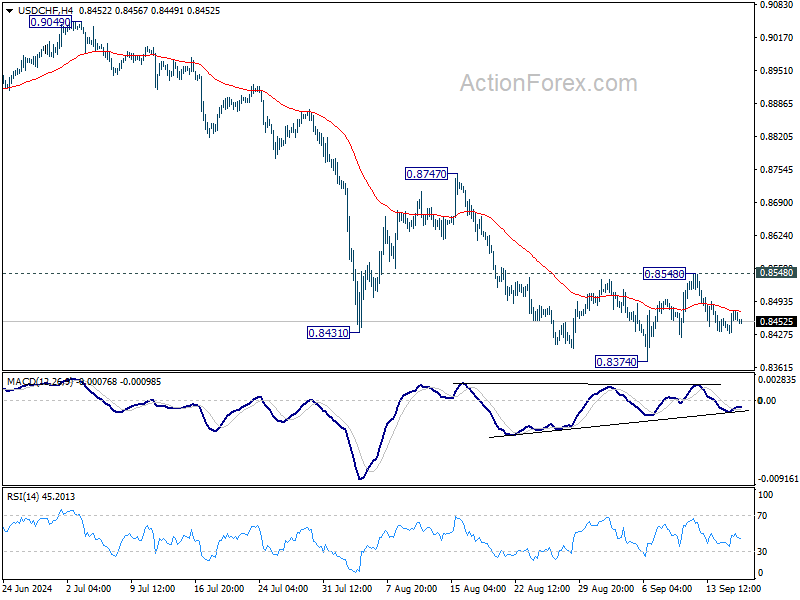
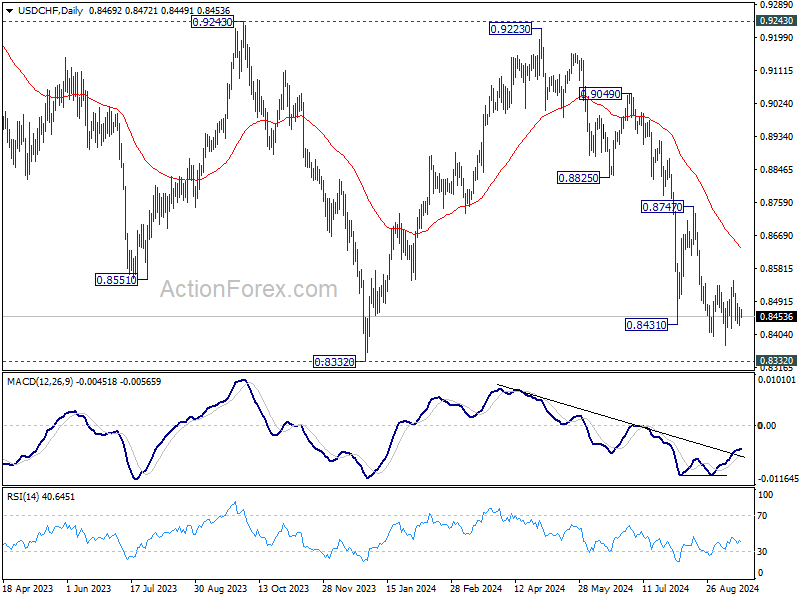
USD/CHF Daily Outlook
Daily Pivots: (S1) 0.8443; (P) 0.8460; (R1) 0.8490; More…
Intraday bias in USD/CHF stays neutral as range trading continues. With 0.8548 resistance intact, further decline is still expected. On the downside, break of 0.8374 will resume the fall from 0.9223 to retest 0.8332 low. Decisive break there will indicate larger down trend resumption. However, considering bullish convergence condition in 4H MACD, break of 0.8548 resistance will confirm short term bottoming, and turn bias back to the upside for 0.8747 resistance.
In the bigger picture, price actions from 0.8332 (2023 low) are currently seen as a medium term corrective pattern, with fall from 0.9223 as the second leg. Strong support could be seen from 0.8332 to bring rebound. Yet, overall outlook will continue to stay bearish as long as 0.9243 resistance holds. Firm break of 0.8332, however, will resume larger down trend from 1.0146 (2022 high).
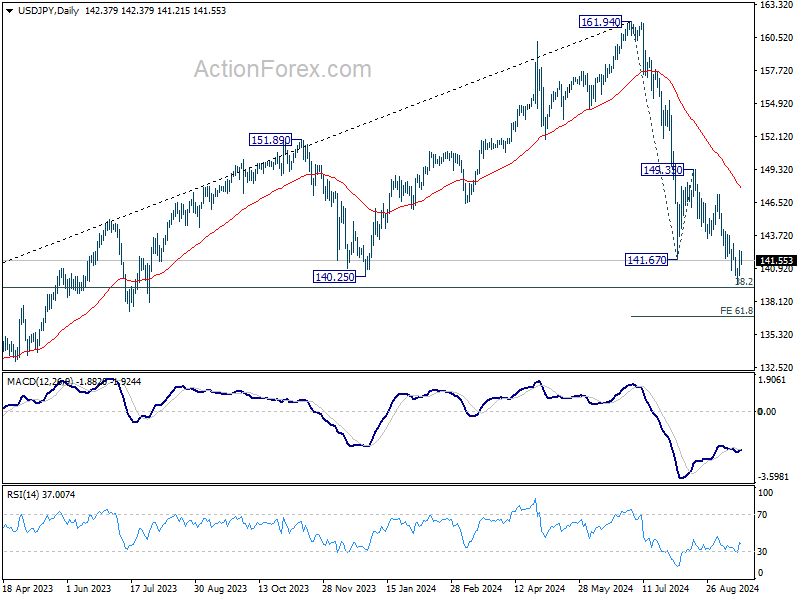
USD/JPY Daily Outlook
Daily Pivots: (S1) 141.01; (P) 141.74; (R1) 143.16; More...
Intraday bias in USD/JPY remains neutral for the moment. Considering bullish convergence condition in 4H MACD, break of 143.03 resistance will indicate short term bottoming and turn bias back to the upside for rebound towards 147.20. However, decisive break of 139.26 fibonacci level would carry larger bearish implications, and target 61.8% projection of 161.94 to 141.67 from 149.35 at 136.82 next.
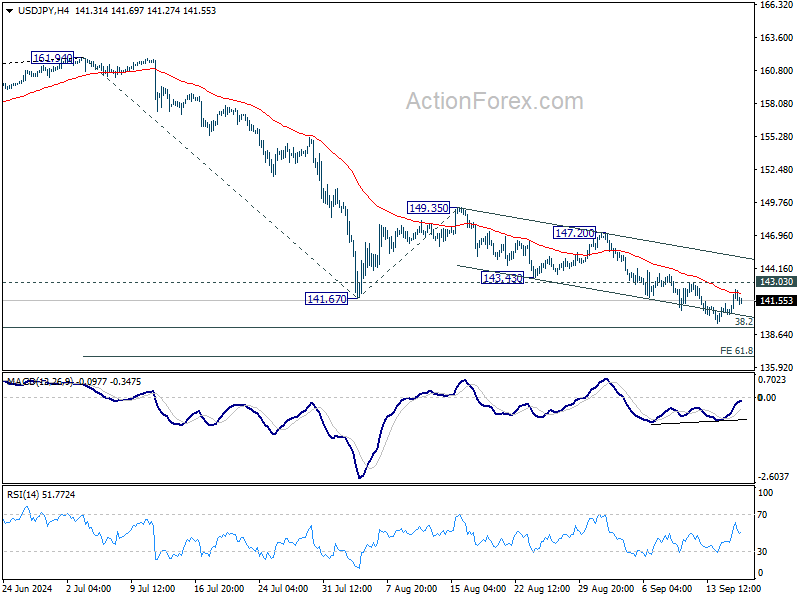
In the bigger picture, fall from 161.94 medium term top is seen as correcting whole up trend from 102.58 (2021 low). Strong support could be seen from 38.2% retracement of 102.58 to 161.94 at 139.26 to contain downside, at least on first attempt. But in any case, risk will stay on the downside as long as 149.35 resistance holds. Sustained break of 139.26 would open up deeper medium term decline to 61.8% retracement at 125.25.
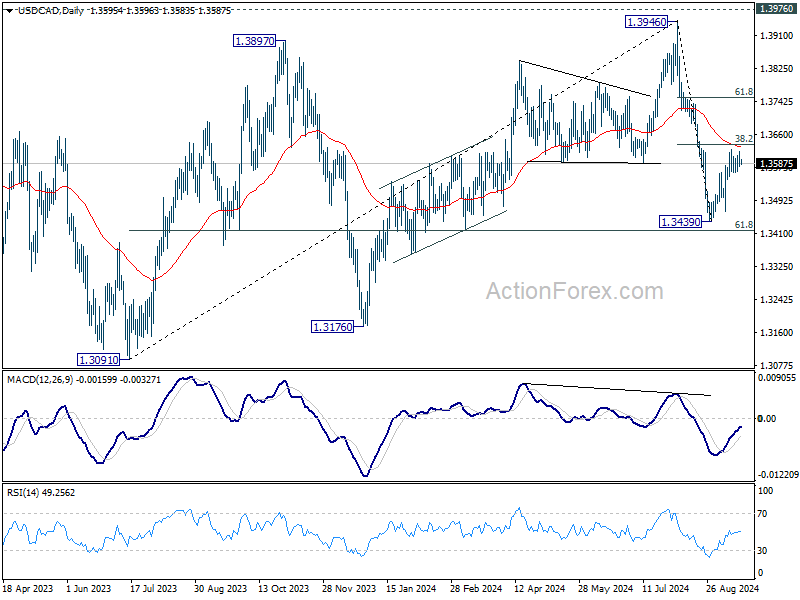
USD/CAD Daily Outlook
Daily Pivots: (S1) 1.3580; (P) 1.3598; (R1) 1.3617; More...
USD/CAD is still extending sideway trading and intraday bias remains neutral. On the downside, below 1.3545 minor support will suggest that recovery from 1.3439 has completed, turn bias to the downside for retesting this low. Nevertheless, decisive break of 38.2% retracement of 1.3946 to 1.3439 at 1.3633 would argue that the decline from 1.3946 has completed. Stronger rally would then be seen to 61.8% retracement at 1.3752 and above.
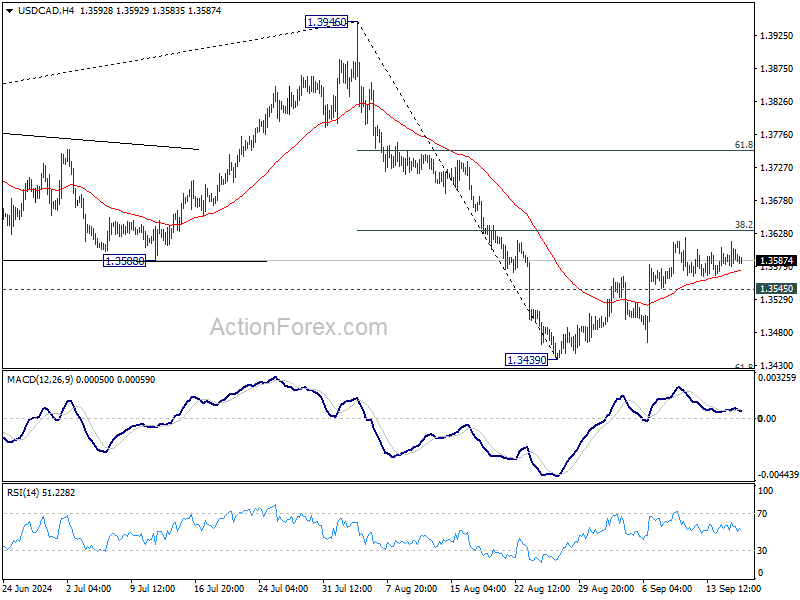
In the bigger picture, corrective pattern from 1.3976 (2022 high) is extending with another falling leg. While deeper decline could be seen, strong support should emerge above 1.2947 resistance turned support to bring rebound. Rise from 1.2005 (2021 low) is still in favor to resume at a later stage.
UK CPI unchanged at 2.2%, core CPI rises to 3.6%, services accelerates to 5.6%
UK inflation data for August came in as expected, with headline CPI remaining unchanged at 2.2% yoy, in line with forecasts. Meanwhile, core CPI, which excludes volatile items such as energy, food, alcohol, and tobacco, showed accelerated from 3.3% yoy to 3.6% yoy.
The breakdown of the data reveals a mixed picture. Goods prices continued to decline, with CPI for goods falling from -0.6% yoy to -0.9% yoy. However, services inflation moved higher, rising from 5.2% yoy to 5.6% yoy, indicating persistent domestic price pressures.
The main driver of the inflationary uptick was airfares, which rose this year after a drop in prices during the same period last year. On the downside, motor fuels, restaurants, and hotels contributed to the moderation of price pressures.
On a monthly basis, CPI increased by 0.3% mom, also meeting expectations.
While BoE is widely expected to hold rates unchanged tomorrow, the rise in core inflation, particularly in services, could lead to more caution regarding future rate cuts if inflation proves to be stickier than anticipated.
Will FOMC Cut by 25 or 50bp?
In focus today
Today's main event will be the FOMC rate decision at 20:00 CET - we expect a 25bp cut of the Fed Funds Rate target (to 5.00-5.25%). This morning markets price in a 65% probability for an even bigger 50bp rate cut. Even though the Fed will now initiate its rate cutting cycle, we do not expect changes to the pace of QT. We expect the updated rate projections to signal a total of 3x25bp rate cuts in 2024 (prev. 1) followed by 6x25bp cuts in 2025 (prev. 4). See Research US - Fed preview: Dovish 25bp, 13 September.
In the euro area, we receive the final inflation data for August. The release will allow us to investigate the inflation drivers in August and we particularly look out for the 'LIMI' indicator of domestic inflation. Recently, domestic inflation has remained high and is a key reason we expect only a gradual cutting approach from the ECB.
From Sweden, August LFS is out this morning, expected to show a slight increase in seasonally adjusted unemployment to 8.5%. More interesting however is to gauge the developments in employment and hours worked as these give clues to household income growth and production activity. Both these factors surprisingly dropped in July, but we expect a bounce back now.
Economic and market news
What happened yesterday
In the US, retail sales increased by 0.1% (prior: 1.0%, consensus: -0.2%) in August, so a slight increase instead of a slight decrease. This signals that consumer spending remains stable. Industrial production came in stronger than expected at 0.8% (prior: -0.9%, consensus: 0.2%). We do not expect these numbers to affect the rate decision today, where our base case is a 25 bp rate cut, as stated above.
In Germany, the ZEW index declined more than expected in September. The expectations component plunged to the lowest level in a year while the assessment of the current situation component fell to the lowest level since Covid. The assessment of the current situation has been stuck at very low levels during the past year and the expectations component has now fallen in the past three months following a strong rebound in spring.
In Canada, consumer prices rose 2.0% y/y in August (prior: 2.5%, consensus: 2.1%), and fell by 0.2% m/m (prior: 0.4%, consensus: unchanged). The weaker than expected inflation print has led to some market speculation that the Bank of Canada (BoC) could be in for a 50bp rate cut at the October meeting. At the monetary policy announcement earlier this month BoC governor Macklem said that the central bank must increasingly gauge against the potential of inflation falling below target due to weak economic growth. Markets still price in biggest probability for a 25bp cut, but the probability of a 50bp rate cut rose from 46% to around 47.5% after the release.
Equities: Global equities were fractionally higher yesterday yet remained in a state of wait-and-see ahead of tonight's highly anticipated FOMC meeting. Despite this, the sentiment leading up to the FOMC meeting has been positive, with the S&P 500 surpassing its mid-July peak. Yesterday also saw a decent cyclical outperformance, bolstered by a positive reception to a potential 50bp cut as small caps outshone others. In the US yesterday, Dow -0.04%, S&P 500 +0.03%, Nasdaq +0.2% and Russell 2000 +0.7%. Asian markets were mixed this morning, with Japan making up some of yesterday's losses. US futures were marginally higher, while European futures edged lower.
FI: The main event today is the FOMC meeting tonight to see whether the Federal Reserve will cut by 25bp or 50bp as well as the comments regarding future monetary policy. The market is divided between a 25bp or 50bp rate cut, as there are pros and cons for both a 25bp or 50bp rate cut. We believe it will be a 25bp cut, but a positive market reaction depends on the comments after the meeting. If the Federal Reserve cuts "only" by 25p it is expected that they will strike a dovish tone afterwards.
FX: Yesterday's session was generally muted, with no notable moves in the G10 space, as markets await the crucial FOMC meeting today. The USD strengthened slightly, with EUR/USD remaining just above 1.11, while USD/JPY drifted back above 142. Scandies were little changed, with EUR/NOK just below 11.80 and EUR/SEK just above 11.30. Markets are clearly waiting for the FOMC decision, which could potentially set the near-term tone for various crosses and overall risk sentiment.