Sample Category Title
USD/JPY Rebounds After US Retail Sales Beats Estimate
The Japanese yen is down sharply on Tuesday. USD/JPY is up 0.73% today, trading at 141.64 in the North American session at the time of writing. On Monday, the yen pushed below 140 per dollar for the first time since July 2023.
The yen has looked razor sharp, gaining 2.9% in the month of September alone. The yen has surged a massive 15% in the third quarter, the best-performing G-10 currency. The Federal Reserve is virtually certain to raise interest rates by at least 25 basis points on Wednesday. The Bank of Japan, which meets on Friday, is expected to keep rates on hold. The BoJ has been an outlier among the major central banks and is expected to continue tightening, which has boosted the yen. The BoJ has signaled that further rate hikes are coming and this could occur as soon as December.
US retail sales slip but beat estimate
In the US, today’s retail sales release was the final key event ahead of the Federal Reserve meeting. Retail sales softened in August but the decline wasn’t as sharp as expected. Monthly, retail sales posted a small gain of 0.1% in August, down from a revised 1.1% in July but still better than the market estimate of -0.2%. On an annualized basis, retail sales eased to 2.1%, down from 2.9% in July and just below the forecast of 2.2%.
The retail sales release is not expected to impact the Federal Reserve decision on Wednesday. The rate cut odds for a half-point cut stand at 67% according to the CME’s FedWatch tool, unchanged by the retail sales release.
USD/JPY Technical
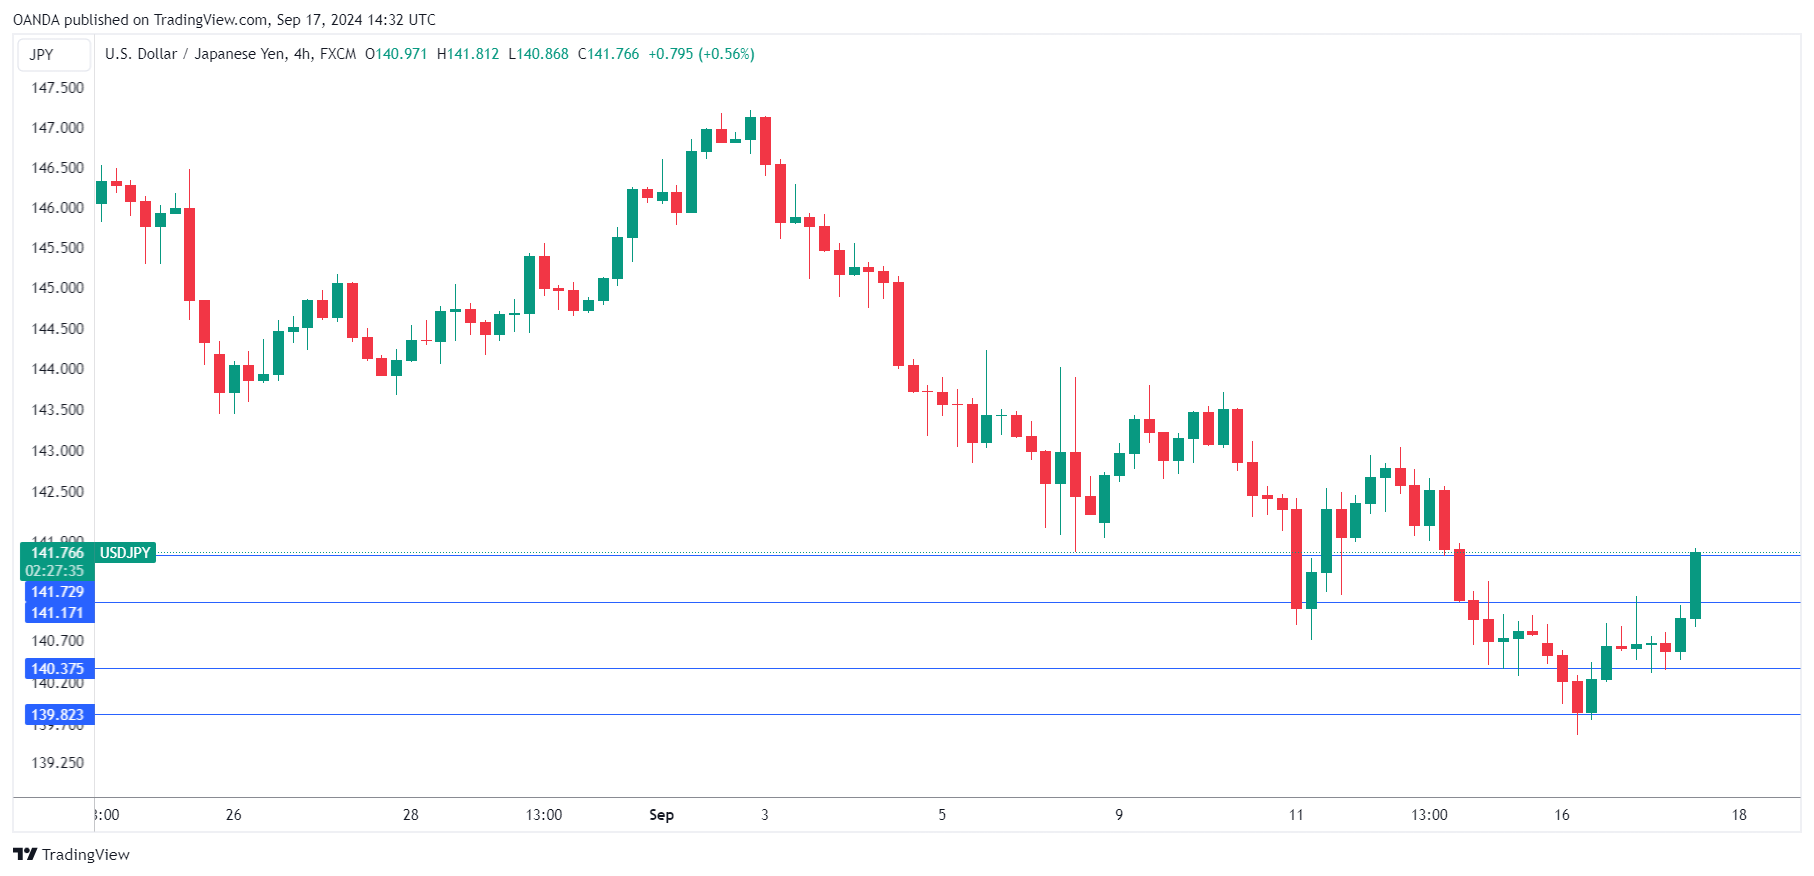
- USD/JPY pushed above 141.17 earlier and is testing resistance at 141.72
- There is support at 140.37 and 139.82
USD/CAD Steady after Canada’s CPI Slips to 2%
The Canadian dollar is showing limited movement on Tuesday. Early in the North American session, USD/CAD is trading at 1.3601 at the time of writing, up 0.10% today.
Canada’s CPI declines more than expected
Canada’s inflation rate dropped to 2% in August. This was down sharply from 2.5% in July and below the market estimate of 2.1%. Monthly, inflation declined by 0.2%, down from a 0.4% gain in July and shy of the market estimate of zero. The core rate declined to -0.1% down from 0.3% in July. Yearly, the average of two key core indicators eased to 2.35%, down from 2.55% in July.
The Bank of Canada has done a good job bringing down inflation and today achieved its target of 2%. The central bank has already cut rates three times as part of the new rate-cutting cycle in response to falling inflation and today’s CPI report lends support to further rate cuts. The battle with inflation is largely over and the BoC has shifted its primary focus away from inflation onto the labor market.
The August jobs report was a mix, as job growth rebounded with a 22.1 thousand gain in August after a decline of 2.8 thousand in July, which was within expectations. However, the unemployment rate rose to 6.5%, up from 6.4% and above the market estimate of 6.5%.
In the US, today’s retail sales report marked the final tier-1 event before the key Federal Reserve meeting on Wednesday. Retail sales lost steam in August but the drop wasn’t as bad as expected. Monthly, retail sales posted a small gain of 0.1% in August, down from a revised 1.1% in July but above the market estimate of -0.2%. On an annualized basis, retail sales eased to 2.1%, down from 2.9% in July and just below the forecast of 2.2%.
The retail sales release is not expected to impact the Federal Reserve decision on Wednesday. The rate cut odds for a half-point cut stand at 67% according to the CME’s FedWatch tool, unchanged by the retail sales release.
USD/CAD Technical
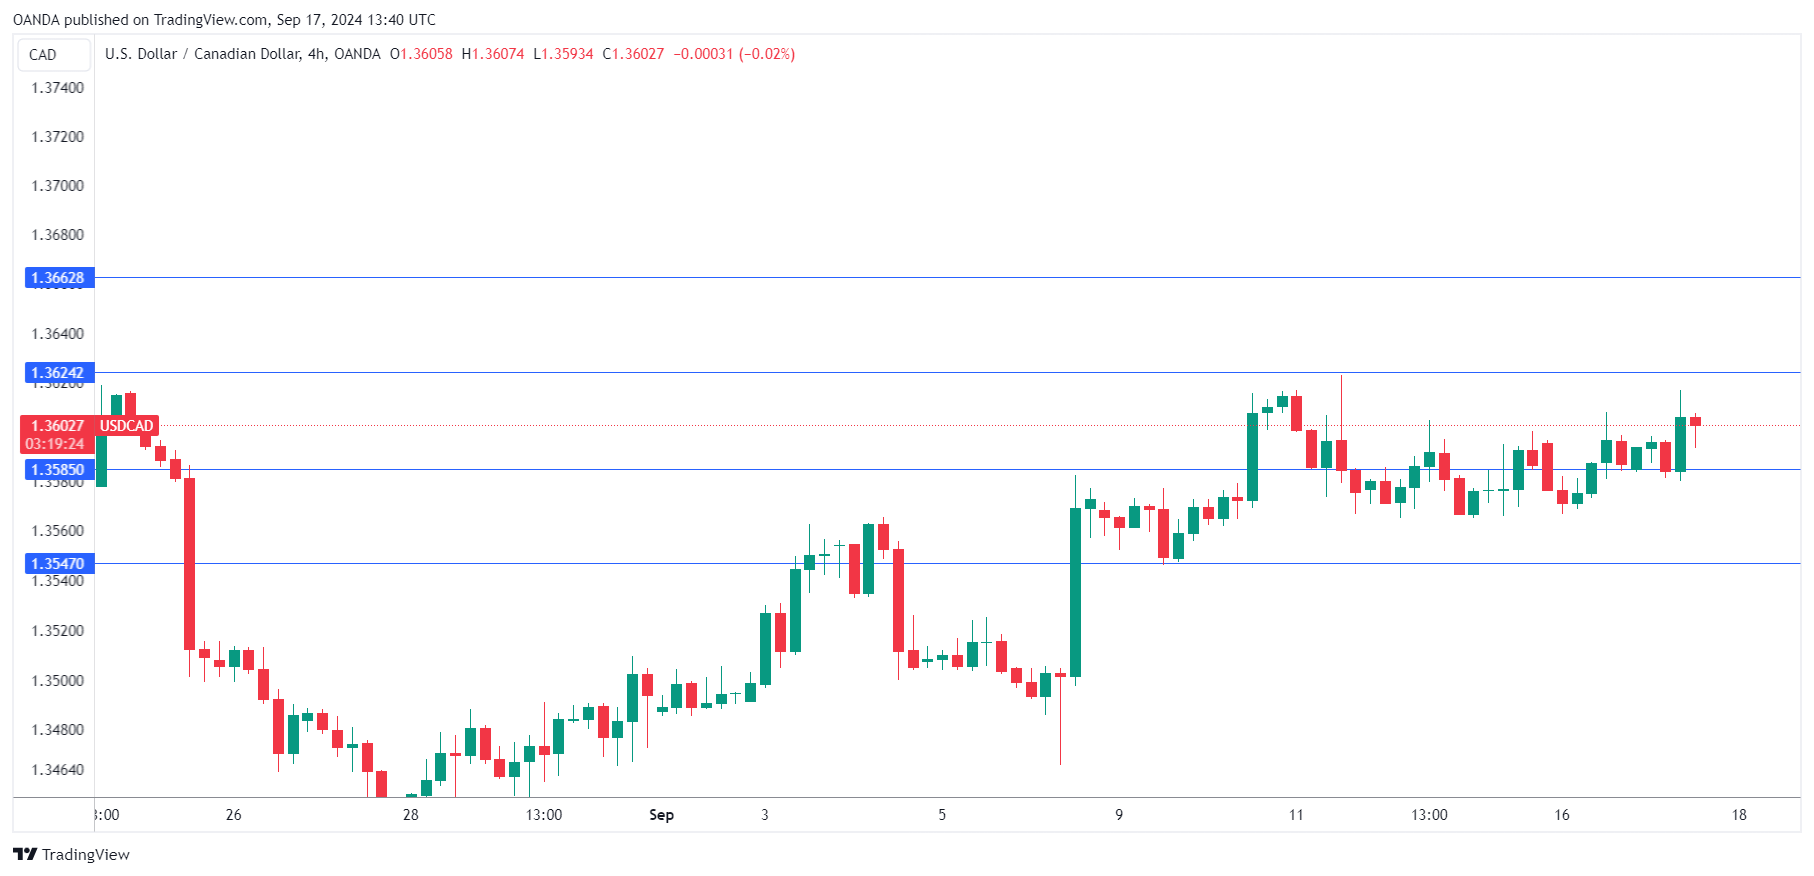
- USD/CAD is testing support at 1.3585. Below, there is support at 1.3547
- 1.3624 and 1.3662 are the next resistance lines
Sharply Deteriorating Business Sentiment in Germany
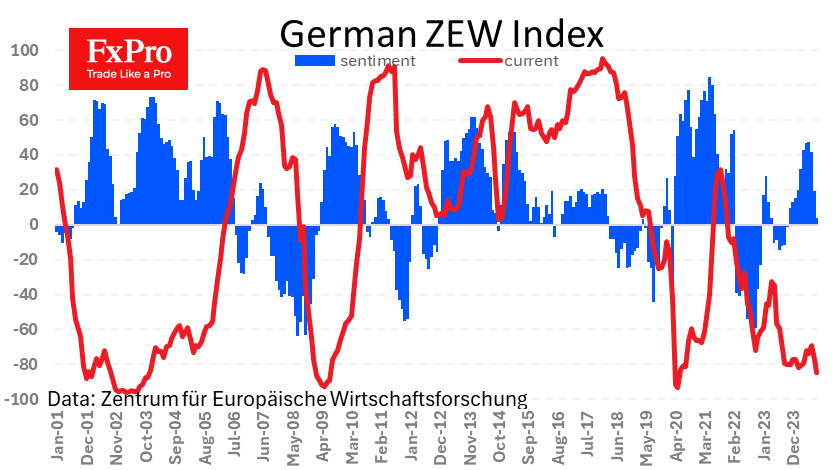
German business sentiment deteriorated sharply in September, according to ZEW data. The relevant index fell to 3.6, the lowest level since October 2023. The situation was even worse for the component assessing current conditions, which fell to -84.5, the lowest since 2020 and near the historic low.
The three-month downtrend in the sentiment index has erased eight months of smooth recovery, which began after the current conditions assessment reversed from improvement to deterioration in June. The short-term negative impact on the euro is amplified by the significant divergence from expectations, as a decline to only 17.1 was expected instead of the actual 3.6.
The extent of the deterioration in sentiment raises the question of whether the ECB will accelerate monetary easing after last Thursday’s rate cut. Interestingly, with objectively stronger macroeconomic data and higher inflation in the US, there is a 67% probability that the Fed will immediately cut the Fed Funds rate by 50 basis points on Wednesday.
Thus, a more decisive monetary easing is expected from the US, which is giving a positive boost to the EUR/USD, which climbed to 1.1145 on Tuesday before the release of the ZEW figures. If the Fed confirms market expectations, the single currency’s appreciation could continue despite objectively weaker macroeconomic data from Europe.
The trade balance figures paint a more insidious picture. The surplus exceeded expectations and remains high by historical standards, although it has narrowed somewhat in recent months. This is not compared to the near-historic record deficits in the US and the UK, which works in the euro’s favour. However, the significant 24% decline in exports over the past two years and a 4% decline in imports from the peak also reached almost two years ago cannot be overlooked.
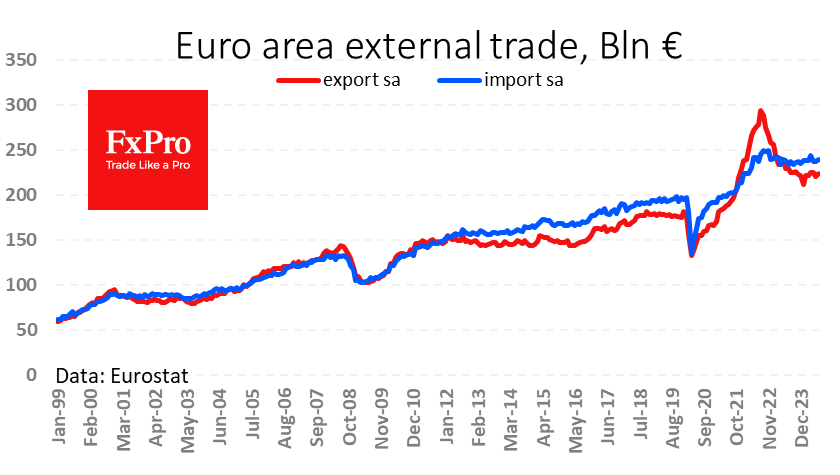
The weakness in industrial production in recent months suggests that exports will fall further. The euro’s appreciation is becoming an additional factor reducing the competitiveness of the euro area economy. If the ECB manages to overcome the hawks’ resistance, it could adopt an even softer monetary policy stance.
Sunset Market Commentary
Markets
US August retail sales served as some final input for tomorrow’s pivotal Fed meeting in a trading session that was otherwise simply the waiting game part 2. The series surprised to the upside on a headline level (0.1% m/m vs -0.2% expected). Core gauges printed close to or slightly below consensus with the control group (ex. food, building materials, car dealers and gas) rising 0.3%. Combined with some marginal upward revisions to both the July headline (1.1%) and control group (0.4%) series, we’d consider the release as a small beat of consensus. That triggered a little profit-taking spike in US yields, in particular at the front end, of which we doubt it’ll last through the US session. We suspect some technical influence as well with the likes of the 2-yr yield trading near the March 2023 support level ahead of the US retail sales release. Either way, money markets have positioned for the Fed and don’t plan to move around much. A 50 bps cut is still for 70% discounted. US yield changes vary between -0.8 (30-yr) to 3.7 bps (2-yr). German yields slid at the open before paring a significant chunk of or in some cases even fully recovering from the previous losses in choppy, directionless trading. Current moves range from -0.1 (30-yr) to +2.7 bps (2-yr) in a curve flattener. Industrial production numbers printed slightly better than expected too (+0.8% m/m vs 0.2% expected) but left an even smaller stamp on trading.
A separate bullet point for FX markets seems a bit unnecessary today. EUR/USD traded an extremely tight sideways range between 1.1120 and 1.1140. DXY tested the 100.6 support zone but prevents a break (for now). USD/JPY gains a few ticks to fill bids back above 141. 0.842-0.843, that was it for EUR/GBP today.
News & Views
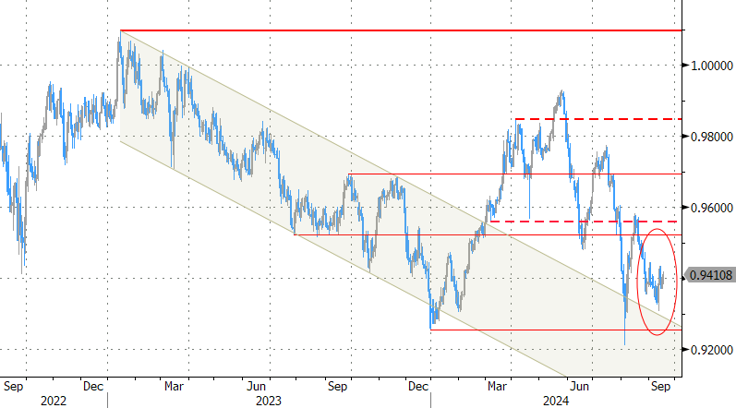
An article published by news agency Bloomberg reports that Swiss watchmakers are urging the Swiss National Bank (SNB) and the government to take measures to cope with the strength of the Swiss franc. More specifically, the federation of the Swiss Watch Industry analyses that with inflation well below the 2% target, the SNB has room to maneuver and act on the foreign exchange market. It apparently also wants to SNB to reconsider currency interventions as it states that ‘an ad hoc and more reactive approach would make it possible to reduce volatility in the Swiss franc’. The calls come as a strong valuation of the franc coincides with easing global demand for some costly items, including watches. The SNB will have its next quarterly policy meeting on September 26. It cut its policy rate at the previous two meetings by 25 bps to currently 1.25% as inflation decisively returned to the 0.0%-2.0% target range. With both headline and core inflation at 1.1% Y/Y in August, the SNB is likely to ease policy further in September. Some market participants even raised the odds that Swiss franc strength could force the SNB to deliver a 50 bps cut later this month (+/- 40 chance discounted). After spiking to an all-time low near EUR/CHF 0.92 in the early august risk-off (except for the temporary spike after the removal of the CHF-cap early 2015), EUR/CHF currently trades near 0.94. This probably is stronger than what the SNB considers necessary to hold inflation in the middle of its target range.
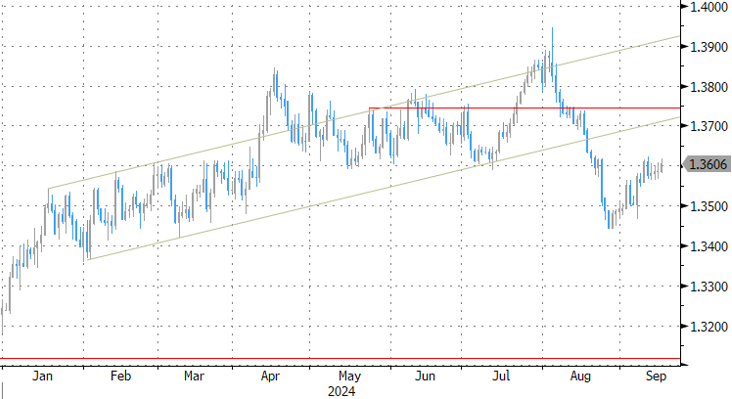
Inflation in Canada in August declined 0.2% M/M bringing the Y/Y measure back tot the 2.0% target of the Bank of Canada for the first time since February 2021. The monthly decline in prices was rather broad-based with goods prices declining 0.3% compared to July, services prices easing -0.1% M/M and energy prices declining 1.6% M/M. Price growth in items related to shelter (0.4%) remains one of the components hampering the disinflation process. Core measures of inflation still eased further (core median from 2.4% to 2.3% Y/Y, core trimmed from 2.7% to 2.5%). The reaction of Canada yield markets to the release was modest (2-y bond yield -1.0 bp). Money markets now see an almost even chance for the BoC to step up the pace of easing from 25 bps to 50 bps at the October meeting as the BoC is giving more weight to the excess supply in the economy. In deciding on a bigger move, tomorrow’s Fed decision will also play an important role. The loonie eased modestly after the CPI release with USD/CAD moving back above the 1.36 barrier from 1.358 before the release.
Graphs
EUR/CHF: ongoing CHF strength is frustrating increasing part of Swiss corporate life
USD/CAD: loonie eases marginally after at-target CPI raises odds for bigger BoC cut in October
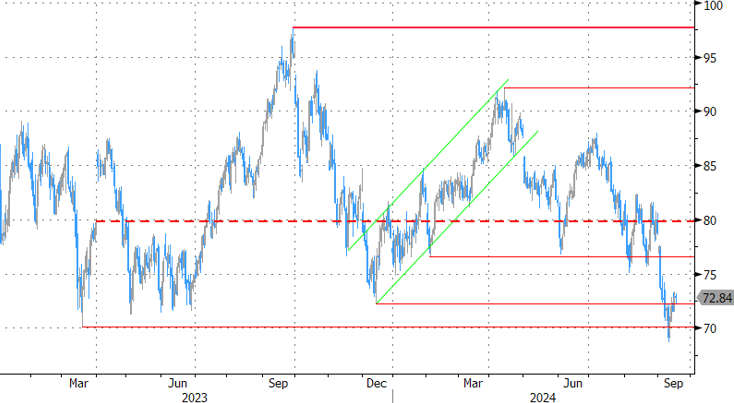
Brent oil took out a first minor resistance level but is now seeking catalysts for a further rebound from the recent lows
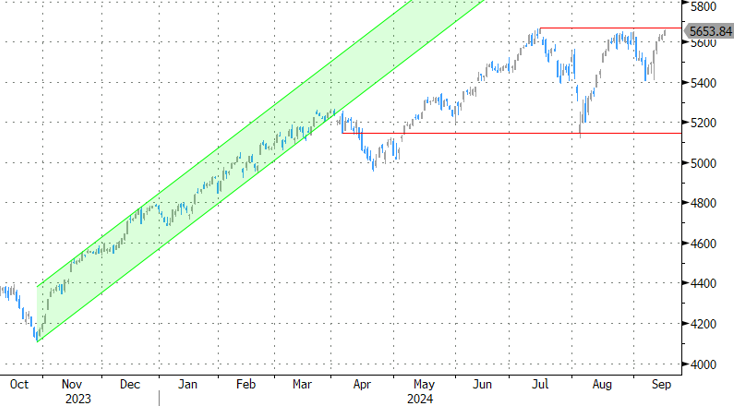
Slightly better than expected US retail sales push S&P500 on the verge of a new record high
EUR/USD Mid-Day Outlook
Daily Pivots: (S1) 1.1093; (P) 1.1115; (R1) 1.1156; More....
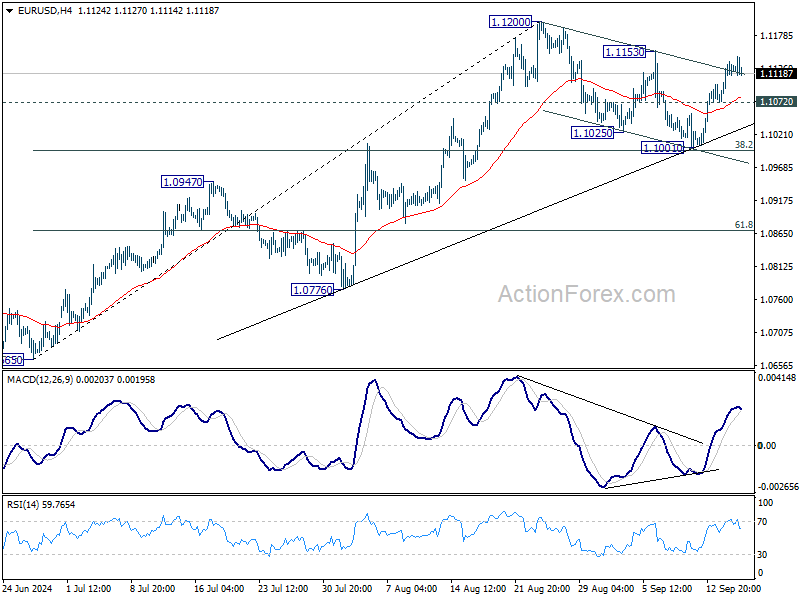
Intraday bias in EUR/USD stays neutral and outlook is unchanged. On the upside, break of 1.1153 resistance will suggest that later rally is ready to resume and target 1.1200, and then 1.1274 high. On the downside, below 1.1072 minor support will turn bias back to the downside for 38.2% retracement of 1.0665 to 1.1200 at 1.0996 again.
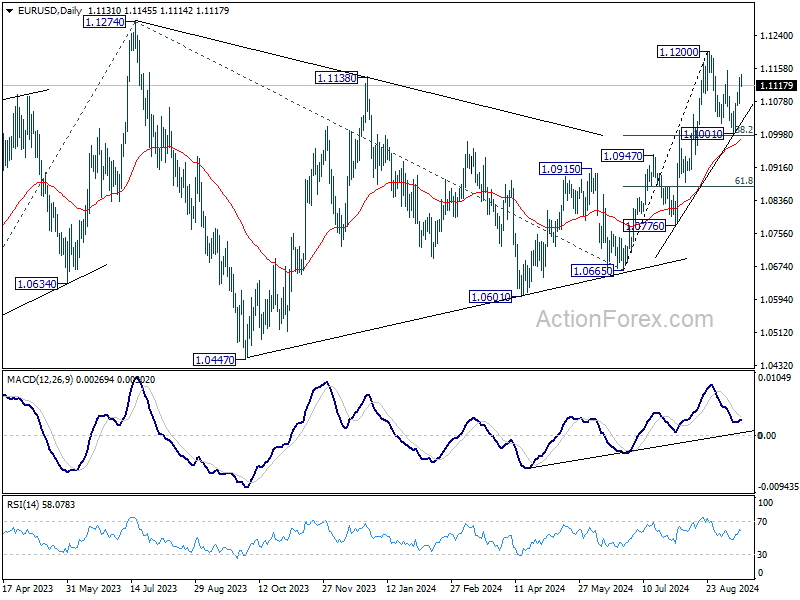
In the bigger picture, prior break of 1.1138 resistance indicates that corrective pattern from 1.1274 might have completed at 1.0665 already. Decisive break of 1.1274 (2023 high) will confirm whole up trend from 0.9534 (2022 low). Next target will be 61.8% projection of 0.9534 to 1.1274 from 1.0665 at 1.1740. This will now be the favored case as long as 1.0947 resistance turned support holds.
GBP/USD Mid-Day Outlook
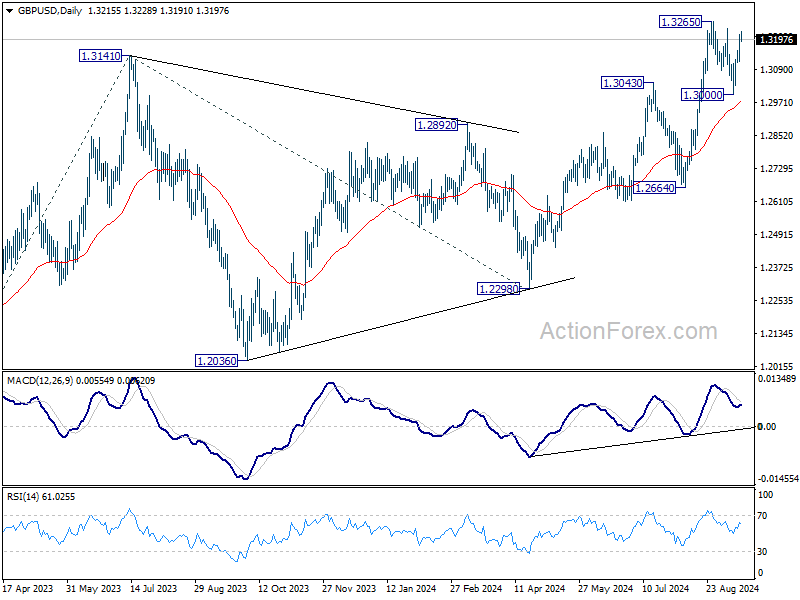
Daily Pivots: (S1) 1.3150; (P) 1.3185; (R1) 1.3251; More...
Intraday bias in GBP/USD remains neutral and outlook is unchanged. On the upside, decisive break of 1.3265 will resume larger rally 1.3364 projection level next. On the downside, below, 1.3177 minor support will turn bias to the downside, to extend the correction from 1.3265 through 1.3000 support.
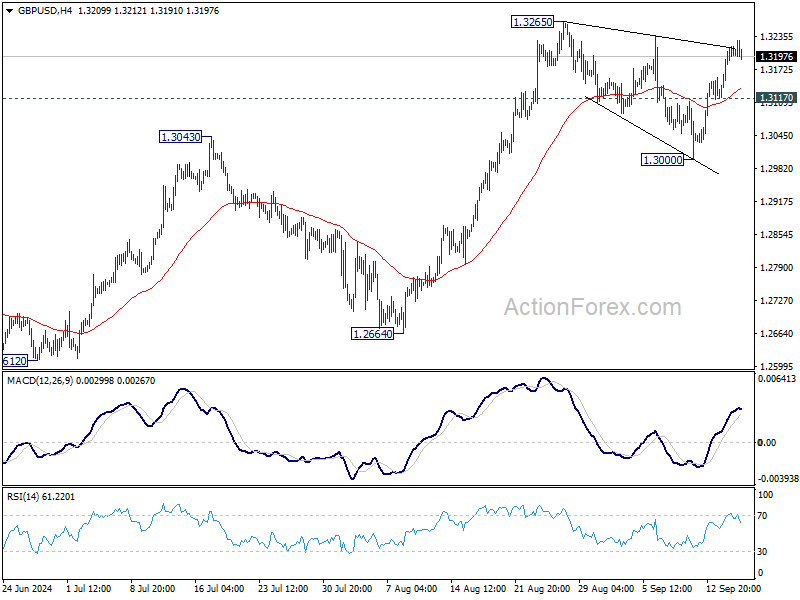
In the bigger picture, up trend from 1.0351 (2022 low) is in progress. Next target is 38.2% projection of 1.0351 to 1.3141 from 1.2298 at 1.3364. For now, outlook will stay bullish as long as 1.2664 support holds, even in case of deep pullback.
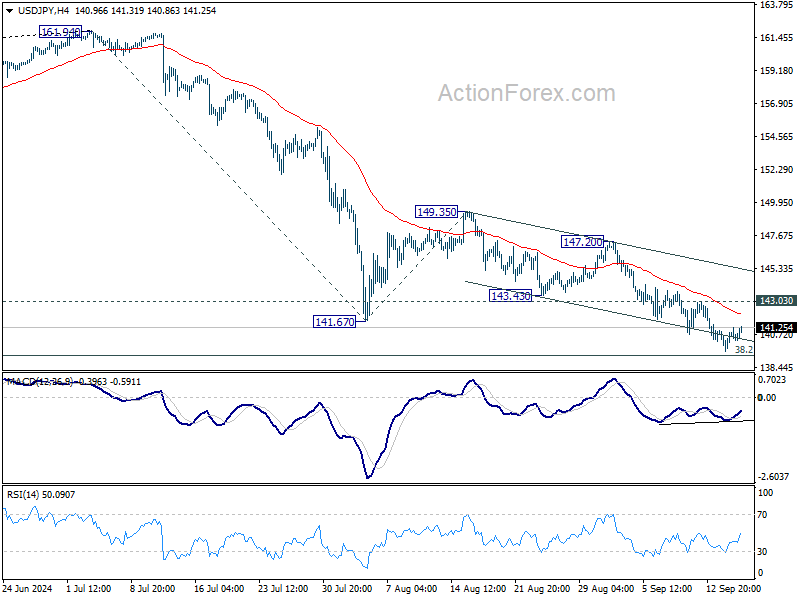
USD/JPY Mid-Day Outlook
Daily Pivots: (S1) 139.82; (P) 140.37; (R1) 141.17; More...
Intraday bias in USD/JPY remains neutral at this point. Considering bullish convergence condition in 4H MACD, break of 143.03 resistance will indicate short term bottoming and turn bias back to the upside for rebound towards 147.20. However, decisive break of 139.26 fibonacci level would carry larger bearish implications, and target 61.8% projection of 161.94 to 141.67 from 149.35 at 136.82.
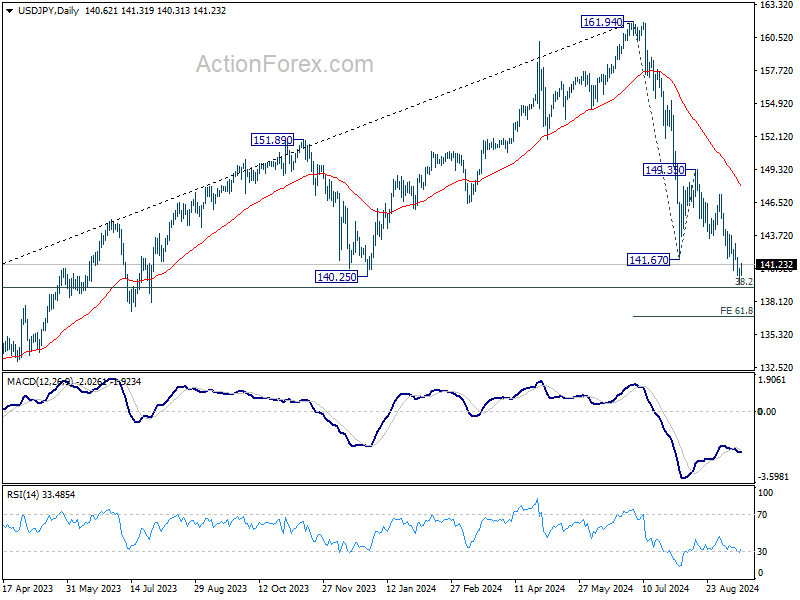
In the bigger picture, fall from 161.94 medium term top is seen as correcting whole up trend from 102.58 (2021 low). Strong support could be seen from 38.2% retracement of 102.58 to 161.94 at 139.26 to contain downside, at least on first attempt. But in any case, risk will stay on the downside as long as 149.35 resistance holds. Sustained break of 139.26 would open up deeper medium term decline to 61.8% retracement at 125.25.
US: Retail Sales Come in Stronger Than Expected in August, Real Consumer Spending Tracking 3.5% Annualized in Q3
Retail sales rose 0.1% month-on-month in August, ahead of the consensus forecast calling for a decline of 0.2% m/m. Revisions to prior months were a touch weaker, with spending for June (-0.3% m/m vs. prior -0.2 m/m) revised slightly lower, while July (1.1% m/m) was left unchanged after rounding.
Trade in the auto sector was lower by 0.1% m/m, following an upwardly revised reading of 4.4% m/m in July.
Sales at gasoline stations dipped 1.2% m/m August, though this was entirely a price story, as prices at the pump fell 2.9% m/m last month.
Sales in the "control group", which the excludes volatile components above (i.e., gasoline, autos and building supplies) and is used in the estimate of personal consumption expenditures (PCE), rose 0.2% m/m, a modest deceleration from the 0.4% monthly gain in July.
- Gains were concentrated across miscellaneous (+1.7% m/m) and non-store retailers (+1.4% m/m) as well as sales at health & personal care stores (0.7% m/m).
Food services & drinking places were flat in August, following four consecutive months of decent gains.
Key Implications
Some slowing in retail spending was expected, particularly after July's outsized gain. That said, last month's uptick still came in stronger than expected, while revisions to prior months were relatively negligible.
Our current tracking for consumer spending sits at a robust 3.5% annualized for the third quarter, which would be the fastest pace of PCE growth since Q1-2023. But with the labor market showing clear signs of cooling, the household savings rate at a two-year low, and delinquency rates for credit cards and autos well above pre-pandemic levels and still edging higher, we expect to see some moderation in spending habits over the coming quarters.
Canadian Headline Inflation Hits the Target
Headline CPI inflation edged lower in August to 2.0% year-on-year (y/y), versus 2.5% y/y in July, and just below consensus expectations of 2.1% y/y.
Goods prices have fallen into deflation at -0.7% y/y, with gasoline prices down 5.1% y/y. Additionally, Statcan noted greater discounting on clothing and footwear during the back-to-school shopping period.
Services prices were up 4.3% y/y, only down one tenth from July, as Canadians continue to pay up for shelter costs. Rent prices are growing 8.9% y/y, while mortgage interest costs are growing 18.8% y/y.
The Bank of Canada's preferred "core" inflation measures decelerated to 2.4% y/y in August, down from 2.5% y/y in July. On a three-month annualized basis, the average moved from 2.8% in July to 2.4% in August.
Key Implications
Bullseye! Headline inflation is back at the Bank of Canada's 2.0% target. At the same time, core measures keep grinding lower. These figures would be even lower if it weren't for the outsized impact of high housing costs. Inflation excluding shelter is growing at a paltry 0.5% y/y! This exemplifies how still high interest rates have weighed on the Canadian economy and slowed the pace of growth.
Inflation continues to validate the need for the Bank of Canada to continue cutting its policy rate. We calculate that the current policy rate is still nearly 200 basis points above where it should be based on the current state of the economy. And that is after 75 bps in cuts over the last few months. No wonder odds of larger 50 basis point cuts are growing in futures markets. Over the next few weeks, we will be getting a number of BoC members speaking on the economy. This will provide the central bank plenty of opportunity to move market pricing towards its intended path.
USD/CHF Mid-Day Outlook
Daily Pivots: (S1) 0.8426; (P) 0.8457; (R1) 0.8479; More…
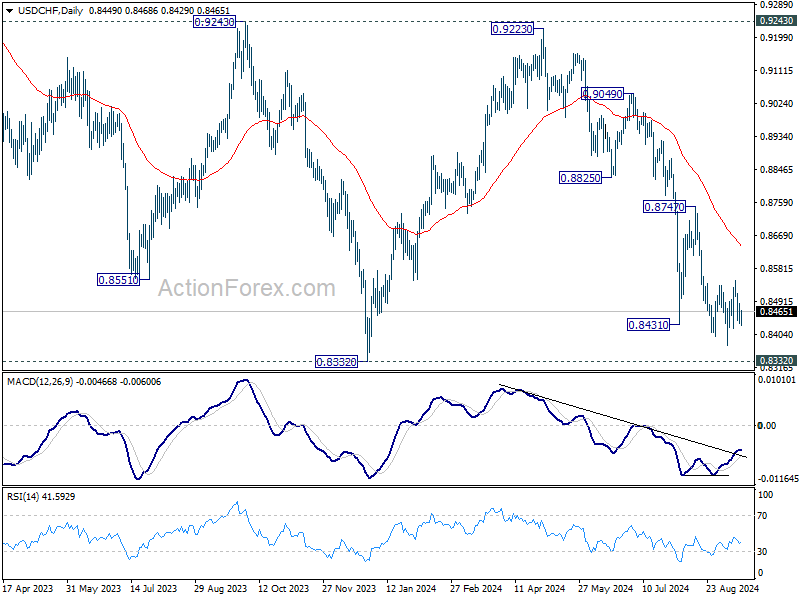
USD/CHF is still bounded in range trading and intraday bias remains neutral for the moment. With 0.8548 resistance intact, further decline is still expected. On the downside, break of 0.8374 will resume the fall from 0.9223 to retest 0.8332 low. Decisive break there will indicate larger down trend resumption. However, considering bullish convergence condition in 4H MACD, break of 0.8548 resistance will confirm short term bottoming, and turn bias back to the upside for 0.8747 resistance.
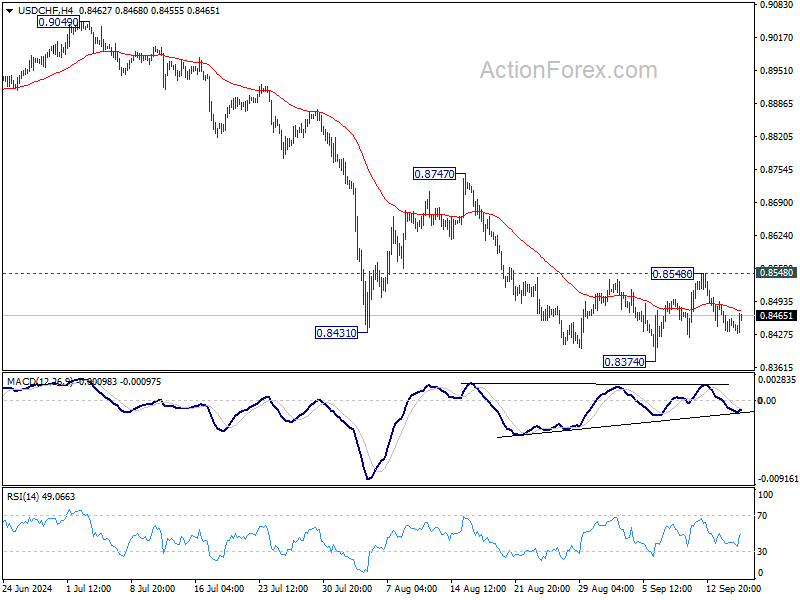
In the bigger picture, price actions from 0.8332 (2023 low) are currently seen as a medium term corrective pattern, with fall from 0.9223 as the second leg. Strong support could be seen from 0.8332 to bring rebound. Yet, overall outlook will continue to stay bearish as long as 0.9243 resistance holds. Firm break of 0.8332, however, will resume larger down trend from 1.0146 (2022 high).