Sample Category Title
AUD/USD Daily Report
Daily Pivots: (S1) 0.6742; (P) 0.6755; (R1) 0.6770; More...
Intraday bias in AUD/USD stays neutral for the moment. On the upside, decisive break of 0.6766 resistance should confirm that corrective pullback from 0.6823 has completed at 0.6621 already. Intraday bias will be turned to the upside to resume the rally from 0.6348 through 0.6823, and then 6870 resistance. On the downside, however, below 0.6691 will turn bias back to the downside for 38.2% retracement of 0.6348 to 0.6823 again.
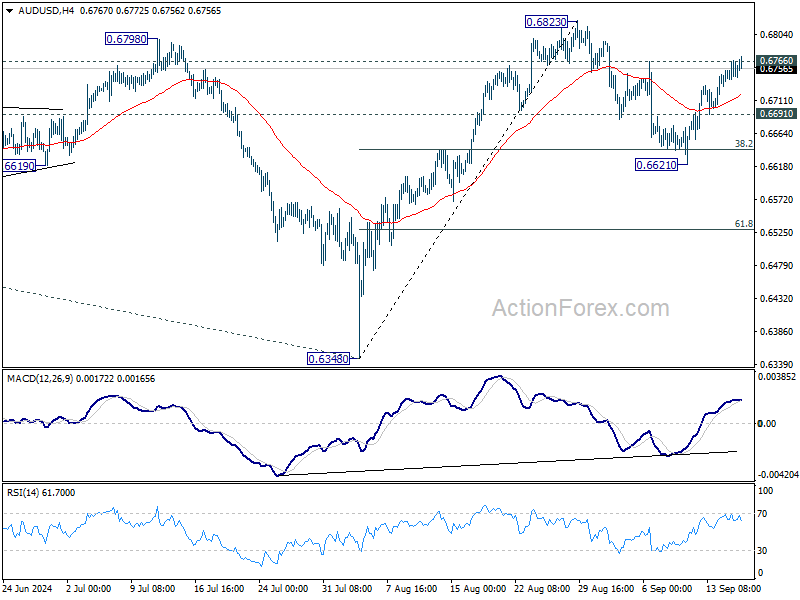
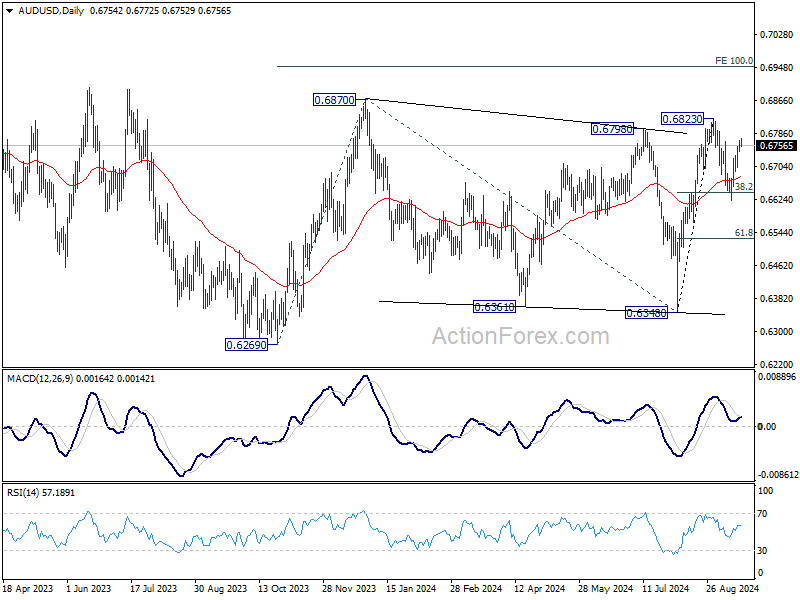
In the bigger picture, overall, price actions from 0.6169 (2022 low) are seen as a medium term corrective pattern, with rise from 0.6269 as the third leg. Firm break of 0.6798/6870 resistance zone will target 0.7156 resistance. In case of another fall, strong support should be seen from 0.6169/6361 to bring rebound.
Fed’s Moment of Truth: Will Markets Soar or Plunge After the Call?
The much-anticipated FOMC day has finally arrived, and the financial world is eagerly waiting to see if Fed will opt for a 25bps or a more assertive 50bps rate cut. With market expectations split nearly down the middle, and likely some internal divergence within FOMC itself, the outcome is poised to trigger significant market volatility across asset classes. The key question is whether US equities will soar to new records, or face a harsh selloff afterwards.
On the currency front, Dollar is trading slightly softer but remains largely range-bound against major rivals, as traders hold back ahead of Fed's announcement. But, Japanese Yen and Canadian Dollar are struggling as the weaker performers. On the flip side, Australian and New Zealand Dollars are standing out with relative strength. If today's announcement triggers risk-on sentiment, these two currencies could see further upside. European majors are mixed in the middle.
Another key event to monitor today is UK inflation data. While Although a downside surprise is unlikely to influence the BoE's expected decision to pause rate cuts tomorrow, an unexpected upside in inflation could reignite doubts over whether BoE will indeed proceed with another cut in November, giving a boost to Sterling.
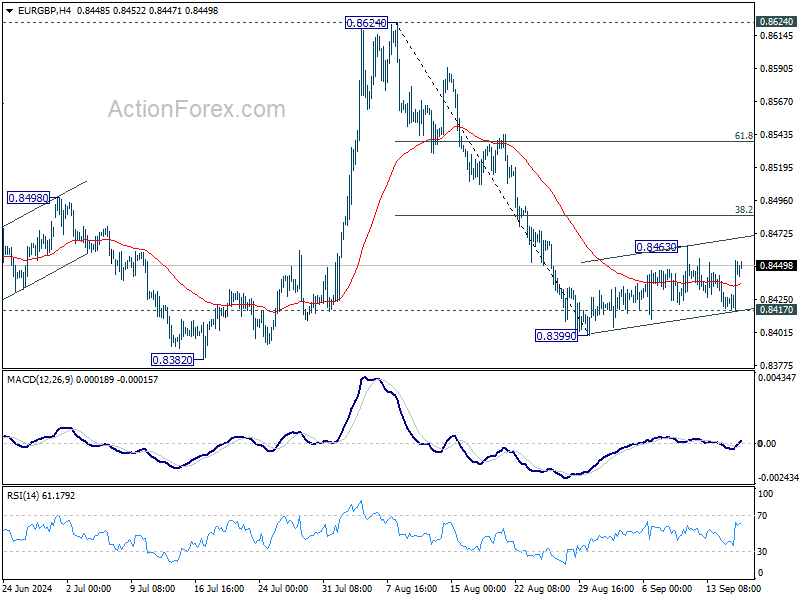
Technically, EUR/GBP is still stuck consolidation from 0.8399. While strong recovery cannot be ruled out, upside should be limited by 38.2% retracement of 0.8624 to 0.8399 at 0.8485. On the downside, break of 0.8417 minor support will argue that fall from 0.8624 is ready to resume through 0.8399 to 0.8382 support.
In Asia, at the time of writing, Nikkei is down -0.08%. Hong Kong is on holiday. China Shanghai SSE is down -0.05%. Singapore Strait Times is down -0.06%. Japan 10-year JGB yield is down -0.0065 at 0.824. Overnight, DOW fell -0.04%. S&P 500 rose 0.03%. NASDAQ rose 0.20%. 10-year yield rose 0.021 to 3.642.
Fed to cut 25 or 50? Stocks, bonds and Dollar await impact
FOMC's upcoming decision on interest rates is shaping up to be one of the most anticipated in years, with markets still uncertain whether Fed will opt for a 25bps cut or go bolder with a 50bps reduction. As of now, futures markets are pricing in a 65% chance of a 50bps cut, while the remaining 35% lean toward the more traditional 25bps move. Despite this, many economists believe Fed will take a more measured approach, but the decision is likely to reveal a split within the FOMC, with intense debates expected between the hawks and doves on the committee.
Beyond the size of the rate cut, this meeting will offer much more insight into Fed's thinking. Alongside the decision, markets are eagerly awaiting updates on future rate cut projections, revisions to the closely watched "dot plot," and new economic forecasts. And together they will create a complex picture for traders to digest.
As for the broader markets, Dollar may likely follow overall risk sentiment, while the Japanese Yen will likely move in response to US Treasury yields.
The stock market is holding its breath after S&P 500 briefly touched a new intraday record before closing with only a slight gain of 0.03%. Technically, decisive break of 5669.67 will confirm up trend resumption. Next target for the rest of the year will be 61.8% projection 4103.78 to 5669.67 from 5119.26 at 6086.98. In case of a pullback, outlook will still be cautiously bullish as long as 5402.62 support holds.
In the bond market, 10-year yield's down trend from 4.997 is still in progress for 100% projection of 4.997 to 3.785 from 4.737 at 3.525. Some support could be seen there to bring rebound, but outlook will stay bearish as long as 3.923 resistance holds. Decisive break of 3.525 will pave the way to next long term support level at 3.253.
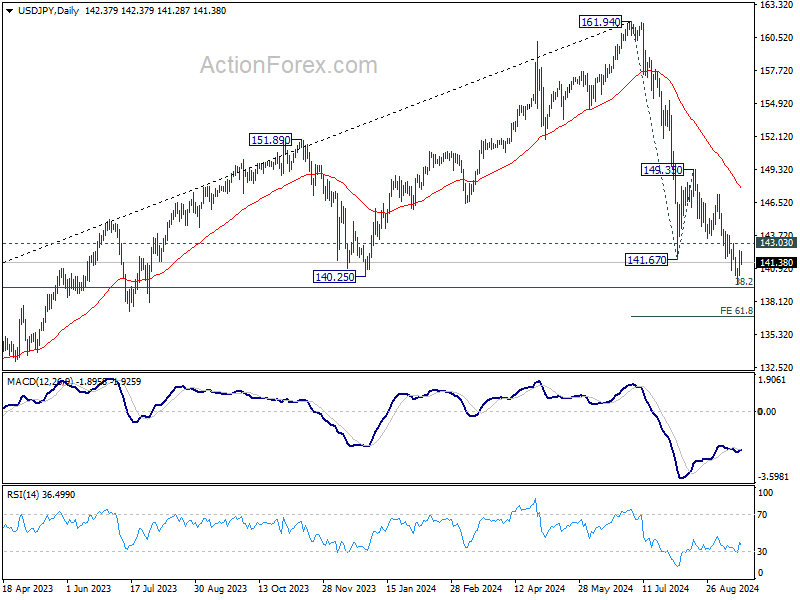
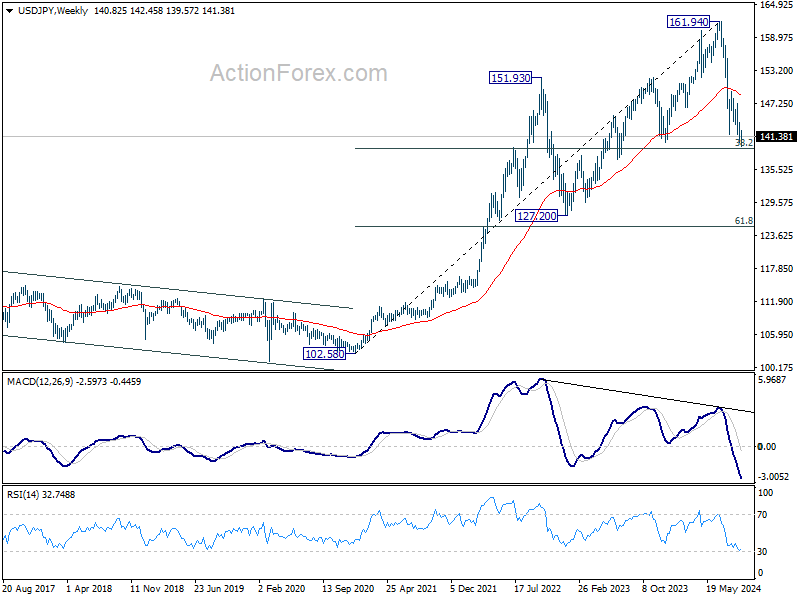
Turning to currency markets, USD/JPY is now sitting close to a key long term fibonacci support, 38.2% retracement of 102.58 (2021 low) to 161.94 at 139.26. Break of 143.03 minor resistance should confirm short term bottoming, and bring stronger rebound back to 55 D EMA (now at 147.71).
However, decisive break 139.26 will suggest that deeper medium term correction is underway. Next near term target is 61.8% projection of 161.94 to 141.67 from 149.35 at 136.82. Next medium term target is 61.8% retracement at 125.25.
Japan's exports rise for ninth month, but auto sector weighs on growth
Japan's export growth continued in August, rising 5.6% yoy to JPY 8,442B, marking the ninth consecutive month of growth. However, this increase fell significantly short of market expectations of 10% yoy growth. The weaker export performance was largely driven by -9.9% yoy decline in auto exports.
In terms of regional performance, exports to the US fell -0.7% yoy, marking the first decline in nearly three years, with auto sales slumping -14.2% yoy. Exports to Europe also suffered, falling -8.1% yoy. In contrast, exports to China were a bright spot, rising by 5.2% yoy.
On the import side, Japan saw 2.3% yoy increase, reaching JPY 9,137B, but this was also far below the expected growth of 13.4% yoy. Despite this, the import figure was the second-largest on record for the month of August.
The country's trade balance recorded a deficit of JPY -695B, remaining in the red for the second consecutive month.
In seasonally adjusted terms, both exports and imports declined on a month-over-month basis. Exports dropped -3.9% to JPY 8,759B, while imports fell -4.4% to JPY 9,354B. This left Japan with a seasonally adjusted trade deficit of JPY -596B.
BoC's Rogers: Cooling inflation is "welcome news" but challenges remain
BoC Senior Deputy Governor Carolyn Rogers emphasized the importance of continued vigilance in combating inflation, even as cooling price pressures brought some relief.
Speaking at an event overnight, Rogers noted that while the recent decline in inflation to 2% is "welcome news," it is still too early to declare victory. "There's still work to do," she stated, adding that policymakers need to "stick the landing" to ensure that inflation returns sustainably to target levels.
The comments come in yesterday's data which showed that inflation had decelerated to BoC's 2% target in August—the slowest pace since early 2021. The two key core inflation measures also eased, with the average annual pace falling to 2.35% from 2.55% in July.
Recently, there is growing focus on preventing a deep economic slowdown, while rising unemployment became critical concerns for policymakers. Rogers acknowledged the shift in risk perception, saying, "It's not an absolute tilt to the downside risks, but definitely we're in a period where the risks are more balanced."
Looking ahead
UK CPI and PPI will be released in European session, then Eurozone CPI final. Later in the day, US will release building permits and housing starts. BoC will publish summary of deliberations. Then FOMC rate decision and press conference will follow.
AUD/USD Daily Report
Daily Pivots: (S1) 0.6742; (P) 0.6755; (R1) 0.6770; More...
Intraday bias in AUD/USD stays neutral for the moment. On the upside, decisive break of 0.6766 resistance should confirm that corrective pullback from 0.6823 has completed at 0.6621 already. Intraday bias will be turned to the upside to resume the rally from 0.6348 through 0.6823, and then 6870 resistance. On the downside, however, below 0.6691 will turn bias back to the downside for 38.2% retracement of 0.6348 to 0.6823 again.
In the bigger picture, overall, price actions from 0.6169 (2022 low) are seen as a medium term corrective pattern, with rise from 0.6269 as the third leg. Firm break of 0.6798/6870 resistance zone will target 0.7156 resistance. In case of another fall, strong support should be seen from 0.6169/6361 to bring rebound.
Economic Indicators Update
| GMT | CCY | EVENTS | ACT | F/C | PP | REV |
|---|---|---|---|---|---|---|
| 22:45 | NZD | Current Account (NZD) Q2 | -4.83B | -3.90B | -4.36B | -3.83B |
| 23:50 | JPY | Trade Balance (JPY) Aug | -0.60T | -0.97T | -0.76T | -0.68T |
| 23:50 | JPY | Machinery Orders M/M Jul | -0.10% | 0.40% | 2.10% | |
| 01:00 | AUD | Westpac Leading Index M/M Aug | -0.10% | -0.04% | ||
| 06:00 | GBP | CPI M/M Aug | 0.30% | -0.20% | ||
| 06:00 | GBP | CPI Y/Y Aug | 2.20% | 2.20% | ||
| 06:00 | GBP | Core CPI Y/Y Aug | 3.60% | 3.30% | ||
| 06:00 | GBP | RPI M/M Aug | 0.50% | 0.10% | ||
| 06:00 | GBP | RPI Y/Y Aug | 3.40% | 3.60% | ||
| 06:00 | GBP | PPI Input M/M Aug | -0.30% | -0.10% | ||
| 06:00 | GBP | PPI Input Y/Y Aug | -0.90% | 0.40% | ||
| 06:00 | GBP | PPI Output M/M Aug | 0.00% | 0.00% | ||
| 06:00 | GBP | PPI Output Y/Y Aug | 0.50% | 0.80% | ||
| 06:00 | GBP | PPI Core Output M/M Aug | 0.00% | |||
| 06:00 | GBP | PPI Core Output Y/Y Aug | 1.00% | |||
| 09:00 | EUR | Eurozone CPI Y/Y Aug F | 2.80% | 2.80% | ||
| 09:00 | EUR | Eurozone CPI Core Y/Y Aug F | 2.20% | 2.20% | ||
| 12:30 | USD | Housing Starts Aug | 1.32M | 1.24M | ||
| 12:30 | USD | Building Permits Aug | 1.41M | 1.40M | ||
| 14:30 | USD | Crude Oil Inventories | -0.2M | 0.8M | ||
| 17:30 | CAD | BoC Summary of Deliberations | ||||
| 18:00 | USD | Fed Interest Rate Decision | 5.25% | 5.50% | ||
| 18:30 | USD | FOMC Press Conference |
Fed to cut 25 or 50? Stocks, bonds and Dollar await impact
FOMC's upcoming decision on interest rates is shaping up to be one of the most anticipated in years, with markets still uncertain whether Fed will opt for a 25bps cut or go bolder with a 50bps reduction. As of now, futures markets are pricing in a 65% chance of a 50bps cut, while the remaining 35% lean toward the more traditional 25bps move. Despite this, many economists believe Fed will take a more measured approach, but the decision is likely to reveal a split within the FOMC, with intense debates expected between the hawks and doves on the committee.
Beyond the size of the rate cut, this meeting will offer much more insight into Fed's thinking. Alongside the decision, markets are eagerly awaiting updates on future rate cut projections, revisions to the closely watched "dot plot," and new economic forecasts. And together they will create a complex picture for traders to digest.
As for the broader markets, Dollar may likely follow overall risk sentiment, while the Japanese Yen will likely move in response to US Treasury yields.
The stock market is holding its breath after S&P 500 briefly touched a new intraday record before closing with only a slight gain of 0.03%. Technically, decisive break of 5669.67 will confirm up trend resumption. Next target for the rest of the year will be 61.8% projection 4103.78 to 5669.67 from 5119.26 at 6086.98. In case of a pullback, outlook will still be cautiously bullish as long as 5402.62 support holds.
In the bond market, 10-year yield's down trend from 4.997 is still in progress for 100% projection of 4.997 to 3.785 from 4.737 at 3.525. Some support could be seen there to bring rebound, but outlook will stay bearish as long as 3.923 resistance holds. Decisive break of 3.525 will pave the way to next long term support level at 3.253.
Turning to currency markets, USD/JPY is now sitting close to a key long term fibonacci support, 38.2% retracement of 102.58 (2021 low) to 161.94 at 139.26. Break of 143.03 minor resistance should confirm short term bottoming, and bring stronger rebound back to 55 D EMA (now at 147.71).
However, decisive break 139.26 will suggest that deeper medium term correction is underway. Next near term target is 61.8% projection of 161.94 to 141.67 from 149.35 at 136.82. Next medium term target is 61.8% retracement at 125.25.
Japan’s exports rise for ninth month, but auto sector weighs on growth
Japan's export growth continued in August, rising 5.6% yoy to JPY 8,442B, marking the ninth consecutive month of growth. However, this increase fell significantly short of market expectations of 10% yoy growth. The weaker export performance was largely driven by -9.9% yoy decline in auto exports.
In terms of regional performance, exports to the US fell -0.7% yoy, marking the first decline in nearly three years, with auto sales slumping -14.2% yoy. Exports to Europe also suffered, falling -8.1% yoy. In contrast, exports to China were a bright spot, rising by 5.2% yoy.
On the import side, Japan saw 2.3% yoy increase, reaching JPY 9,137B, but this was also far below the expected growth of 13.4% yoy. Despite this, the import figure was the second-largest on record for the month of August.
The country's trade balance recorded a deficit of JPY -695B, remaining in the red for the second consecutive month.
In seasonally adjusted terms, both exports and imports declined on a month-over-month basis. Exports dropped -3.9% to JPY 8,759B, while imports fell -4.4% to JPY 9,354B. This left Japan with a seasonally adjusted trade deficit of JPY -596B.
BoC’s Rogers: Cooling inflation is “welcome news” but challenges remain
BoC Senior Deputy Governor Carolyn Rogers emphasized the importance of continued vigilance in combating inflation, even as cooling price pressures brought some relief.
Speaking at an event overnight, Rogers noted that while the recent decline in inflation to 2% is "welcome news," it is still too early to declare victory. "There's still work to do," she stated, adding that policymakers need to "stick the landing" to ensure that inflation returns sustainably to target levels.
The comments come in yesterday's data which showed that inflation had decelerated to BoC's 2% target in August—the slowest pace since early 2021. The two key core inflation measures also eased, with the average annual pace falling to 2.35% from 2.55% in July.
Recently, there is growing focus on preventing a deep economic slowdown, while rising unemployment became critical concerns for policymakers. Rogers acknowledged the shift in risk perception, saying, "It's not an absolute tilt to the downside risks, but definitely we're in a period where the risks are more balanced."
GBP/USD Bounces Back: Fed Rate Decision Looms Large Over Next Move
Key Highlights
- GBP/USD started another increase from the 1.3000 support.
- It cleared a key bearish trend line with resistance at 1.3180 on the 4-hour chart.
- The UK CPI could rise by 2.2% in August 2024 (YoY).
- Today, the Fed could reduce interest rates from 5.50% to 5.25%.
GBP/USD Technical Analysis
The British Pound found support near the 1.3000 zone against the US Dollar. GBP/USD started another increase above the 1.3150 resistance zone.
Looking at the 4-hour chart, the pair climbed above the 61.8% Fib retracement level of the downward move from the 1.3239 swing high to the 1.3001 low. The pair even cleared the 100 simple moving average (red, 4-hour) and settled well above the 200 simple moving average (green, 4-hour).
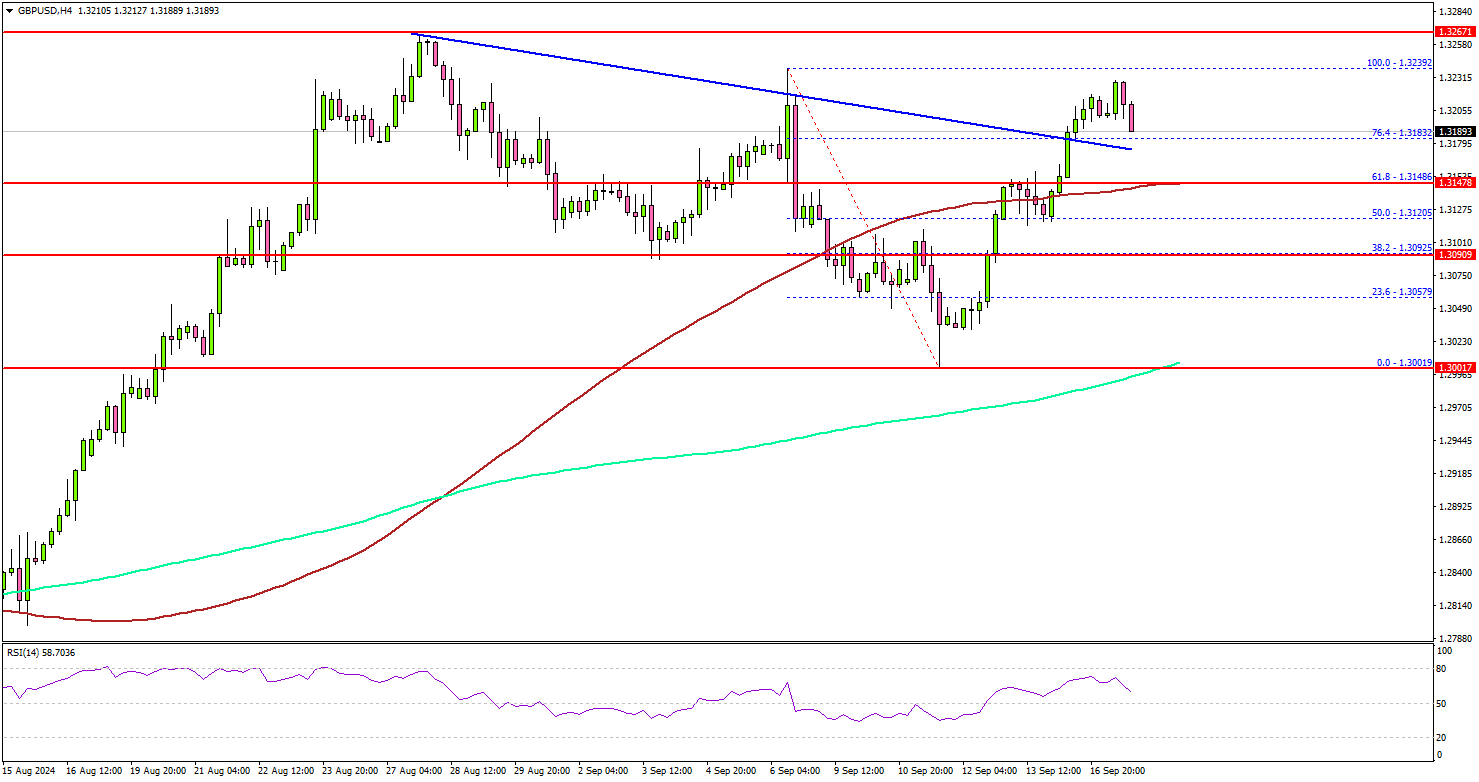
Besides, it cleared a key bearish trend line with resistance at 1.3180 on the same chart. It seems like the pair is now facing hurdles near 1.3230.
A clear move above the 1.3230 zone might set the pace for a move toward 1.3265. Any more gains might call for a test of the 1.3350 zone.
On the downside, immediate support sits near the 1.3150 level and the 100 simple moving average (red, 4-hour). The next key support sits near the 1.3090 level, below which the pair could dive toward the 200 simple moving average (green, 4-hour) at 1.3000.
Looking at EUR/USD, the pair faced resistance near 1.1150 and now awaits the Fed interest rate decision for the next move.
Upcoming Economic Events:
- UK Consumer Price Index for August 2024 (YoY) – Forecast +2.2%, versus +2.2% previous.
- UK Core Consumer Price Index for August 2024 (YoY) – Forecast +3.5%, versus +3.3% previous.
- Fed Interest Rate Decision - Forecast 5.25%, versus 5.50% previous.
CHFJPY Wave Analysis
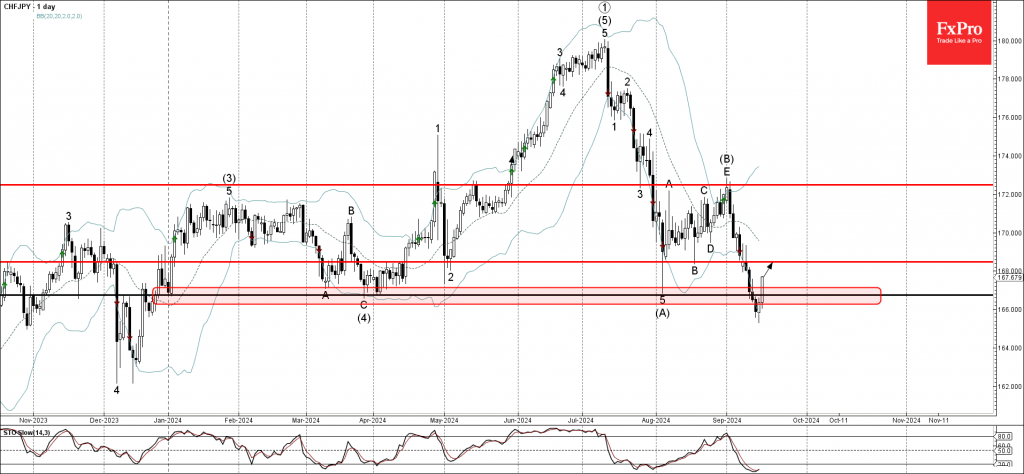
- CHFJPY reversed from support zone
- Likely to rise to the resistance level 168.45
CHFJPY currency pair recently reversed up from the key support zone located between the long-term support level 166.75 (which has been reversing the price from the start of this year) and the lower daily Bollinger Band.
The upward reversal from this support zone created the daily Japanese candlesticks reversal pattern Bullish Engulfing.
Given the oversold daily Stochastic and the strength of the support level 166.75, CHFJPY currency pair can be expected to rise further to the next resistance level 168.45 (former support from August).
How Will US Elections Impact the Markets?
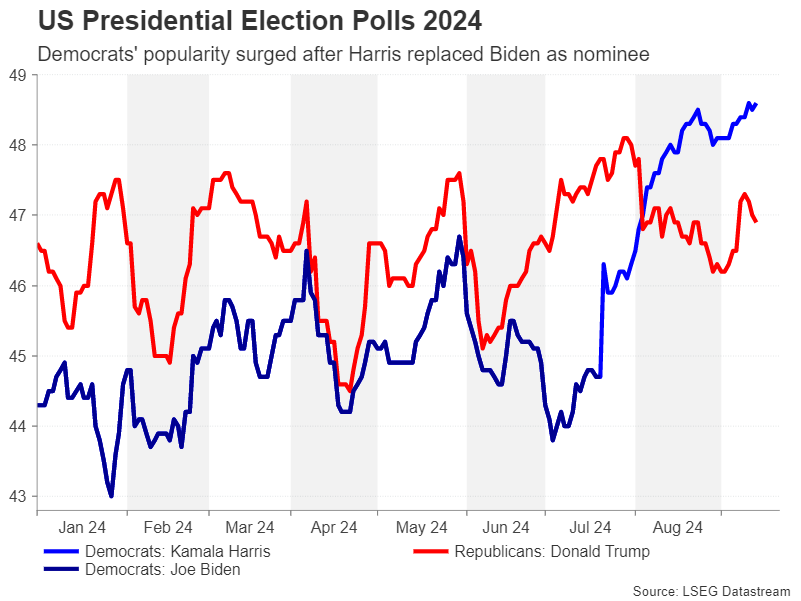
- Harris takes the lead in most polls as Trump’s campaign stalls
- But what does a Harris win mean for stocks and the US dollar?
- Can Trump turn things around and what would investors prefer?
Late entry
The US presidential election is drawing ever closer and there can be no doubt that the race heated up after President Joe Biden abruptly dropped out. His vice president, Kamala Harris, was the obvious choice to replace him despite doubts about her electability.
Yet, she managed to steal Donald Trump’s thunder almost immediately after Biden’s endorsement made her the frontrunner to replace him. It didn’t take long for other senior Democrats to give their backing too, and Harris soon had enough delegate votes to secure the party’s nomination. After that, from her pick of Tim Walz as her running mate to the star-studded Democratic National Convention where she was formally nominated, the momentum just kept growing.
Light on policy
However, her campaign hit its first major bump when she gave a lackluster performance in an interview with CNN, providing the Trump team a much-needed boost. More importantly, as the initial euphoria for Harris fades, the focus is shifting back to policy details, or the lack of.
Whilst there are key differences between the two candidates when it comes to hot issues such as immigration, tariffs, foreign policy and tackling climate change, the pros and cons are not so obvious when it comes to economic policies, at least not when it concerns the markets.
Tax cuts vs spending
The Republicans are traditionally the party for lower taxes, while the Democrats tend to support more spending. Looking at their policies, neither candidate is steering away from convention. Trump wants to extend the Tax Cuts and Jobs Act of 2017 from his first term that is set to expire in 2025 and is pledging to make further reductions to the corporate tax rate. Other tax reductions are being floated too.
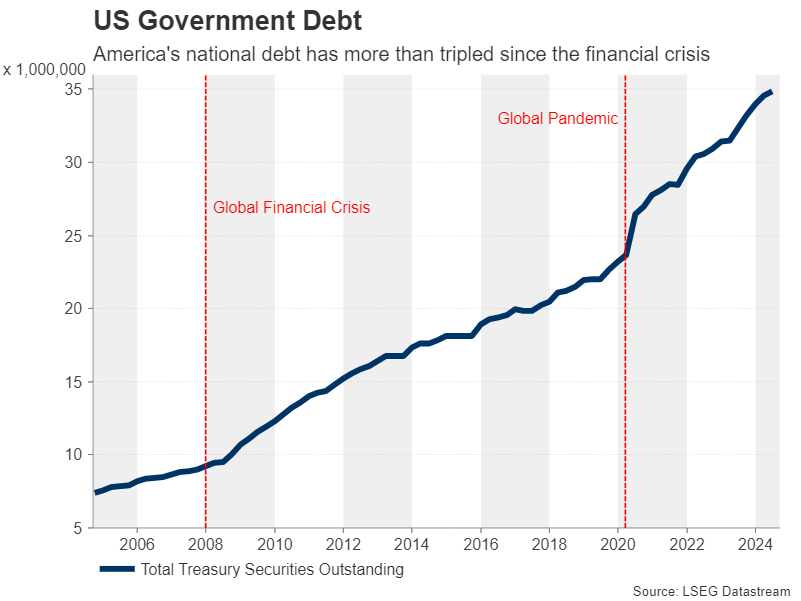
It's not surprising therefore that the majority of investors favour Trump to win the November 5 election. But from a voter perspective, the advantages are not so clear. For one, the US has been running excessive budget deficits since the 2008 financial crisis and government debt has more than tripled during this period to almost $35 trillion.
America’s growing debt mountain
A Trump victory could see another $5.8 trillion being added to the debt pile over the next decade according to one study by the Penn Wharton Budget Model, whereas Harris’ policies would add only $1.2 trillion.
Failure to tackle America’s growing deficit problem runs the risk of a debt episode similar to what the UK experienced with its mini budget debacle, as it’s doubtful whether markets would be able to turn a blind eye for much longer.
China Trade War II
Another worry is that Trump’s only source of new revenue is higher tariffs (of 10%) on all imports, with those from China being charged 60%. Regardless of whether such a policy would succeed in boosting the onshoring of manufactured goods, the immediate impact would be a jump in costs for domestic producers and retailers, lifting the prices of a whole range of goods for American consumers. This could derail the Fed’s fight against inflation, giving policymakers less scope to cut interest rates.
Hence, there would be significant uncertainties associated with Trump’s tax cuts and tariffs, which is why some businesses might prefer the continuity that a Harris administration would bring. On her part, Harris’s proposals are mostly targeted at helping households with the cost-of-living crisis.
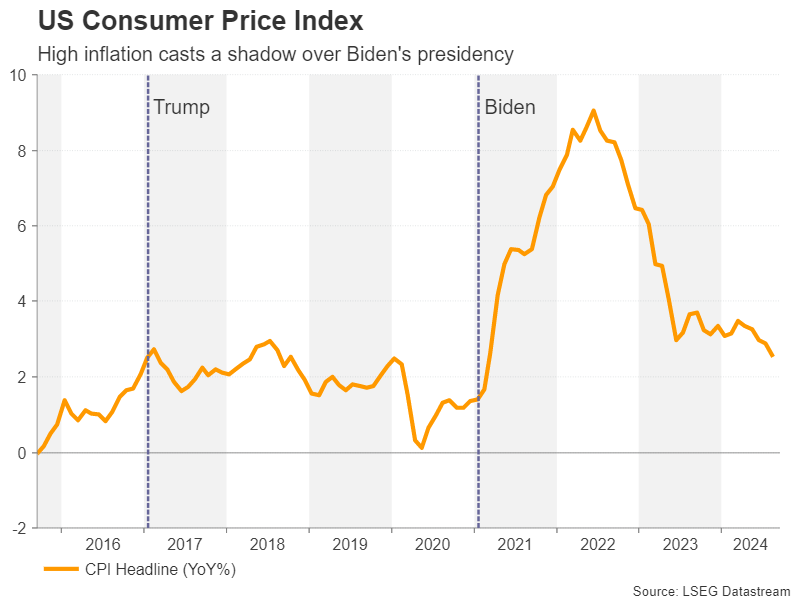
Biden’s mixed economic track record
High inflation has been the Biden administration’s biggest Achilles’ heel, as it’s overshadowed an otherwise good track record on the economy. The problem for Harris, however, is that having served as vice president, she cannot disassociate herself entirely from Biden’s legacy.
Nevertheless, her combined proposals on capping food prices, building more affordable homes, continuing Biden’s reforms on lowering drug prices, and expanding child tax credits and other tax breaks for families and workers may win round quite a few voters.
Potentially a bigger worry for the Democrats than the absence of headline grabbing policies is the risk of a worsening labor market in the run up to polling day. The Fed looks set to begin cutting interest rates at its September meeting, but this may be too little, too late for voters. Even worse, if any deterioration in employment conditions is not matched by downside surprises in inflation, rate cut odds won’t rise very substantially and Wall Street won’t be able to stage much of a rally.
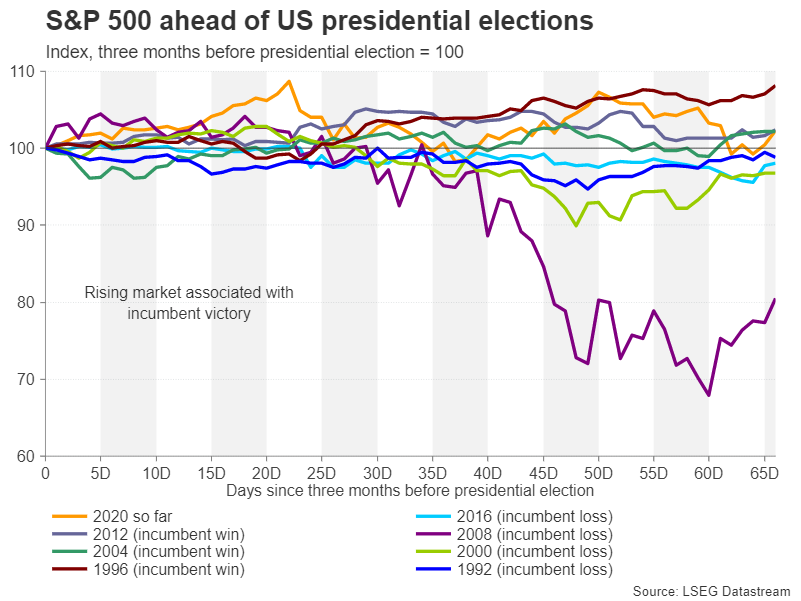
Who will lift Wall Street the most?
The post-election impact on the stock market is also not very clear-cut. Whilst Trump’s proposed tax cuts would likely be positive for consumers, the boost would be limited if the reductions are targeted mainly at the rich. His stance on corporation tax is also aimed more at big businesses.
This is in sharp contrast to Harris’s focus on supporting the middle class as well as smaller businesses when it comes to tax relief. However, even if the real economy were to benefit more from Democratic policies than Republican ones, Harris’ proposed increase in the corporate tax rate from 21% to 28% alone could be a significant drag on Wall Street shares.
The race for Congress
In reality, the extent to which either candidate will be able to enact all their proposals will depend on how the composition of Congress changes after the election. The Democrats currently control the Senate, while the Republicans have a majority in the House of Representatives.
If Trump wins but the Republicans do not control Congress, the tax cut plans might have to be scaled down and some sort of compromise would have to be reached with the Democrats, for example, not to lower the corporate tax rate.
But if Harris becomes the next president and Congress is split, it will be difficult for the Democrats to pass any bills containing tax hikes on the wealthy and some of the tax credits and spending increases might have to be financed by savings elsewhere to receive the backing of Republicans.
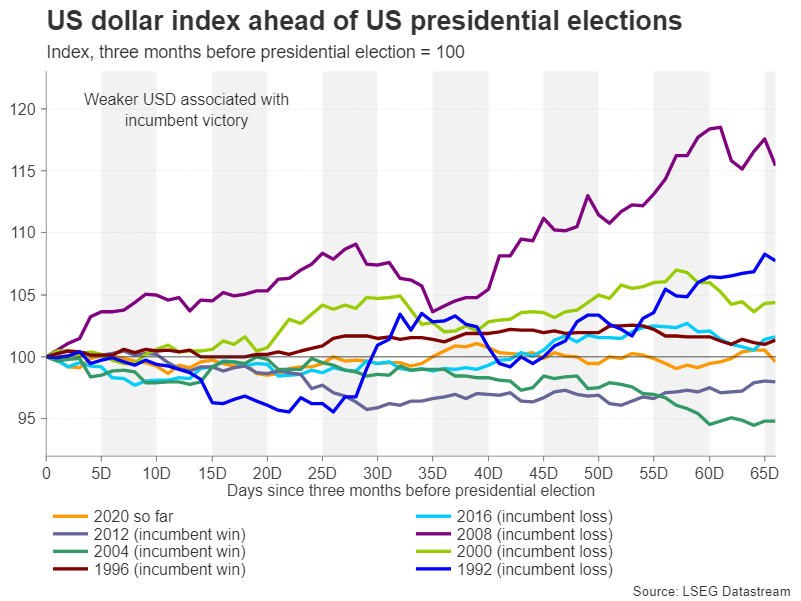
Dollar bulls might prefer Trump
What all this means for the US dollar is that a Republican-led Congress is likely to be inflationary due to looser fiscal policy and higher tariffs, forcing the Fed to maintain restrictive monetary policy. Trump’s promise to clamp down on illegal immigrants could also stoke inflation by rekindling wage pressures.
All this would create a bullish backdrop for the greenback. Equities would be bolstered too by lower taxes, that is until higher tariffs kick in and inflation starts to cause fresh headaches for the Fed.
However, a victory for Kamala Harris and the Democrats would almost certainly keep the Fed on an easing path, placing the dollar under fresh selling pressure. Yet, a relatively tighter fiscal policy might not be the best environment for stocks to thrive, although rate cuts and a soft landing could eventually revive the rally on Wall Street.
Gold and oil take different sides
Not to forget the implications for key commodities such as gold and oil. Gold is less likely to maintain its record-setting streak under a Trump administration as interest rates would not be cut as much and may even rise again, hurting the appeal of the non-yielding yellow metal.
But oil might perform better despite Trump’s pledge to encourage more production of fossil fuels, which would weigh on prices. Oil futures could benefit from the greater demand generated by a potentially stronger US economy. Meanwhile, Trump’s tougher stance on Iran as well as his unwavering support for Israel carries some risks, possibly inflaming geopolitical tensions and pushing up oil prices.
That’s not to say that there wouldn’t be any danger of a geopolitical escalation with the Democrats remaining in power. But a more modest fiscal boost as well as the ongoing efforts for a ceasefire in Gaza would alter little from the current demand outlook for oil.
Cryptos and the Trump trade
With many of the policies laid out unlikely to be fully shaped until once a new administration is in place, most investors will probably stick to the view that Trump is more pro-business than Harris and therefore his return to the White House would be positive for risk assets. And whilst Trump’s economic policies have a slimmer edge over his rival this time round than in previous elections, some investors may find individual stock sectors or assets that fall under the ‘Trump trade’ more attractive.
Cryptocurrencies and crypto-related stocks are a surprise inclusion in the Trump trade. During his first term as president, Trump did not hide his disapproval of cryptos. But he has seemingly made a U-turn, becoming one of the industry’s most ardent supporters. Harris has signaled she also favors further growth in digital currencies, although it’s not clear whether she would take a laxer stance on regulation than Biden.
Will election fever grip the markets?
With election day fast approaching, further surprises cannot be ruled out as Trump and Harris ramp up their campaigns and investors start to pay closer attention to the opinion polls, particularly in the battleground states. But the fact that Trump did not manage to swing the pendulum back towards him after the first and only televised debate between the two hopefuls indicates that it will be tough for the Republicans to regain momentum.
GBP: Traders Await BoE’s Interest Rate Decision
The GBPUSD pair remains in a bullish position, but signs of being overbought are emerging with the RSI indicator nearing 70. The pair has support near 1.3200 and resistance around 1.3260, with the next significant level at 1.3300. On Monday, the pair gained momentum as a weakening US Dollar and optimism around a potential Federal Reserve rate cut supported the British Pound. However, traders are holding off on large moves as they wait for important economic data, including US Retail Sales and UK inflation numbers, as well as upcoming central bank meetings. The Bank of England's interest rate decision on Thursday is particularly in focus.
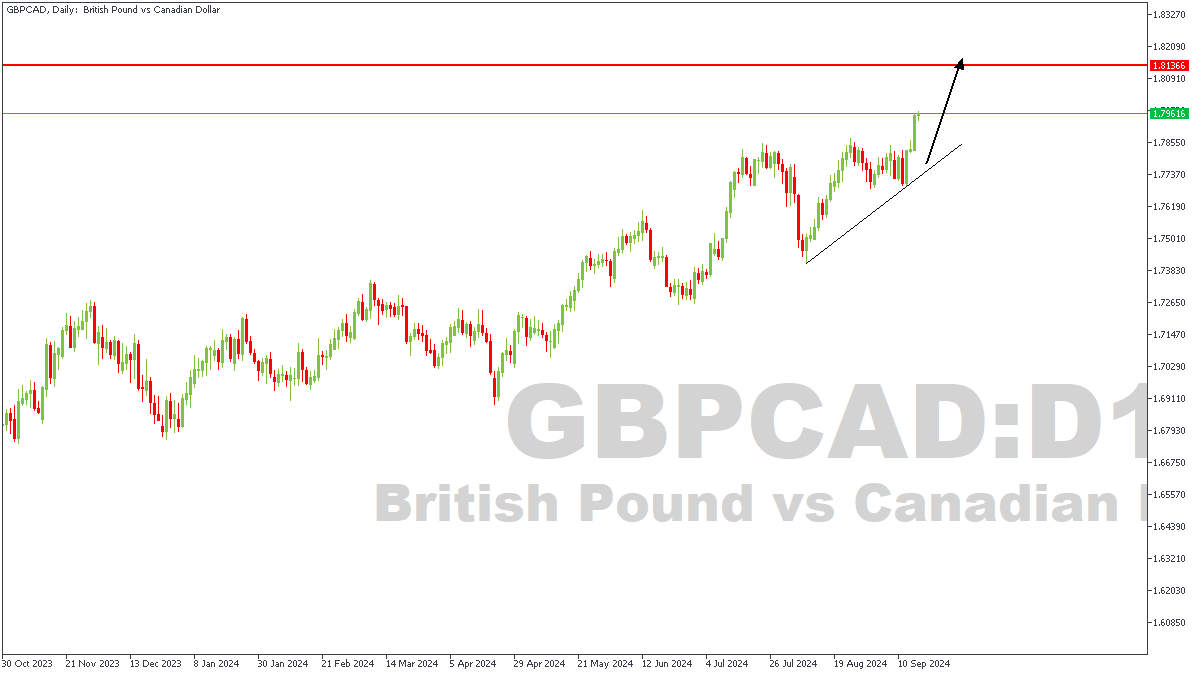
GBPCAD – D1 Timeframe
GBPCAD on the daily timeframe as seen on the Daily timeframe chart has currently bounced off the trendline support, breaking above the previous high as a result. The target for this bullish impulse in my opinion is the highlighted weekly timeframe pivot zone. In the meantime, a lower timeframe confirmation could be considered before entering the trade.
Analyst’s Expectations:
- Direction: Bullish
- Target: 1.81366
- Invalidation: 1.76810
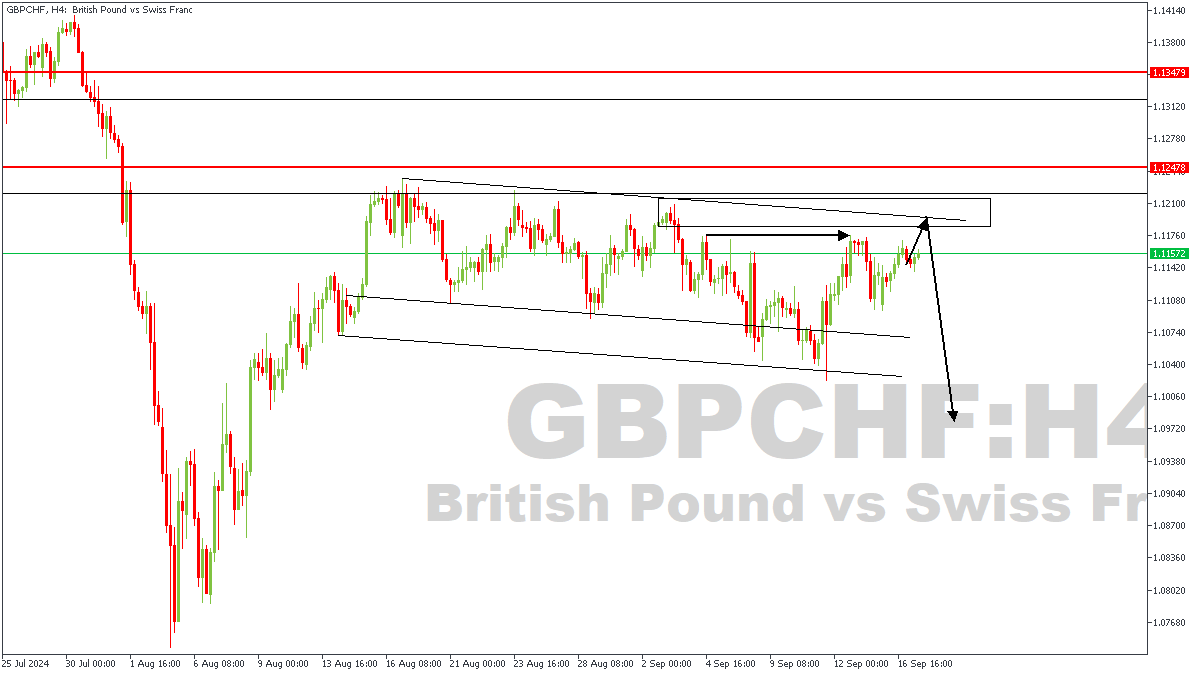
GBPCHF – H4 Timeframe
The descending channel on the 4-hour timeframe of GBPCHF is currently my target. I expect to see the highlighted high get taken out, with the trendline resistance as the initial target. This sentiment is based on the flag pattern been formed, a break above the flag should see prices reach farther into the weekly timeframe pivot.
Analyst’s Expectations:
- Direction: Bullish
- Target: 1.09800
- Invalidation: 1.12478