
Sample Category Title
USD/CHF Mid-Day Outlook
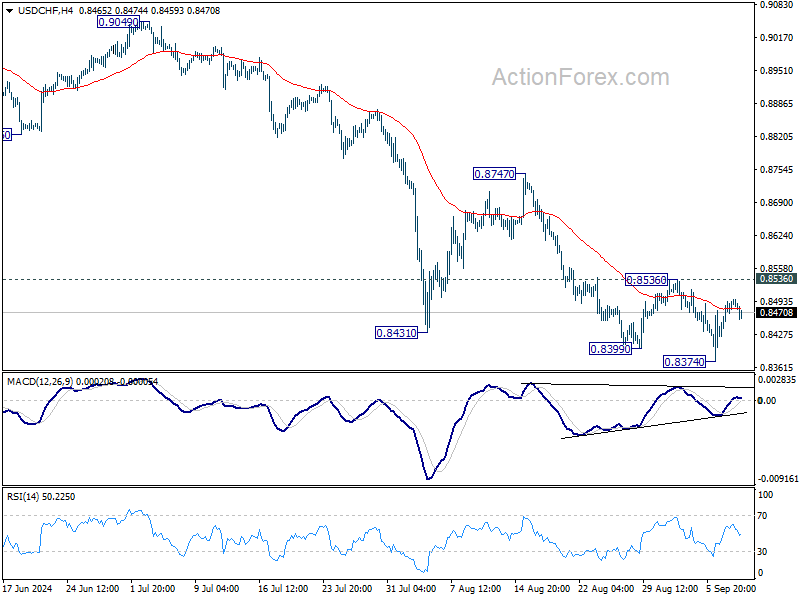
Daily Pivots: (S1) 0.8449; (P) 0.8472; (R1) 0.8517; More…
Intraday bias in USD/CHF stays neutral and more consolidations could be seen above 0.8374. With 0.8356 resistance intact, further decline is expected. On the downside, break of 0.8374 will resume the fall from 0.9223 to retest 0.8332 low. Decisive break there will indicate larger down trend resumption. However, considering bullish convergence condition in 4H MACD, break of 0.8536 resistance will now confirm short term bottoming, and turn bias back to the upside for 0.8747 resistance.
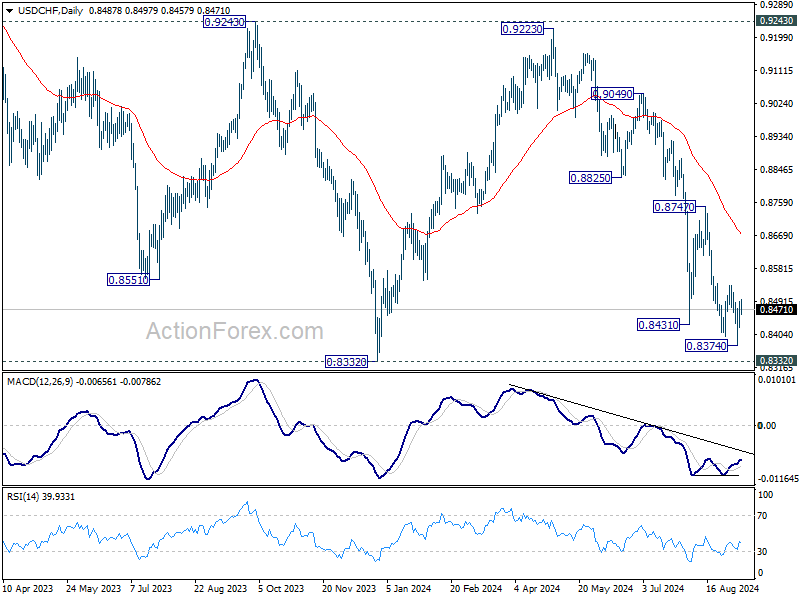
In the bigger picture, price actions from 0.8332 (2023 low) are currently seen as a medium term corrective pattern, with fall from 0.9223 as the second leg. Strong support could be seen from 0.8332 to bring rebound. Yet, overall outlook will continue to stay bearish as long as 0.9243 resistance holds. Firm break of 0.8332, however, will resume larger down trend from 1.0146 (2022 high).
EUR/USD Mid-Day Outlook
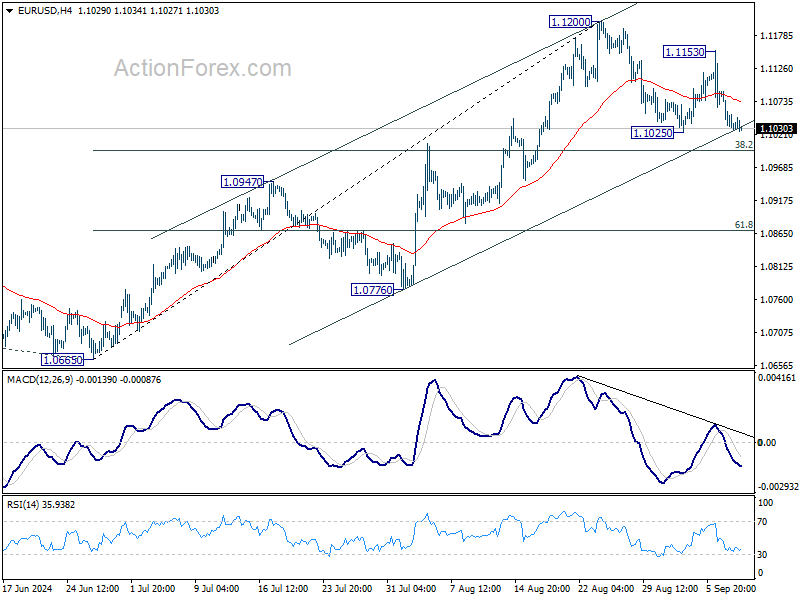
Daily Pivots: (S1) 1.1016; (P) 1.1053; (R1) 1.1073; More....
Outlook in EUR/USD remains unchanged and intraday bias stays neutral. Consolidation from 1.1200 could extend with deeper pull back, but downside should be contained by 38.2% retracement of 1.0665 to 1.1200 at 1.0996 to bring rebound. Break of 1.1200 will resume larger rise towards 1.1274 high. However, sustained break of 1.0996 will indicate reversal and turn bias to the downside.
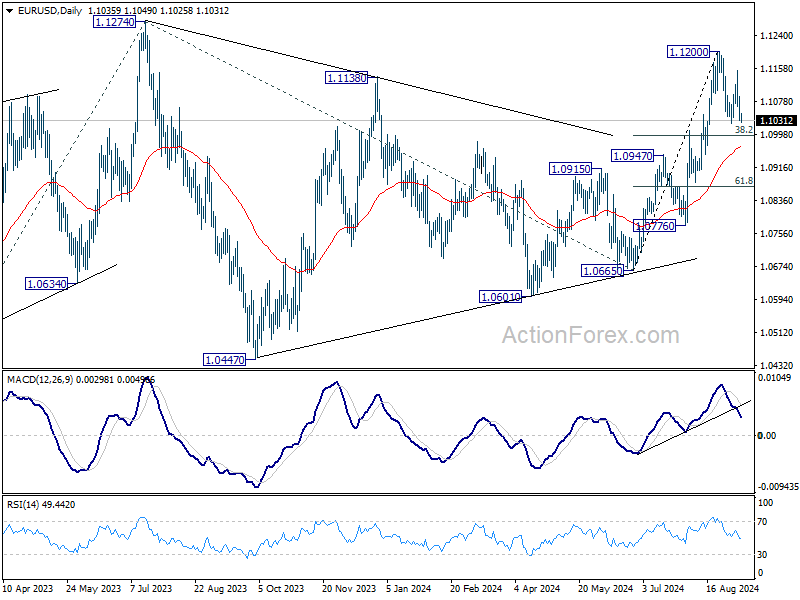
In the bigger picture, prior break of 1.1138 resistance indicates that corrective pattern from 1.1274 might have completed at 1.0665 already. Decisive break of 1.1274 (2023 high) will confirm whole up trend from 0.9534 (2022 low). Next target will be 61.8% projection of 0.9534 to 1.1274 from 1.0665 at 1.1740. This will now be the favored case as long as 1.0947 resistance turned support holds.
GBP/USD Mid-Day Outlook
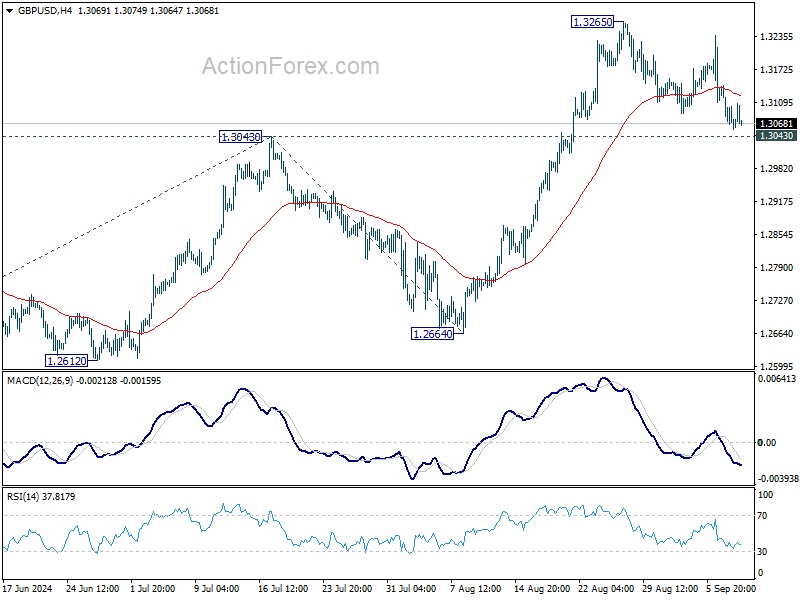
Daily Pivots: (S1) 1.3046; (P) 1.3095; (R1) 1.3121; More...
No change in GBP/USD's outlook and intraday bias remains neutral. Further rise is expected with 1.3043 resistance turned support intact. On the upside, firm break of 1.3265 will resume larger up trend to 100% projection of 1.2298 to 1.3043 from 1.2664 at 1.3409. However, firm break of 1.3043 will turn bias back to the downside for deeper pullback.
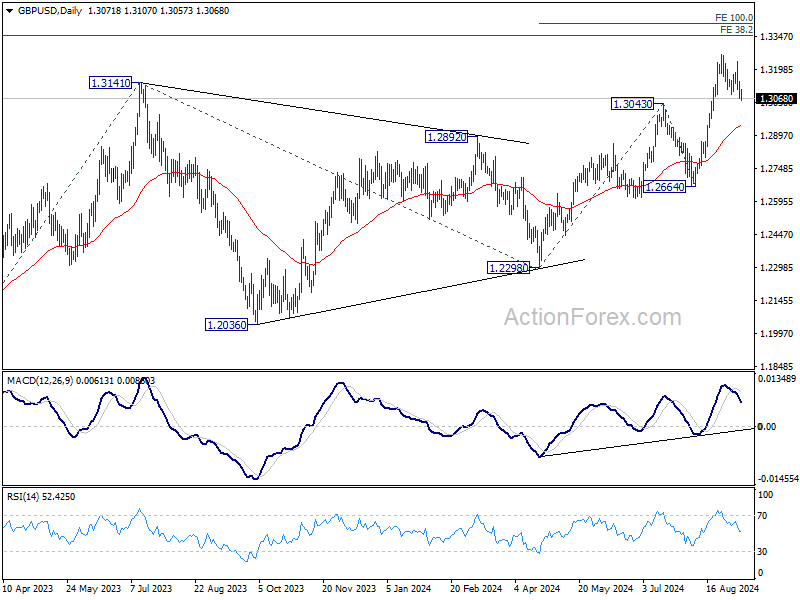
In the bigger picture, up trend from 1.0351 (2022 low) is in progress. Next target is 38.2% projection of 1.0351 to 1.3141 from 1.2298 at 1.3364. For now, outlook will stay bullish as long as 1.2664 support holds, even in case of deep pullback.
Sterling Briefly Lifted by UK Jobs Data, But Forex Markets Remain Subdued
Trading in the forex markets remained relatively subdued today, with limited momentum across major pairs. Sterling saw a brief uptick following robust UK employment data, but the rally quickly lost steam. The data did little to alter expectations that BoE will likely keep rates unchanged next week and wait until November to reassess its stance. However, upcoming key releases, including tomorrow’s GDP data and next week's inflation figures, could still shift market expectations.
Elsewhere, Swiss Franc and Yen are regaining some strength today as recent pullbacks stall. Both currencies remain in a consolidative phase, with traders awaiting further cues from broader risk sentiment. On the weaker side, Canadian Dollar is the worst performer for the day, followed by Euro and Sterling, while Dollar and Australian Dollar are holding a middle ground.
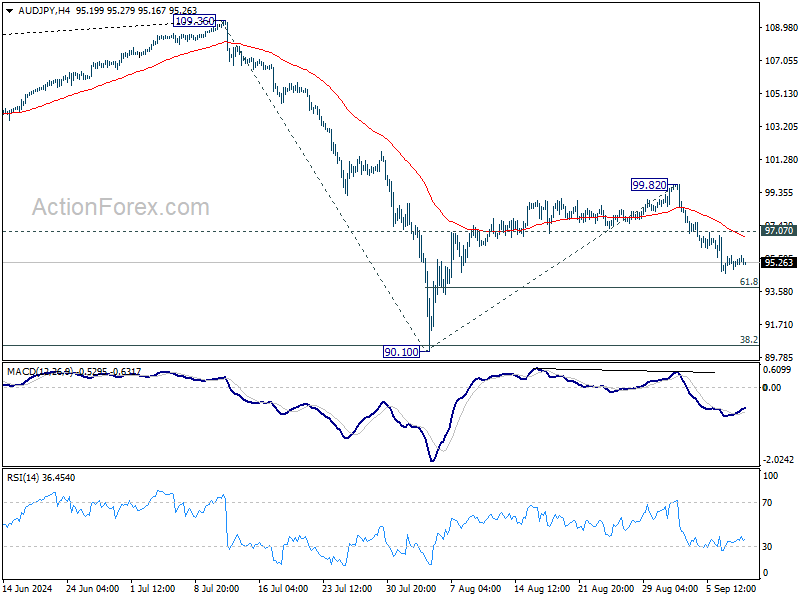
Technically, AUD/JPY turned into sideway trading this week but lacks momentum for a solid recovery. Rise from 90.10 has likely completed at 99.82 already. Deeper fall remains in favor as long as 97.07 resistance holds, for 61.8% retracement of 90.10 to 99.82 at 93.81. Decisive break there will raise the chance of resumption of whole fall from 109.36, and target 90.10 low next.
In Europe at the time of writing, FTSE is down -0.25%. DAX is down -0.46%. CAC is up 0.16%. UK 10-year yield is up 0.0023 at 3.864. Germany 10-year yield is up 0.0106 at 2.181. Earlier in Asia, Nikkei fell -0.16%. Hong Kong HSI rose 0.22%. China Shanghai SSE rose 0.28%. Singapore Strait Times rose 0.46%. Japan 10-year JGB yield fell -0.0001 to 0.895.
BoC Governor Macklem warns of persistent inflation pressures amid global trade slowdown
BoC Governor Tiff Macklem in a speech today raised concerns about the long-term implications of slowing globalization on inflation, indicating that price pressures may remain elevated for some time. Macklem highlighted that "with globalization slowing, the cost of global goods may not decline to the same degree," which could result in upward pressure on inflation.
Macklem also pointed to the ongoing risks of trade disruptions, noting that such disruptions could increase the "variability" of inflation, making it harder to control price stability. He drew on lessons from the pandemic, emphasizing that supply shocks, especially when the economy is overheated, can have an outsized impact on inflation volatility.
The BoC governor acknowledged the challenges supply shocks present to central banks, stating that "monetary policy can’t stabilize growth and inflation at the same time." This, he added, requires central banks to focus on risk management, balancing the risks of rising inflation against the downside to economic growth.
UK payrolled employment falls -59k in Aug, unemployment rate ticks down to 4.1% in Jul
In August, UK payrolled employees fell by -59k or -0.2% month-on-month, marking a significant contraction. Meanwhile, median monthly pay increased by 6.2% yoy, an acceleration from the previous month's 5.5%. Claimant count rose by 23.7k to 1.792m, below the expected 95.5k rise.
For the three months leading up to July, unemployment rate fell slightly from 4.2% to 4.1%, in line with expectations. Wage growth showed signs of further slowing, with regular earnings (excluding bonuses) rising by 5.1% yoy, down from 5.4%, matching market expectations. Total earnings, including bonuses, rose by 4.0% yoy, a deceleration from the previous month's 4.6%, and just below the forecast of 4.1%.
Australian Westpac consumer sentiment falls to 84.6, economic concerns deepen
Australia’s Westpac Consumer Sentiment Index saw a marginal decline of -0.5% mom in September, falling from 85.0 to 84.6, reflecting the ongoing pessimism that has gripped Australian consumers for more than two years. According to Westpac, this persistent negativity shows "no real signs of lifting," with key indicators pointing to growing anxiety about the country's economic outlook.
Sentiment around economic conditions for the next 12 months dropped from 83.3 to 81.2, while unemployment expectations rose sharply from 133.5 to 138.4, signaling growing concerns about job security. However, the interest rate expectations index saw some relief, falling from 135.5 to 123.8, as consumers became less worried about further rate hikes.
Westpac noted that the focus among consumers appears to be shifting. "While cost-of-living pressures are becoming a little less intense and fears of further interest rate rises have eased, consumers are becoming more concerned about where the economy may be headed and what this could mean for jobs," the report highlighted.
Australia's NAB business confidence falls to -4, conditions fairly clearly below average
Australia's NAB Business Confidence fell from 1 to -4 in August. Business Conditions also declined, dropping from 6 to 3. Trading conditions dipped by 2 points, while profitability slid by 1 point. Forward orders remained unchanged at -4.
NAB Chief Economist Alan Oster commented on the data, noting that "conditions are now fairly clearly below average compared to the history of the survey," underscoring the broader weakness in the private sector as the economy slows.
The decline in the employment gauge is particularly notable, as it "suggests the period of very strong private sector labor demand seen throughout the post-Covid period may be coming to an end," Oster added.
China's exports grow 8.7% yoy in Aug, imports up only 0.5% yoy
China's exports grew by a robust 8.7% yoy to USD 308.7B in August, surpassing market expectations of 6.5% yoy growth. However, this impressive figure is largely attributed to base effect, as exports contracted by -8.8% yoy during the same period last year.
Exports to key regions such as the US, the EU, and the ASEAN all posted solid gains. Notably, exports to the EU saw the largest increase, growing 13% yoy.
In terms of imports, China's intake from the US rose by 12% yoy, while imports from the EU showed a decline. Imports from ASEAN grew by 5% yoy. Overall import growth remained weak, increasing by just 0.5% yoy compared to the expected 2.0% yoy.
China's trade surplus widened significantly, rising from USD 84.65B in July to USD 91.02B, exceeding expectation of USD 83.9B.
GBP/USD Mid-Day Outlook
Daily Pivots: (S1) 1.3046; (P) 1.3095; (R1) 1.3121; More...
No change in GBP/USD's outlook and intraday bias remains neutral. Further rise is expected with 1.3043 resistance turned support intact. On the upside, firm break of 1.3265 will resume larger up trend to 100% projection of 1.2298 to 1.3043 from 1.2664 at 1.3409. However, firm break of 1.3043 will turn bias back to the downside for deeper pullback.
In the bigger picture, up trend from 1.0351 (2022 low) is in progress. Next target is 38.2% projection of 1.0351 to 1.3141 from 1.2298 at 1.3364. For now, outlook will stay bullish as long as 1.2664 support holds, even in case of deep pullback.
Economic Indicators Update
| GMT | Ccy | Events | Actual | Forecast | Previous | Revised |
|---|---|---|---|---|---|---|
| 22:45 | NZD | Manufacturing Sales Q2 | 0.10% | 0.70% | 0.80% | |
| 23:50 | JPY | Money Supply M2+CD Y/Y Aug | 1.30% | 1.50% | 1.40% | |
| 00:30 | AUD | Westpac Consumer Confidence Sep | -0.50% | 2.80% | ||
| 01:30 | AUD | NAB Business Conditions Aug | 3 | 6 | ||
| 01:30 | AUD | NAB Business Confidence Aug | -4 | 1 | ||
| 03:00 | CNY | Trade Balance (USD) Aug | 91.0B | 82.1B | 84.7B | |
| 06:00 | GBP | Claimant Count Change Aug | 23.7K | 95.5K | 135K | 102.3K |
| 06:00 | GBP | ILO Unemployment Rate (3M) Jul | 4.10% | 4.10% | 4.20% | |
| 06:00 | GBP | Average Earnings Including Bonus 3M/Y Jul | 4.00% | 4.10% | 4.50% | 4.60% |
| 06:00 | GBP | Average Earnings Excluding Bonus 3M/Y Jul | 5.10% | 5.10% | 5.40% | |
| 06:00 | EUR | Germany CPI M/M Aug F | -0.10% | -0.10% | -0.10% | |
| 06:00 | EUR | Germany CPI Y/Y Aug F | 1.90% | 1.90% | 1.90% | |
| 08:00 | EUR | Italy Industrial Output M/M Jul | -0.90% | -0.10% | 0.50% | |
| 10:00 | USD | NFIB Business Optimism Index Aug | 91.2 | 93.6 | 93.7 |
BoC Governor Macklem warns of persistent inflation pressures amid global trade slowdown
BoC Governor Tiff Macklem in a speech today raised concerns about the long-term implications of slowing globalization on inflation, indicating that price pressures may remain elevated for some time. Macklem highlighted that "with globalization slowing, the cost of global goods may not decline to the same degree," which could result in upward pressure on inflation.
Macklem also pointed to the ongoing risks of trade disruptions, noting that such disruptions could increase the "variability" of inflation, making it harder to control price stability. He drew on lessons from the pandemic, emphasizing that supply shocks, especially when the economy is overheated, can have an outsized impact on inflation volatility.
The BoC governor acknowledged the challenges supply shocks present to central banks, stating that "monetary policy can’t stabilize growth and inflation at the same time." This, he added, requires central banks to focus on risk management, balancing the risks of rising inflation against the downside to economic growth.
UK Job Market Stronger Than Expected But Weaker Than US
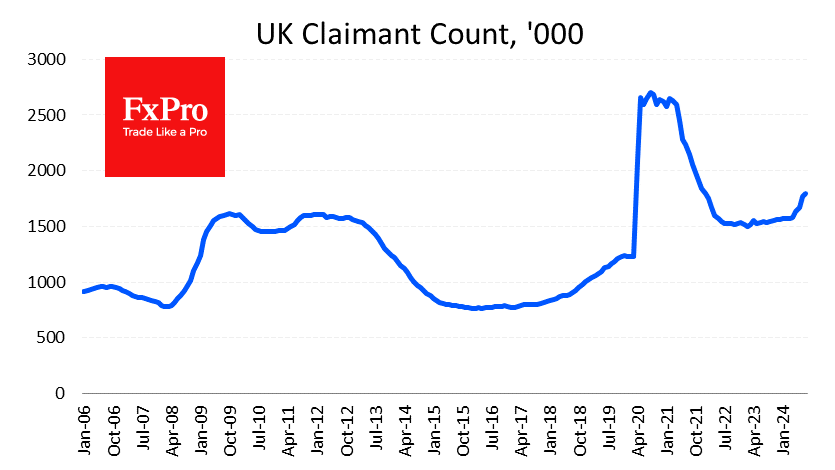
In the UK, jobless claims rose by 23.7K in August, much better than the 95.5K expected and the 102.3K rise in the previous month. This is relatively positive data as it suggests that the rate of deterioration in the UK labour market is slowing. However, this is still the fastest claims growth since the unemployment spike in 2020 and the 2008 financial crisis.
At the same time, wage growth continues to slow, rising by 4% year on year in the three months to July. This is a sharp slowdown from 4.6% in the previous month and 5.7% two months ago, although wage growth is still above inflation at 2.2% year-on-year.
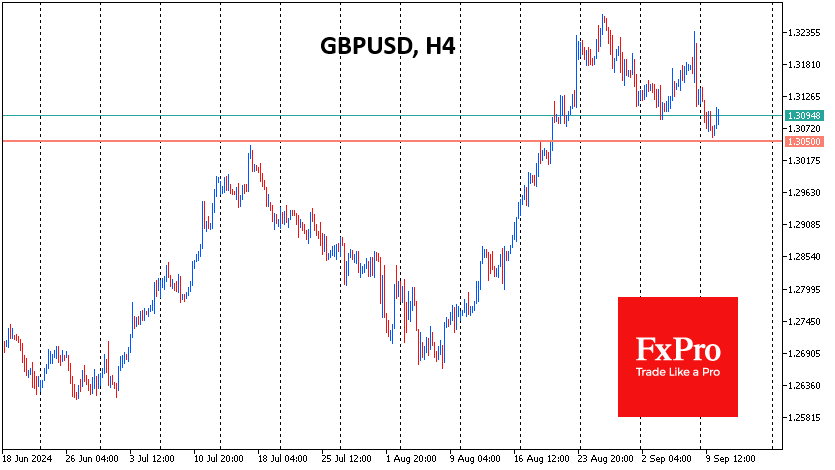
The data did not change the expectations of market analysts, who still do not expect a rate change next week but are forecasting a rate cut in November. The employment data temporarily supported the Pound as speculators played up the positive gap between expectations and reality. GBPUSD found support on Tuesday on the drop to the 1.3050 level, which looks like a bullish attempt to end the corrective pullback and take the Pound into a new round of growth.
While it is wise to wait for tomorrow’s UK CPI figures, which will be released on Wednesday morning, the main movement may be delayed until similar statistics are released from the US. For now, we can only compare labour market figures, and the US figures look stronger. This gives the Bank of England a greater degree of urgency to ease policy than the US, creating bearish risks for GBPUSD.
US: Small Business Optimism Pulls Back in August
NFIB's Small Business Optimism Index fell 2.5 points to 91.2 in August, coming in below market expectations calling for a flat print.
Eight of the ten subcomponents fell on the month, while only two improved. Large declines were recorded in expectations regarding higher real sales (-9 points to -18%), earnings trends (-7 points to -37%) and expectations about an improvement in the economy (-6 points to -13%). Plans to increase inventories also pulled back 3 points to -1%.
Labor market indicators were mixed. The share of businesses planning to increase employment fell 2 points to 13% in August. On the other hand, the share of firms with unfilled job openings rose 2 points to 40%. Quality of labor concerns trended higher, with 21% of business owners (up 2 points on the month) identifying this as their top business problem. Inflation concerns continued to top the list, with 24% of owners identifying this as their top business problem (down 1 point from July).
The share of firms increasing employee compensation held steady at 33%, while the share firms planning to do so in the months ahead rebounded by 2 points to 20%. Both of these measures are at or near their respective post-pandemic lows. Moving over to pricing metrics, the share of businesses 'raising' average selling prices fell 2 points to 20%, while the share of those 'planning’ to raise average selling prices ahead ticked up 1 point to 25%.
Key Implications
Small business confidence retreated in August, fully erasing the improvement made in the month prior. The decline reflected a worsening in earning trends, along with a deterioration in expectations for future sales and business conditions. With the election at our doorstep, uncertainly among small business owners has been rising, with the corresponding subindex increasing further in August to a level that's now rivalling the highs experienced during the onset of the pandemic and those just prior to the 2016 election.
The U.S. labor market is cooling and small business data is partially playing the same tune, with plans to increase employment losing some steam at the end of summer. At the same time, small business job openings have held up recently and labor quality concerns remain elevated. But, despite the latter, businesses are not splurging on wage increases to the same degree that they were earlier in the pandemic. Easing wage metrics, together with more muted price plans add further credence to the view that inflation should continue to trend lower ahead.
USDJPY Lacks Direction, Looks to US CPI
- USDJPY hovers around 20-period moving average (SMA)
- Some upside momentum still present
- Next move will likely depend on US CPI report
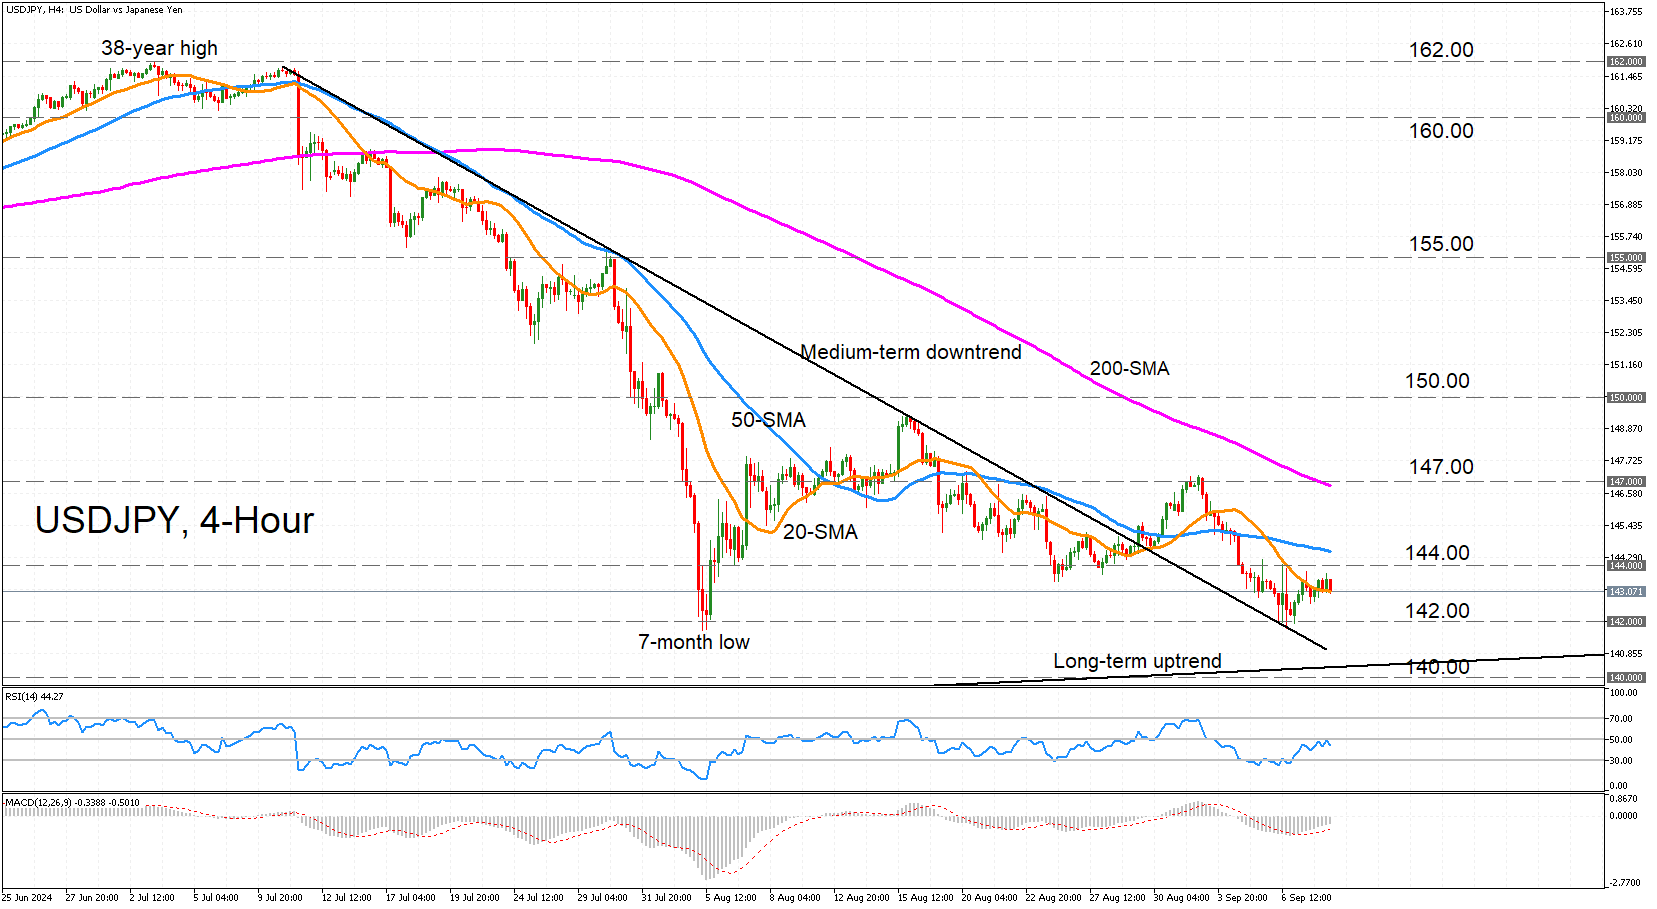
USDJPY is consolidating around its 20-period SMA after the rebound from the one-month low of 141.76 quickly ran out of steam. The RSI is fluctuating right beneath the 50-neutral mark, but the MACD continues to rise above its red signal line in the negative territory.
If the bulls manage to regain control, there’s likely to be a tough battle ahead as the 144.00 level is a short distance away and the 50-period SMA lies slightly higher around 144.50. A break above these obstacles is needed to set course for the 200-period SMA slightly below 147.00.
A climb higher would also take the price above the previous high from early September before the mid-August peak of 149.38 comes into view. After this, all eyes would turn to the 150 handle, which the bulls need to reclaim if they stand any chance of switching the negative medium-term trend to a more bullish one.
However, if the pair slips below its 20-period SMA, the 142.00 level could be tested again. Falling beneath this support barrier would risk a breach of the longer-term ascending trendline, after which there would be a danger of the price falling below 140.00, cementing the bearish structure.
For the moment, though, it’s a very neutral picture, which could last until Wednesday’s inflation report out of the United States at 12:30 GMT, with the data possibly determining the next direction.
AUD/USD Shrugs After Weak Confidence Data
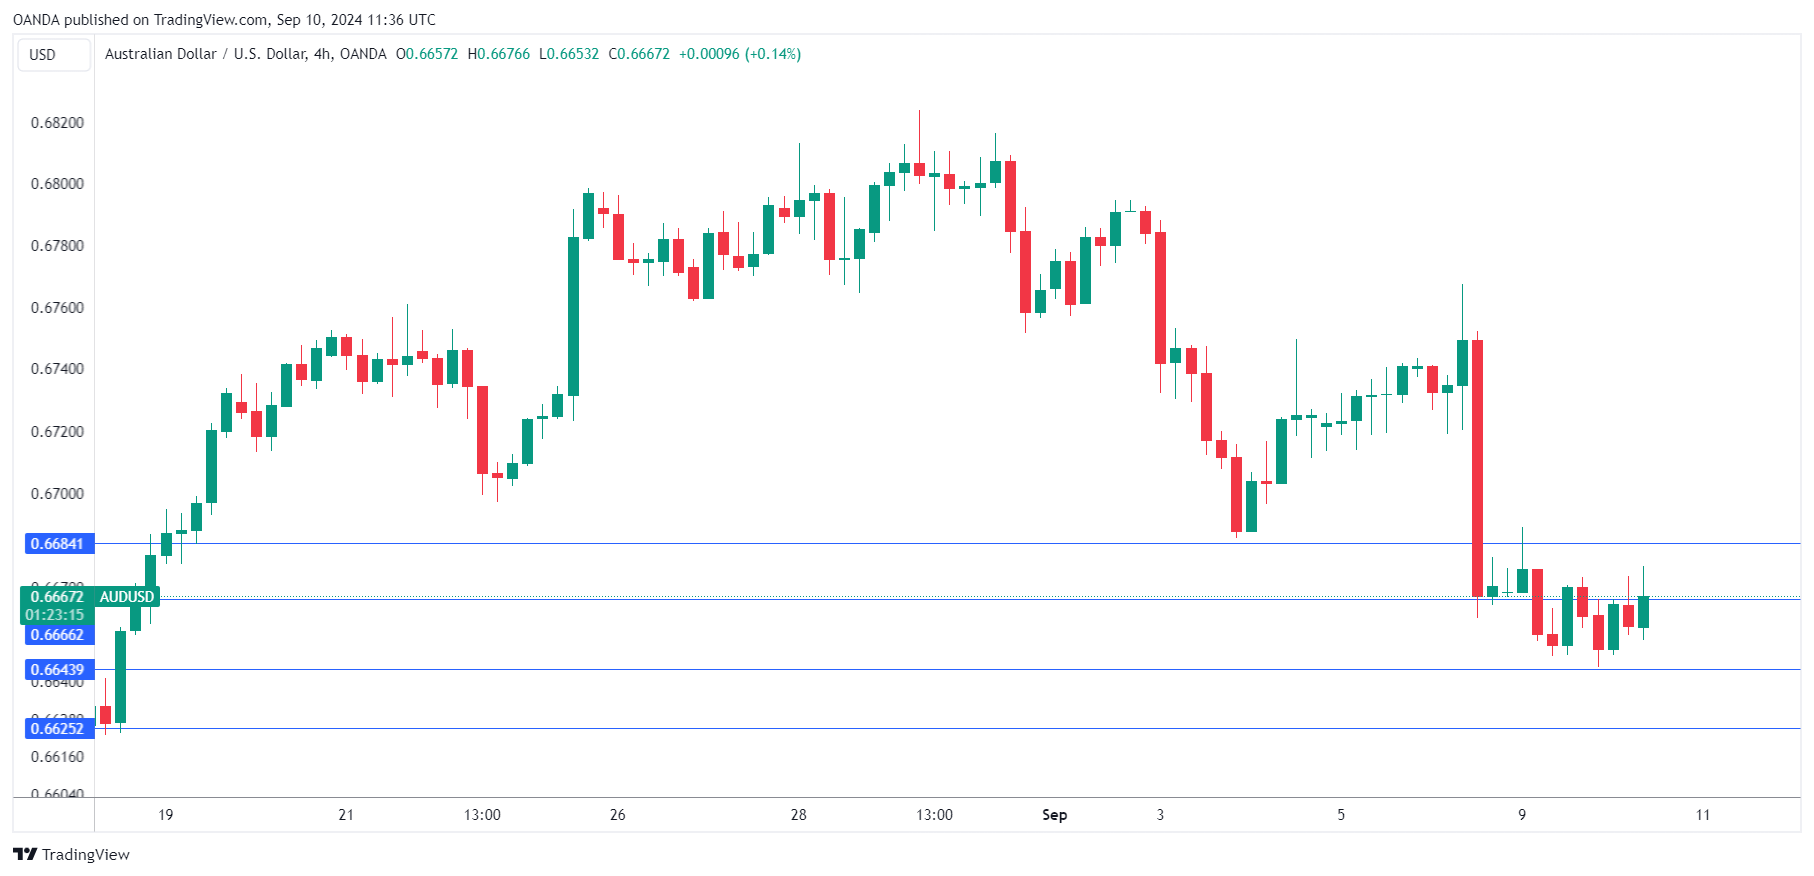
The Australian dollar continues to have a quiet week. AUD/USD is trading at 0.6671 in the European session, up 0.17% today at the time of writing.
With the Australian economy sputtering, it should come as no surprise that today’s confidence indicators pointed downward. Westpac consumer confidence change declined 0.5% m/m in September, falling from 85.0 to 84.6. This was better than the forecast of -1.2% but points to pessimistic consumers who remain nervous about potential job losses in a weak economy.
The National Australia Bank business confidence index fell to -4 in August, its lowest level since November 2023. This followed back-to-back gains. Confidence was down across a range of sectors and business expectations also declined. Business confidence has been stronger than consumer sentiment this year but has now converged as both are showing deep pessimism about economic conditions.
The financial markets have been showing strong swings and the market pricing of a Federal Reserve rate cut are also moving wildly. After Friday’s lukewarm nonfarm payrolls report, the odds of a 50-basis point cut shot up to 59%, up from 43% before the release, according to CME’s FedWatch. That has plunged to just 27% on Tuesday, ahead of tomorrow’s CPI report. We could see the rate-cut odds continue to swing if inflation surprises the markets, which expect a 2.6% gain for August, down from 2.9% in the previous reading.
The Fed meets on Sept. 18 and is widely expected to deliver its first rate cut after a lengthy rate-hike cycle. Now that inflation is largely under control, the Fed is keeping a close eye on the US labor market as it tries to guide the economy to a soft landing. The labor market hasn’t crashed but recent nonfarm payrolls numbers indicate that the labor market is cooling and that could mean a series of rate cuts extending into 2025.
AUD/USD Technical
- AUD/USD is testing resistance at 0.6666. Above, there is resistance at 0.6684
- 0.6643 and 0.6625 are the next support levels
GBP/USD Rises on Robust Labor Data – Challenges Ahead for the BoE
- UK labor data beats expectations, with regular pay rising by 5.1% and employment increasing by 265k.
- BoE faces challenges in balancing strong employment figures with moderating wage growth and rate cut hopes.
- US CPI and PPI, and BoE Deputy Governor Sarah Breeden’s comments, could impact GBP/USD’s trajectory.
The GBP benefitted following a positive UK labor data release this morning. Cable rallied around 30 pips following the data release but has since surrendered the post data gains.
The implications for the Bank of England (BoE) will be interesting as the Central Bank was already expected to cut rates less than peers at the ECB and Federal reserve. The strong employment numbers will no doubt raise inflation concerns however, the moderation in wage growth may be a point that keeps dovish MPC members on board regarding further rate cuts.
In the UK, regular pay, excluding bonuses, rose by 5.1% year-on-year to GBP 647 per week for the three months leading up to July 2024. This marks the smallest increase since June 2022 and follows a 5.4% rise in the prior period, aligning with market expectations. Wage growth decelerated in both the private sector, decreasing to 4.9% from 5.3%, and the public sector, dropping to 5.7% from 6%. The manufacturing sector experienced the highest annual regular wage increase at 5.9%, followed by the finance and business services sector at 5.4%, and the services sector at 5.1%.
UK Wage Growth YoY
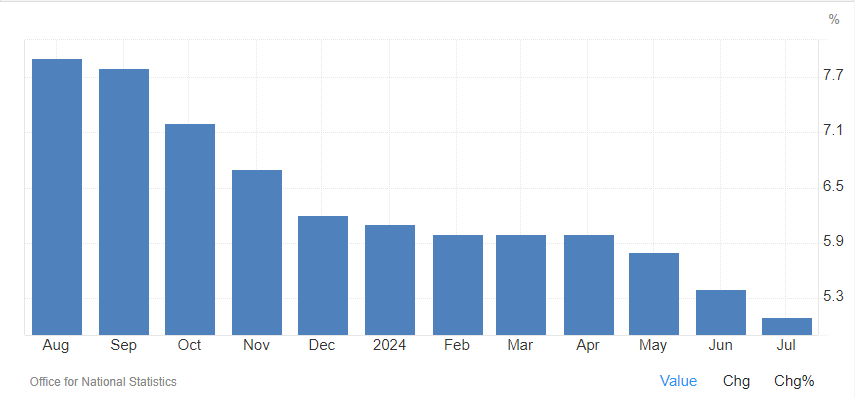
Source: TradingEconomics, ONS
Employment increased by 265k smashing estimates of 115k which is the highest rise in employment over the past 18 months. The drop in unemployment to 4.1% is of course another positive for the UK economy but only compounds the headache facing the Bank of England (BoE).
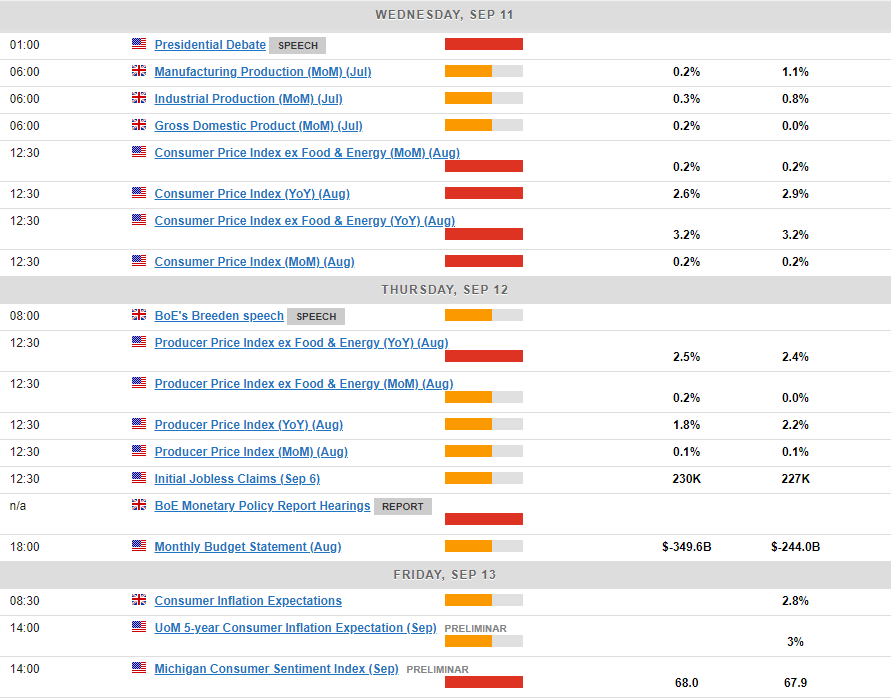
Economic Data Ahead
There is quite a bit of data ahead this week which could impact GBP/USD. The majority of the data comes from the US with CPI released tomorrow and of course PPI on Thursday.
However, I will be more interested in comments from BoE Deputy Governor Sarah Breeden. Given the labor data today it will be key to gauge where BoE policymakers stand regarding rate cuts moving forward. Any sign of diverging policy with the Federal Reserve could have medium to long-term implications for GBP/USD and could be key in where the pair may end up come year-end.
Technical Analysis
Looking at GBP/USD from a technical standpoint and the pair does look like a move lower may continue to unfold. Cable is on a two day losing streak having printed a lower high last week Friday at resistance around 1.3181.
One of the concerns for bears from a price action perspective is that a lower low has already been printed which could pave the way for a short-term pullback. This coupled with UK labor data earlier in the day could prompt some short-term buying pressure.
Looking at the downside and immediate support rests at the 1.3000 psychological level, although cable may find support at around the 1.30400 handle which was the July 17 high.
Conversely, a move higher here will first need to take out the current daily high around 1.3100 before the recent swing high at 1.3181 comes into focus.
GBP/USD Daily Chart, September 10, 2024
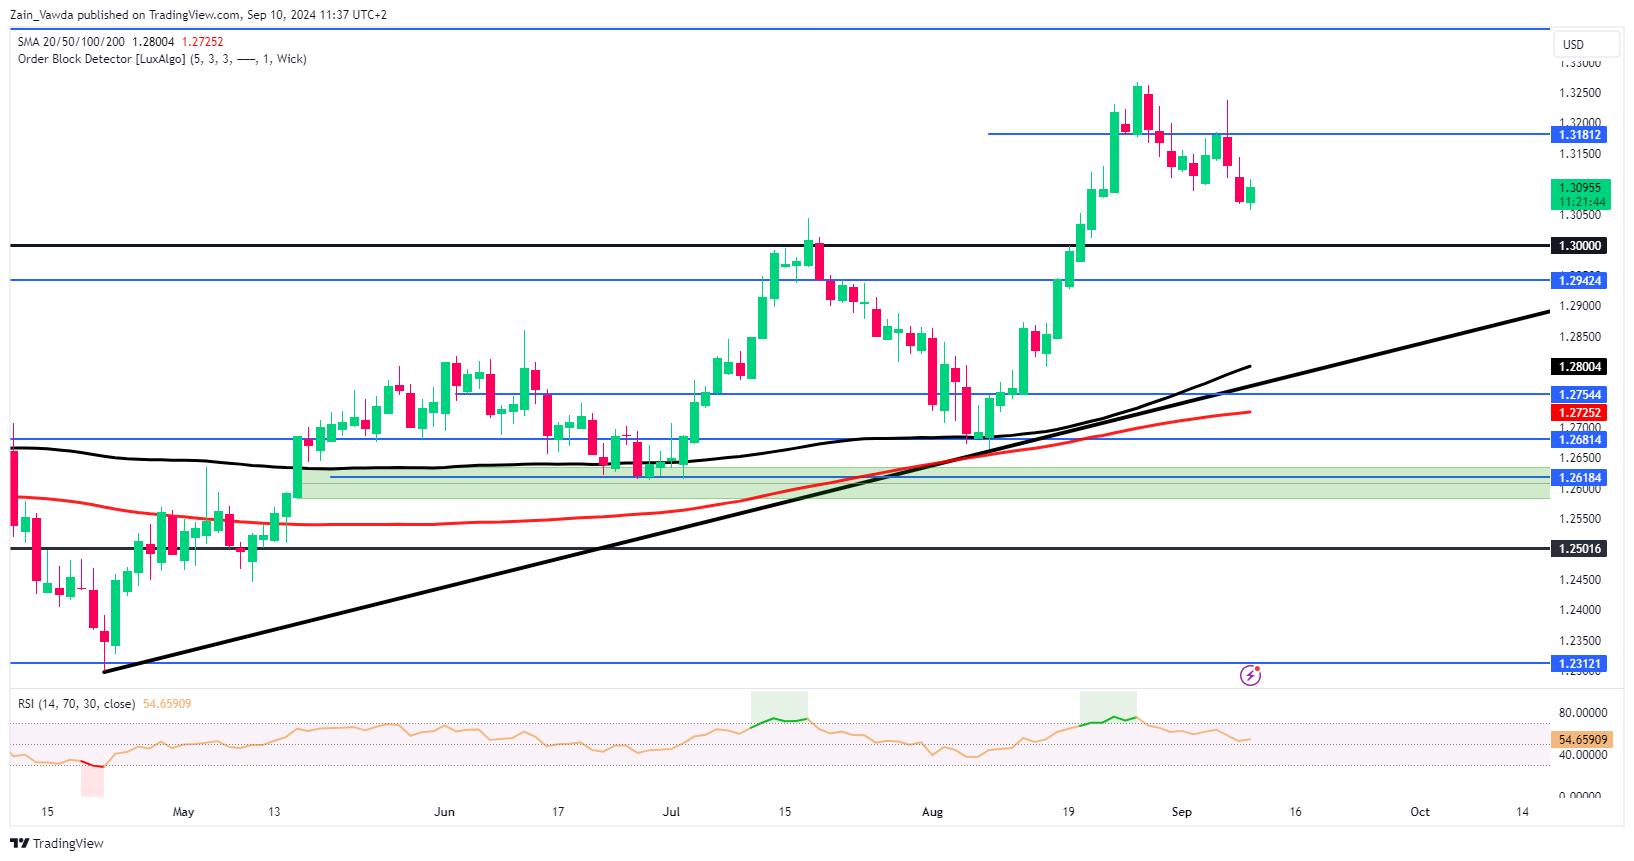
Source:TradingView.com
Support
- 1.3040
- 1.3000
- 1.2942
Resistance
- 1.3100
- 1.3181
- 1.3250