
Sample Category Title
Analysis of GBP/USD Today: Bulls Face Challenges
UK labour market data was released today.
According to Dow Jones Newswires:
→ Employment growth exceeded expectations, and unemployment benefit claims came in lower than forecast. ING analysts believe this supports the view that the Bank of England will cut interest rates more cautiously compared to the Federal Reserve.
→ Capital Economics analysts also suggest that the Bank of England is unlikely to lower rates for a second consecutive month at next week’s policy meeting.
The initial reaction to the positive UK labour market news was a bullish impulse for the pound, with GBP/USD rising from around 1.3080 to break above 1.3100 shortly after the release.
However, the pair then retraced towards its “initial levels,” indicating that bulls are struggling to capitalise on the strong data. This could also signal the dominance of bears.
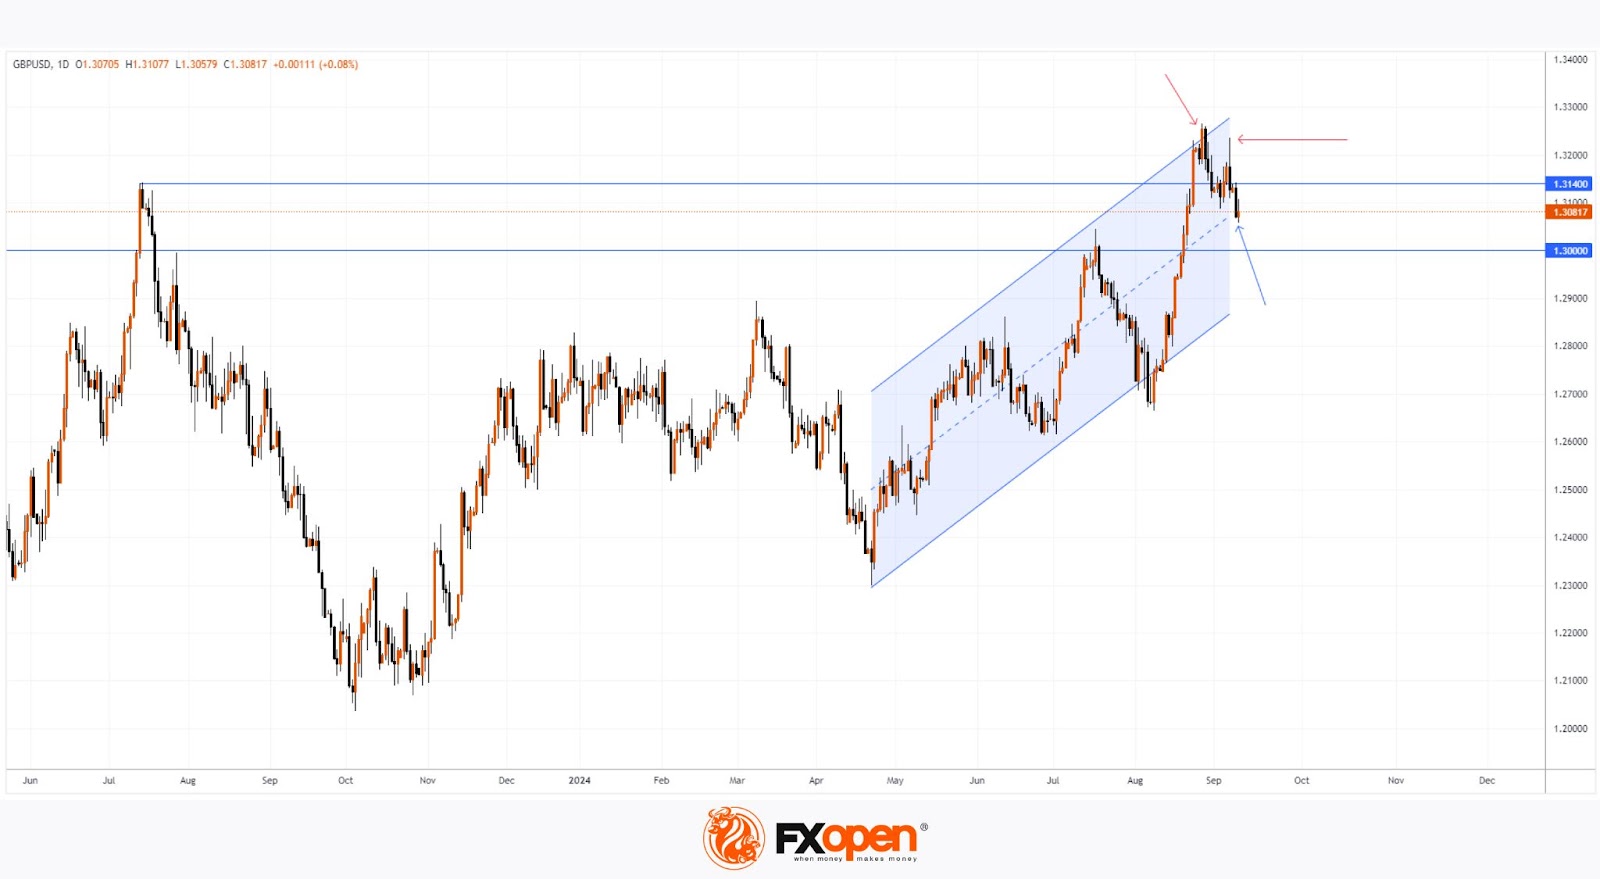
Technical analysis of GBP/USD today points to further bearish signals:
→ The price failed to stay above the previous high around 1.314.
→ A bearish engulfing pattern at the market’s peak (as shown by the first red arrow).
→ A long upper wick on the 6 September candlestick (as indicated by the second red arrow).
Bulls may find support (shown by the blue arrow) from the median of the linear regression channel (in blue). But is this enough to prevent GBP/USD from continuing the downward trend seen since late August and falling towards the channel’s lower boundary?
Much will depend on tomorrow's US inflation data. The Consumer Price Index (CPI) figures will be released at 15:30 GMT+3.
Trade over 50 forex markets 24 hours a day with FXOpen. Take advantage of low commissions, deep liquidity, and spreads from 0.0 pips. Open your FXOpen account now or learn more about trading forex with FXOpen.
This article represents the opinion of the Companies operating under the FXOpen brand only. It is not to be construed as an offer, solicitation, or recommendation with respect to products and services provided by the Companies operating under the FXOpen brand, nor is it to be considered financial advice.
EUR/USD: Faces Again Strong Headwinds at Pivotal Fibo Support
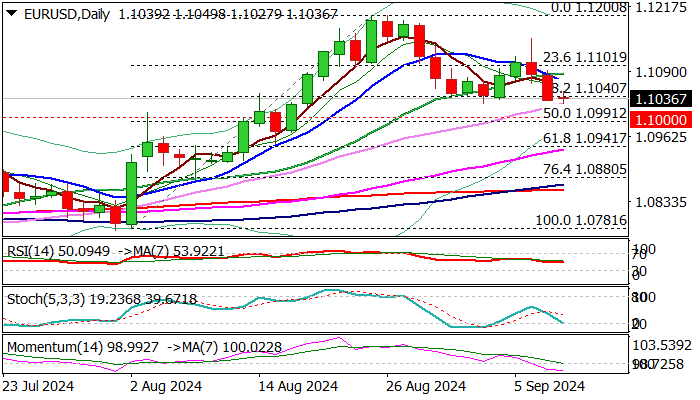
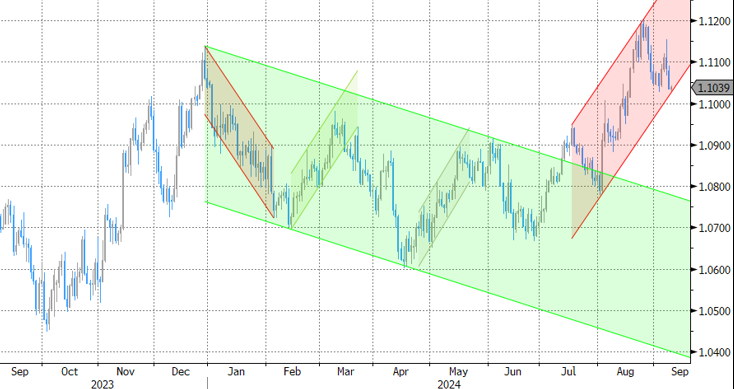
EURUSD is pressuring pivotal support at 1.1040 (Fibo 38.2% of 1.0781/1.1200 bull-leg), after facing several rejections at this level recently.
Tuesday’s action is so far holding in a narrow range, following a strong fall in past two days, with near-term bears hesitating here, due to mixed technical signals on 4-hr and daily chart.
Weaker German inflation in August may add to downside pressure, as well as wide expectations for ECB’s 0.25% rate cut on Thursday however, markets will be closely watching results of US Aug inflation report and signals of a size of Fed rate cut later this month, which will impact the dollar.
Break of 1.1040 pivot would risk test of 1.1000 zone (psychological / 50% retracement of 1.0781/1.1200) and possible extension towards 1.0971 (lower 20-d Bollinger band), which may contain dips.
Strong negative momentum on daily chart works in favor of such scenario, as recently formed 100/200DMA Golden cross adds support, along with rising daily Ichimoku cloud.
The second scenario sees repeated rejection at 1.1040 zone and further signals of formation of a base, although, lift and close above Friday’s peak (1.1065) will be required to confirm, and shift focus to the upside.
Res: 1.1065; 1.1091; 1.1107; 1.1155.
Sup: 1.1026; 1.1000; 1.0971; 1.0935.
Gold Coming Out of Elliott Wave Triangle
On a higher degree time frame, we see gold coming higher into a fifth wave, but it may take some time before it finds the top, as we see an unfinished lower degree impulse.
Gold remains in strong and impulsive five-wave bullish cycle on a daily chart and there's space for more upside, we will just have to be aware of a higher degree wave IV correction still this year, possibly in Q4. Why? Because we see a move out of a triangle here in fifth wave of III, so we know thats the final trust within higher degree extensions, meaning there can be limited upside in weeks ahead, ideally around 2600-2700 area.
https://www.youtube.com/watch?v=c0z1j56onSc
Cautious Rebound in Cryptos
Market Picture
The turnaround in sentiment on the US markets saw the crypto market capitalisation rise by 3.2% in 24 hours to reach $2 trillion. However, it is too early to talk about a reversal in growth, as this level could prove resistant to intensified selling. The Cryptocurrency Sentiment Index rose to 33, the highest since late August, but is still in the ‘fear’ zone.
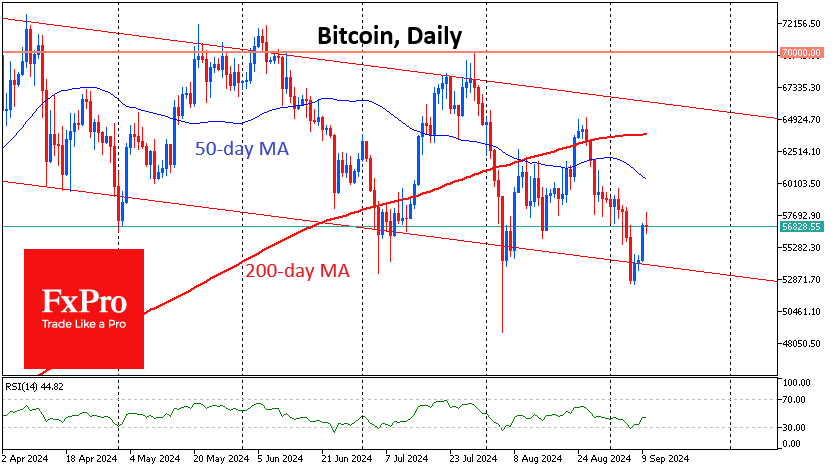
Bitcoin posted an impressive 7% gain on Monday but corrected some of the gains early in the new day, adding 4% in 24 hours. The technical picture remains supportive of a rebound, but buyers are being cautious and taking profits quickly.
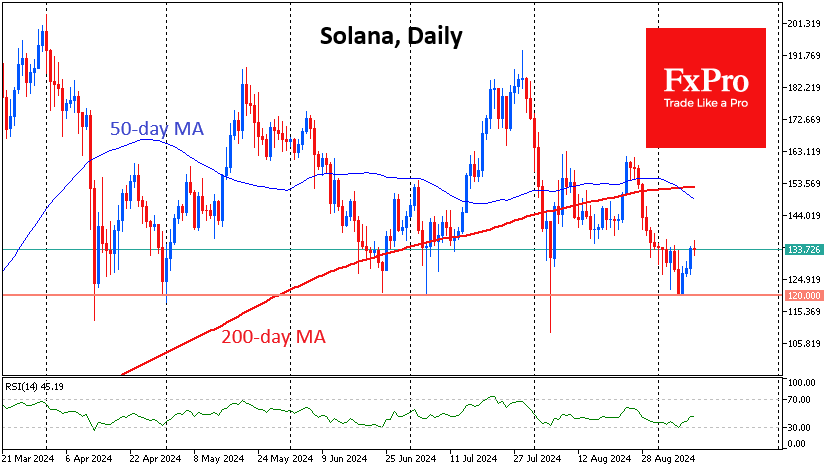
Solana has found support at $120, a key pivot level over the last ten months, and has risen to $134 at the time of writing. Technically, the recovery looks relatively straightforward up to the $149-153 area, where the 50- and 200-day moving averages are centred. A break above $160 would confirm a breakout.
In our view, caution and a tendency to sell growth will prevail in the market, at least until the release of US inflation data on Wednesday. This could continue until the Fed’s interest rate decision on September 18th.
News Background
According to CoinShares, investments in crypto funds fell by $726 million last week, following outflows of $305 million the week before; the figure was the highest since late March. Bitcoin investments fell by $643 million, Ethereum by $98 million and Solana by $6 million.
According to Presto Research, the hash rate hit an all-time high, leaving Bitcoin ‘severely undervalued’. Bianco Research predicts that spot bitcoin ETFs will soon be more in demand in the market.
Bitcoin could reach $90K by the end of the year if Donald Trump wins the US presidential election in November, according to Bernstein. However, if Kamala Harris is successful, BTC could break through the current lows and test levels in the $30K to $40K range. Unlike Trump, Harris did not mention cryptocurrencies in her campaign message.
Cardano founder Charles Hoskinson said that his blockchain has always been the main competitor to the BTC network. The developer is confident that the Cardano cryptocurrency is capable of challenging Bitcoin, the top cryptocurrency by market capitalisation.
GBPUSD on a Slippery Slope
-
- GBPUSD hovers within critical zone
- Stochastics and RSI lose momentum
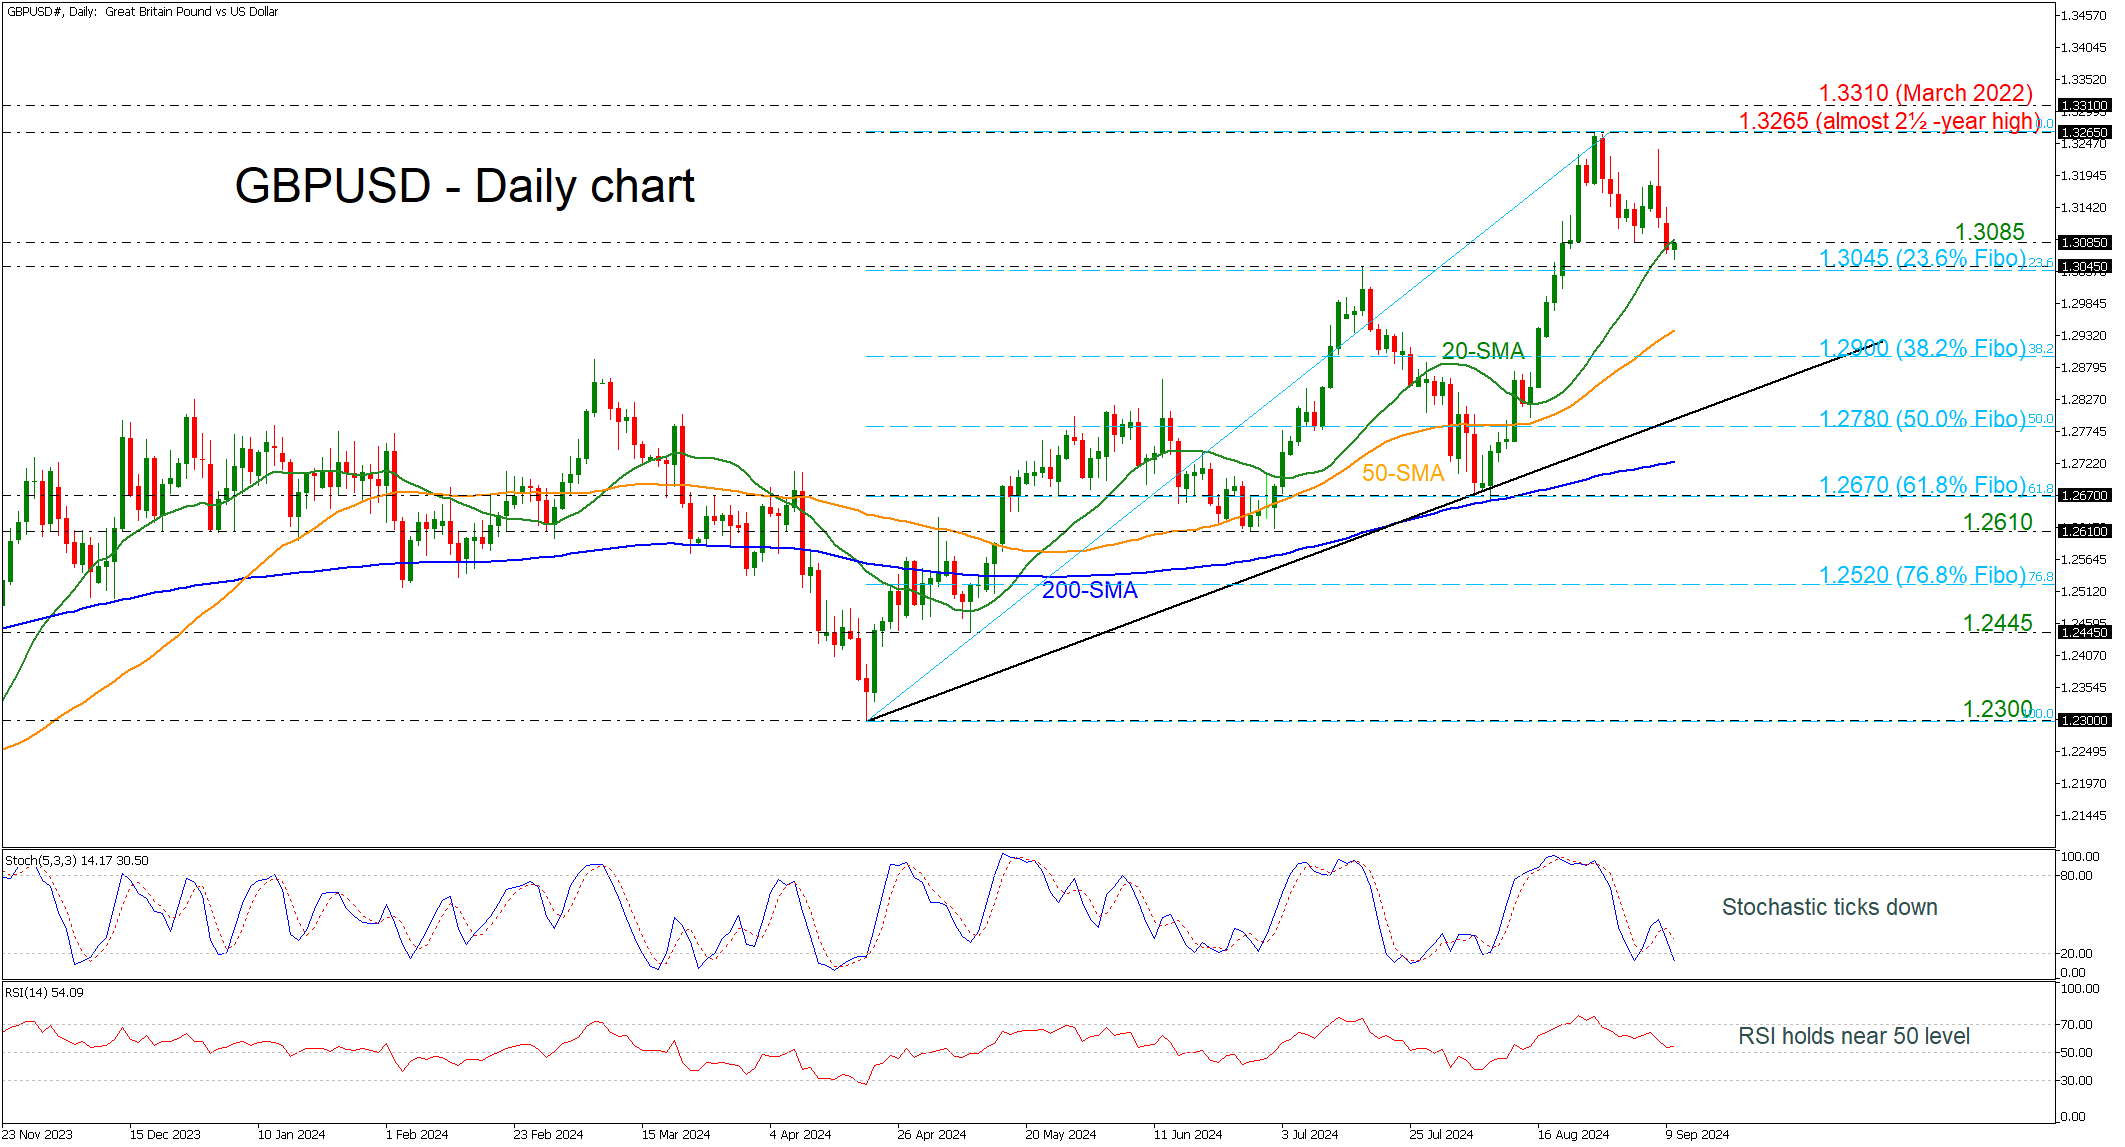
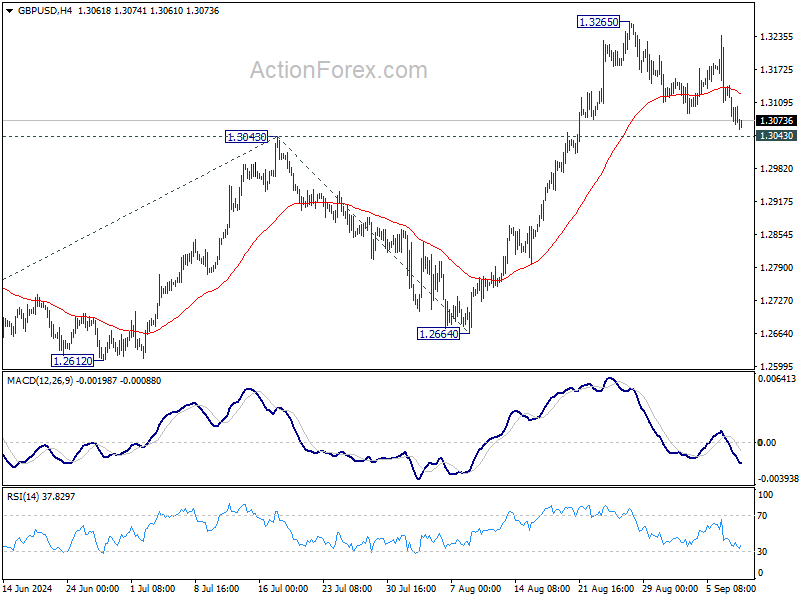
GBPUSD has lost its positive momentum after the pullback on the almost two-and-a-half-year high of 1.3265, trading within the restrictive support area of 1.3045-1.3085, which encapsulates the 23.6% Fibonacci retracement level of the upward wave from 1.2300 to 1.3265.
In the short term, the market could maintain downside risks if the RSI keeps moving around the neutral threshold of 50 and the stochastic continues to move in the oversold territory.
If the pair weakens further, the 50-day simple moving average (SMA) at 1.2940 could provide immediate support ahead of the 38.2% Fibonacci at 1.2900. Even lower, the 50.0% Fibonacci at 1.2780 may attract more attention, as any leg lower could worsen the market’s outlook, opening the way for a bearish bias.
On the other hand, an extension to the upside could meet the area within the 1.3265 peak and the March 2022 top at 1.3310.
To summarize, GBPUSD looks neutral to bearish in the very short-term window; however, the broader picture is strongly positive as long as the market remains well above the medium-term ascending trend line.
Sterling a Tad Stronger After Labour Market Data
Markets
This week’s opening session can be easily classified. Risk sentiment improved somewhat after last week’s beating with key European and US stock markets gaining slightly under/over 1%. That doesn’t cover ground lost though with technical pictures still sending correction vibes. The trade weighted dollar (DXY) last Friday tested the first support in around 100.50/60 in the wake of the payrolls release. The greenback avoided a drop and built on that technical correction momentum yesterday (close 101.55). A move above 102 would be a first technical signal that the USD sell-off momentum since July is morphing into more neutral short term settings. EUR/USD 1.10 is a more or less similar pivot point. Core bonds initially drifted south, but the path of least resistance remains stronger going into this week’s ECB and especially next week’s FOMC meeting. US yields remain stuck at/near this year’s low for all tenors. Today’s empty agenda in the US and EMU suggests more anticipative action ahead of tomorrow’s US August CPI report and Thursday’s ECB meeting. Sterling is a tad stronger after labour market data this morning. Wage growth slowed as expected to 5.1% on an annual basis in the three months to July, while employment rose more than expected in that same time span (+265k 3M/3M). Monthly payrolls for August nevertheless pointed at 59k layoffs (vs +25 k expected).
The ECB is expected to cut its deposit rate for a second time this year by 25 bps, to 3.50%. As announced in March, they will also reduce the spread between the main refinancing rate and the deposit rate from the current 50 bps to only 15 bps implying an MRR rate cut of 60 bps, from 4.25% to 3.65%. Updated GDP and CPI forecasts will be closely watched for clues on the monetary policy trajectory going forward. However, we don’t expect big changes apart from perhaps some minor downward revisions to this year’s GDP and headline CPI data. Recall that ECB staff in June plotted a 0.9%-1.4%-1.6% growth path for 2024-2026 and a 2.5%-2.2%-1.9% inflation trajectory. While keeping an easing bias, we don’t expect the central bank to pre-commit to specific actions at coming meetings. The short intermeeting period between September 12 and October 17 suggests that bar any big surprise, the central bank might be more inclined to sit the October meeting out and stick with the currently, quarterly, rate-reduction scheme with a next 25 bps move coming only in December. Unlike the Fed, the ECB’s options for making policy less restrictive are smaller given limited room towards neutral territory in the current, stubborn, (core) inflationary environment.
News & Views
Investors are urging the Bank of England to expand the maturity range of the bonds it is actively selling under the umbrella of quantitative tightening. The BoE on September 19 announces its new target by which it wants to reduce its gilt portfolio (currently £688bn from a £875bn peak) over the coming 12 months. Sticking to the current pace of £100bn means that the BoE will only actively sell about £13bn (down from about £50bn) of gilts due to a sharp uptick in maturing bonds. These sales will only cover maturities of three years or longer. However, market parties say that the front end of the gilt market is experiencing a notable liquidity problem due to the large stock the BoE holds. Shorter-dated bonds are estimated to be around a third of the total portfolio. Some analysts say this makes them structurally scarce and a potential source of problems in the repo market. Bloomberg’s gilt liquidity tracker has indeed deteriorated in recent weeks to levels seen in the wake of the 2008 financial crisis. Despite the recent improvement it’s still showing poorer liquidity than during the September 2022 gilt crash. Some BoE watchers as a result expect the central bank to actually raise the annual QT target.
The European Commission is mulling sanctions on Robert Fico’s Slovakian government over rule of law concerns. At stake for Slovakia are some of the €12.8bn of allocated European funds and the €2.7bn of EUNextGen grants, officials said. The EU is worried about some recent judicial changes, including a revision to the criminal code that reduces sentences for crimes such as fraud and the decision to scrap an anti-corruption office. The latter was one of the conditions for receiving pandemic-related grants. EU executives are drafting a letter to let Slovakia know it faces punishment. Commission president von der Leyen is said she has yet to decide whether the letter will be sent and when.
Graphs
GE 10y yield
The ECB cut policy rates by 25 bps in June. Stubborn inflation (core, services) make follow-up moves less evident. Markets nevertheless price in two to three more cuts for 2024 as disappointing US and unconvincing EMU activity data rolled in, dragging the long end of the curve down. The move accelerated during the early August market meltdown.
US 10y yield
The Fed in its July meeting paved the way for a first cut in September. It turned attentive to risks to the both sides of its dual mandate as the economy is moving to a better in to balance. The pivot weakened the technical picture in US yields. A string of weak eco data and a risk-off market climate pushed and kept the 10-yr sub 4%. We think we could be up to three 50 bps rate cuts this year.
EUR/USD
EUR/USD moved above the 1.09 resistance area as the dollar lost interest rate support at stealth pace. US recession risks and bets on fast and large rate cuts trumped traditional safe haven flows into USD. EUR/USD 1.1276 (2023 top) serves as next technical references.
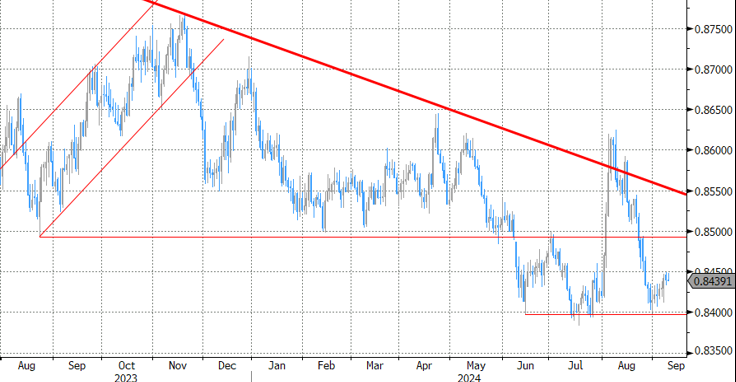
EUR/GBP
The BoE delivered a hawkish cut in August. Policy restrictiveness will be further unwound gradually on a pace determined by a broad range of data. The strategy similar to the ECB’s balances out EUR/GBP in a monetary perspective. Recent better UK activity data and a cautious assessment of BoE’s Bailey at Jackson Hole are pushing EUR/GBP lower in the 0.84/0.086 range.
UK payrolled employment falls -59k in Aug, unemployment rate ticks down to 4.1% in Jul
In August, UK payrolled employees fell by -59k or -0.2% month-on-month, marking a significant contraction. Meanwhile, median monthly pay increased by 6.2% yoy, an acceleration from the previous month's 5.5%. Claimant count rose by 23.7k to 1.792m, below the expected 95.5k rise.
For the three months leading up to July, unemployment rate fell slightly from 4.2% to 4.1%, in line with expectations. Wage growth showed signs of further slowing, with regular earnings (excluding bonuses) rising by 5.1% yoy, down from 5.4%, matching market expectations. Total earnings, including bonuses, rose by 4.0% yoy, a deceleration from the previous month's 4.6%, and just below the forecast of 4.1%.
The Debate
The European and US indices rebounded on Monday, though the rebound was probably not based on high conviction, but looked more like the correction of last week’s decent selloff.
The European Stoxx 600 rebounded to flirt with the 50-DMA resistance, but the investor confidence index unexpectedly worsened in September, the British FTSE 100 recorded the best performance among the major European indices on Monday, but the energy and mining heavy FTSE 100 investors don’t sleep on their both ears given the selling pressure in energy and commodities that is backed by slowing China, and slowing global growth worries beyond China. Iron ore prices for example have now hit the lowest levels in almost two years, copper futures remain comfortably in the negative trend building since May peak, US crude has slipped below the $70pb last week on ample end-of summer driving season supply and growing demand worries (yes, yes also due to China) and Brent crude could soon join its US peer below the $70pb mark.
Consequently, Rio Tinto and Glencore in the FTSE 100 are among the worse performers of the index so far this year, while BP sank to the lowest levels in almost two years. So, yes, the FTSE 100’s ytd performance isn’t bad thanks to aerospace and defense companies. But the global growth concerns and gloomy outlook will likely limit the FTSE 100’s upside potential.
FTSE futures are in the negative at the time of writing.
In the US, the 2-year yield consolidated below the 3.70% level, but the US dollar index rebounded ahead of Wednesday’s CPI data – that will certainly not change the expectation of a 25bp cut from the Federal Reserve (Fed) at next week’s policy meeting, but that could – if significantly different than expectations – revive or temper the dovish Fed expectations for the rest of the year. The EURUSD extended losses to 1.1040 on rising dovish bets into Thursday’s European Central Bank (ECB) meeting, while the USDJPY rebounded from August lows.
Meh...
Apple closed nearly flat after revealing its new products yesterday. Apple Intelligence failed to impress. Many investors think that the AI capabilities remain relatively weak and can’t trigger a massive surge in new product sales, even less so as these features will be gradually updated and won’t even be available at the products’ launch date. As a result, Apple plunged as much as 1.5% during the event and closed the session slightly in the positive.
Trump vs Harris
Market’s attention will shift to politics as Donald Trump and Kamala Harris will face off in a debate today. We already mentioned that a Trump win would benefit Big Oil companies, small domestic businesses and cryptocurrencies. If we do the same exercise for Kamala Harris, a Harris win would support the ESG and green focused companies, healthcare, infrastructure and technology as she puts a particular emphasis on sustainable and inclusive growth.
Harris and Trump in Their First Face-Pff
In focus today
In the US, we get the NFIB Small Business Survey. Also, Fed Governor Barr is expected to announce a reduction in the biggest banks' capital hike in the latest Basel plan, from 19% to 9%, according to Bloomberg. Later, Kamala Harris and Donald Trump will have their first live debate at 9 pm ET, which could shift momentum in the still-open race. Read more on US politics in the US Election Monitor - Latest data shows Harris in a narrow lead, 6 September.
In Germany, the final August inflation data will be published, providing insight into inflation drivers, especially the 'LIMI' indicator of domestic inflation.
In the UK, the labour market report for July/August will be released at 8:00 CET. A range of indicators point to a gradually loosening labour market, and we expect this to be increasingly reflected in the official data.
In Norway, August inflation data is released, where we expect core inflation at 3.0 % y/y. The figure will be negatively affected by a reduction in maximum kindergarden prices from 1 August. Statistics Norway will publish a core figure adjusted for this, which we estimate to 3.2 % y/y, compared to Norges Bank's estimate of 3.6% y/y from the June MPR. In general, we expect a broad-based decline in price pressures, with a particular focus on domestic service price inflation.
In Sweden, July activity data will be released at 8:00 CET, including industrial production, household consumption, industrial orders, and the GDP indicator. While the latter should be viewed cautiously amid the prediction capability, it provides an initial gauge for Q3 GDP. In the afternoon, the ceremonial opening of the parliament takes place, where the PM will present the government declaration and his new government.
Economic and market news
What happened overnight
In China, trade data for August showed exports unexpectedly rising 8.7% y/y (cons: 6.5%), the fastest pace since March 2023, while imports were weaker than expected at 0.5% y/y (cons: 2.0%), reflecting soft domestic demand. Despite momentum fading recently amid a weaker global manufacturing sector, exports continue to be a key driver of the Chinese economy.
What happened yesterday
In the US, the NY Fed Survey of Consumer Expectations showed little change in inflation outlooks for August, with 1y and 5yr expectations remained unchanged at 3% and 2.8%, respectively. The 3y outlook edged up to 2.5% from 2.3% in July.
In the euro area, the Sentix index was weaker than expected at -15.4 (cons: -12.5). The reading was the third straight month with deteriorating investor sentiment, primarily due to the frail German economy.
Former ECB president, Mario Draghi, presented his report on EU competitiveness, calling for a "new industrial strategy for Europe". He recommends raising EU investments by EUR 750-800bn annually to fund reforms to stop the EU from falling behind China and the US. While Draghi has no formal legislative power in the EU, the report serves as an expert input for EU lawmakers, with some of the measures already spelled out in EC President Ursula von der Leyen's new political guidelines. However, significant initiatives that could really boost the Unition are less likely due to the political landscape and budgetary problems.
Equities: Global equities were higher on Monday, following a significant sell-off last week. Most trends from last week were reversing, although they only reclaimed a minor part of the losses. Please note, bond yields were relatively flat and defensive stocks only marginally underperformed. In other words, there was nothing yesterday that suggested growth concerns have abated. In the US yesterday, Dow +1.2%, S&P 500 +1.2%, Nasdaq +1.2%, and Russell 2000 +0.3%. Asian markets are mixed this morning, as are US futures. Core European futures are marginally higher.
FI: Initially, global bond yields rose in Asian trading this morning, however at the end of the day, yields have declined and are back at the level from Friday with 10Y US Treasuries trading around the 3.70%-level, while 2Y US Treasuries are trading at 3.67%. In the European market, 10Y Bunds ended at 2.16%, so there is a bit of distance to the levels seen in January 2024, when 10Y Bunds were trading at the 2%-level. However, the curves have steepened since January as the market is pricing in more rate cuts compared to the pricing in January especially in the US, where the first move could be a 50bp rate cut on September 18 from the Federal Reserve. Today, the US Treasury will sell USD 58bn in a 3Y benchmark and given the solid demand for Treasuries it will be interesting to see the demand ahead of the FOMC meeting next week. The Treasury will also tap in the 10Y and 30Y segments on Wednesday and Thursday, respectively.
FX: The USD was the primary outperformer in the first session of the week which notably saw the Scandies trade poorly despite a recovery in risk sentiment.
UK Employment Data Takes Center Stage Amid Market Caution
The forex markets have remained largely subdued in today's Asian session, with most major currency pairs moving within a narrow range from yesterday. Investor sentiment stabilized overnight, with major US stock indexes closing higher. However, caution is still the prevailing mood as traders await tomorrow's US CPI data, which will be pivotal in shaping Fed's next move. The inflation data will likely be the key determinant in whether Fed opts for a modest 25bps rate cut or a more aggressive 50bps cut at its upcoming meeting.
Earlier today, Australian data had little impact on market sentiment. Consumer confidence in Australia continues to linger at low levels, a trend that has persisted for over two years. Business confidence, meanwhile, has turned negative, signaling rising concerns about the economic outlook. These concerns suggest that RBA's restrictive policies are cooling the economy as intended, but there is little to suggest that the central bank will bring forward its policy easing cycle, which is supposed to begin next year.
Looking ahead, the spotlight is now on the UK, where employment data is due for release. BoE is expected to take a measured approach to rate cuts, with many analysts believing that next week's BoE meeting may be too early for another rate reduction. However, this cautious stance depends heavily on no major negative surprises in today's job data, tomorrow's GDP figures, and next week's CPI report.
For the week so far, Loonie is leading the pack as the strongest performer, followed by Aussie and then Dollar. At the other end, Swiss Franc is the weakest, with Yen and Kiwi also under pressure. Euro and Sterling are positioned in the middle.
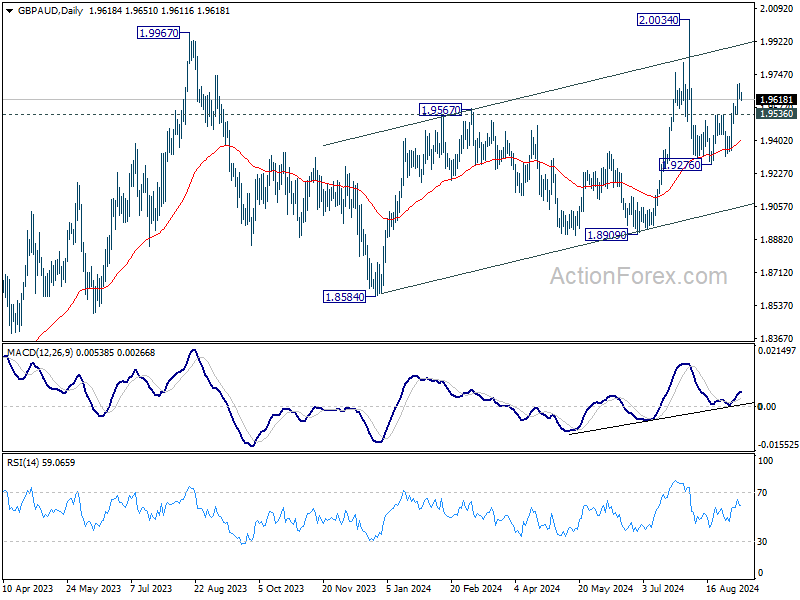
Technically, GBP/AUD's pullback from 2.0034 could have completed at 1.9276 already. Multiple support from 55 D EMA is a near term bullish sign too. Further rise is now expected to retest 2.0034 first. Firm break there will resume larger rally. However, break of 1.9536 will suggest that correction from 2.0034 is probably extending with another falling leg through 1.9276.
In Asia, at the time of writing, Nikkei is up 0.08%. Hong Kong HSI is up 0.28%. China Shanghai SSE is up 0.28%. Singapore Strait Times is up 0.38%. Japan 10-year JGB yield is down -0.0001 at 0.895. Overnight, DOW rose 1.20%. S&P 500 rose 1.16%. NASDAQ rose 1.16%. 10-year yield fell -0.013 to 3.697.
Australian Westpac consumer sentiment falls to 84.6, economic concerns deepen
Australia's Westpac Consumer Sentiment Index saw a marginal decline of -0.5% mom in September, falling from 85.0 to 84.6, reflecting the ongoing pessimism that has gripped Australian consumers for more than two years. According to Westpac, this persistent negativity shows "no real signs of lifting," with key indicators pointing to growing anxiety about the country's economic outlook.
Sentiment around economic conditions for the next 12 months dropped from 83.3 to 81.2, while unemployment expectations rose sharply from 133.5 to 138.4, signaling growing concerns about job security. However, the interest rate expectations index saw some relief, falling from 135.5 to 123.8, as consumers became less worried about further rate hikes.
Westpac noted that the focus among consumers appears to be shifting. "While cost-of-living pressures are becoming a little less intense and fears of further interest rate rises have eased, consumers are becoming more concerned about where the economy may be headed and what this could mean for jobs," the report highlighted.
Australia's NAB business confidence falls to -4, conditions fairly clearly below average
Australia's NAB Business Confidence fell from 1 to -4 in August. Business Conditions also declined, dropping from 6 to 3. Trading conditions dipped by 2 points, while profitability slid by 1 point. Forward orders remained unchanged at -4.
NAB Chief Economist Alan Oster commented on the data, noting that "conditions are now fairly clearly below average compared to the history of the survey," underscoring the broader weakness in the private sector as the economy slows.
The decline in the employment gauge is particularly notable, as it "suggests the period of very strong private sector labor demand seen throughout the post-Covid period may be coming to an end," Oster added.
China's exports grow 8.7% yoy in Aug, imports up only 0.5% yoy
China's exports grew by a robust 8.7% yoy to USD 308.7B in August, surpassing market expectations of 6.5% yoy growth. However, this impressive figure is largely attributed to base effect, as exports contracted by -8.8% yoy during the same period last year.
Exports to key regions such as the US, the EU, and the ASEAN all posted solid gains. Notably, exports to the EU saw the largest increase, growing 13% yoy.
In terms of imports, China's intake from the US rose by 12% yoy, while imports from the EU showed a decline. Imports from ASEAN grew by 5% yoy. Overall import growth remained weak, increasing by just 0.5% yoy compared to the expected 2.0% yoy.
China's trade surplus widened significantly, rising from USD 84.65B in July to USD 91.02B, exceeding expectation of USD 83.9B.
Looking ahead
UK employment data is the key focus in European session today. The US calendar is empty.
GBP/USD Daily Outlook
Daily Pivots: (S1) 1.3046; (P) 1.3095; (R1) 1.3121; More...
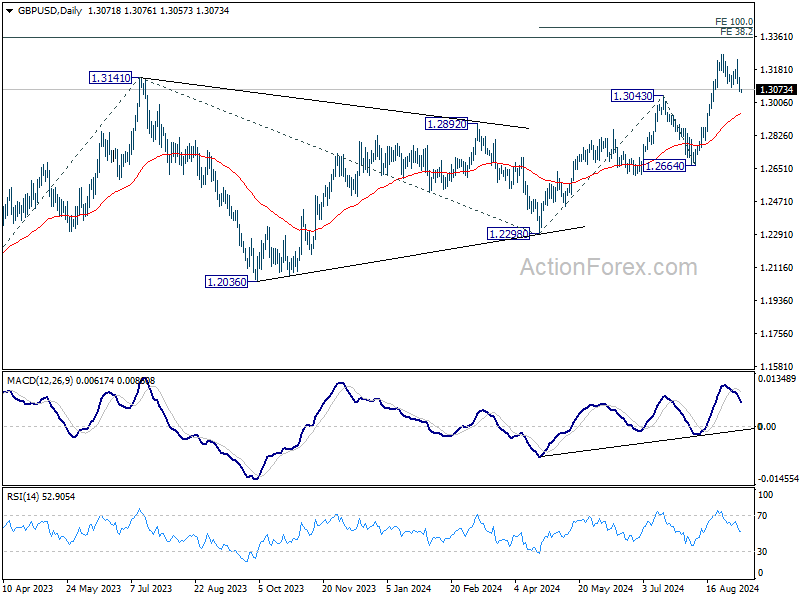
Intraday bias in GBP/USD remains neutral and outlook is unchanged. Further rise is expected with 1.3043 resistance turned support intact. On the upside, firm break of 1.3265 will resume larger up trend to 100% projection of 1.2298 to 1.3043 from 1.2664 at 1.3409. However, firm break of 1.3043 will turn bias back to the downside for deeper pullback.
In the bigger picture, up trend from 1.0351 (2022 low) is in progress. Next target is 38.2% projection of 1.0351 to 1.3141 from 1.2298 at 1.3364. For now, outlook will stay bullish as long as 1.2664 support holds, even in case of deep pullback.
Economic Indicators Update
| GMT | Ccy | Events | Actual | Forecast | Previous | Revised |
|---|---|---|---|---|---|---|
| 22:45 | NZD | Manufacturing Sales Q2 | 0.10% | 0.70% | 0.80% | |
| 23:50 | JPY | Money Supply M2+CD Y/Y Aug | 1.30% | 1.50% | 1.40% | |
| 00:30 | AUD | Westpac Consumer Confidence Sep | -0.50% | 2.80% | ||
| 01:30 | AUD | NAB Business Conditions Aug | 3 | 6 | ||
| 01:30 | AUD | NAB Business Confidence Aug | -4 | 1 | ||
| 03:00 | CNY | Trade Balance (USD) Aug | 91.0B | 82.1B | 84.7B | |
| 06:00 | GBP | Claimant Count Change Aug | 95.5K | 135K | ||
| 06:00 | GBP | ILO Unemployment Rate (3M) Jul | 4.10% | 4.20% | ||
| 06:00 | GBP | Average Earnings Including Bonus 3M/Y Jul | 4.10% | 4.50% | ||
| 06:00 | GBP | Average Earnings Excluding Bonus 3M/Y Jul | 5.10% | 5.40% | ||
| 06:00 | EUR | Germany CPI M/M Aug F | -0.10% | -0.10% | ||
| 06:00 | EUR | GermanyCPI Y/Y Aug F | 1.90% | 1.90% | ||
| 08:00 | EUR | Italy Industrial Output M/M Jul | -0.10% | 0.50% | ||
| 10:00 | USD | NFIB Business Optimism Index Aug | 93.6 | 93.7 |