Sample Category Title
Dollar Index Remains Within Near-Term Range Ahead of Key US Inflation Data
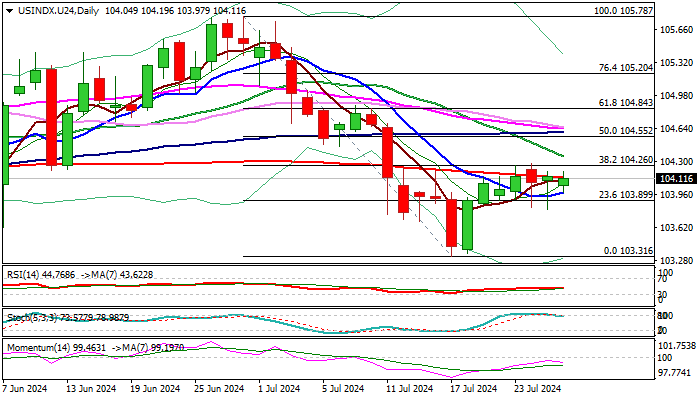
The dollar index edged higher in Friday morning but is still holding within a choppy range that extends into sixth straight day.
Long tails of daily candle of past two days and repeated closes above north turning 10DMA, add to existing bullish near-term bias.
Fresh strength is probing again through 200DMA (104.13), which capped the recent action and pressuring next pivotal barrier at 104.26 (Fibo 38.2% of 105.78/103.31) with sustained break here needed to generate fresh bullish signal and open way for further recovery.
However, risk of repeated stall here exists, as 14-d momentum is still in the negative territory and stochastic is reversing from overbought zone.
Look for firmer direction signals of break of either pivotal levels – 103.97 (10DMA) on the downside, or 104.26 (Fibo 38.2%) at the upside.
Fundamentals are likely to play a key role in driving the dollar today, after upbeat US Q2 GDP provided support on Thursday, with markets focusing on release of US PCE data (Fed’s preferred inflation gauge), to get more details about the timing of Fed’s rate cuts.
Markets expect the central bank to stay on hold in next week’s policy meeting, but to deliver three rate cuts by the end of the year, with wide expectations for the action to start in September.
Res: 104.26; 104.34; 104.55; 104.67.
Sup: 103.97; 103.80; 103.67; 103.31.
USD/JPY Remains Volatile, US PCE Price Index Next
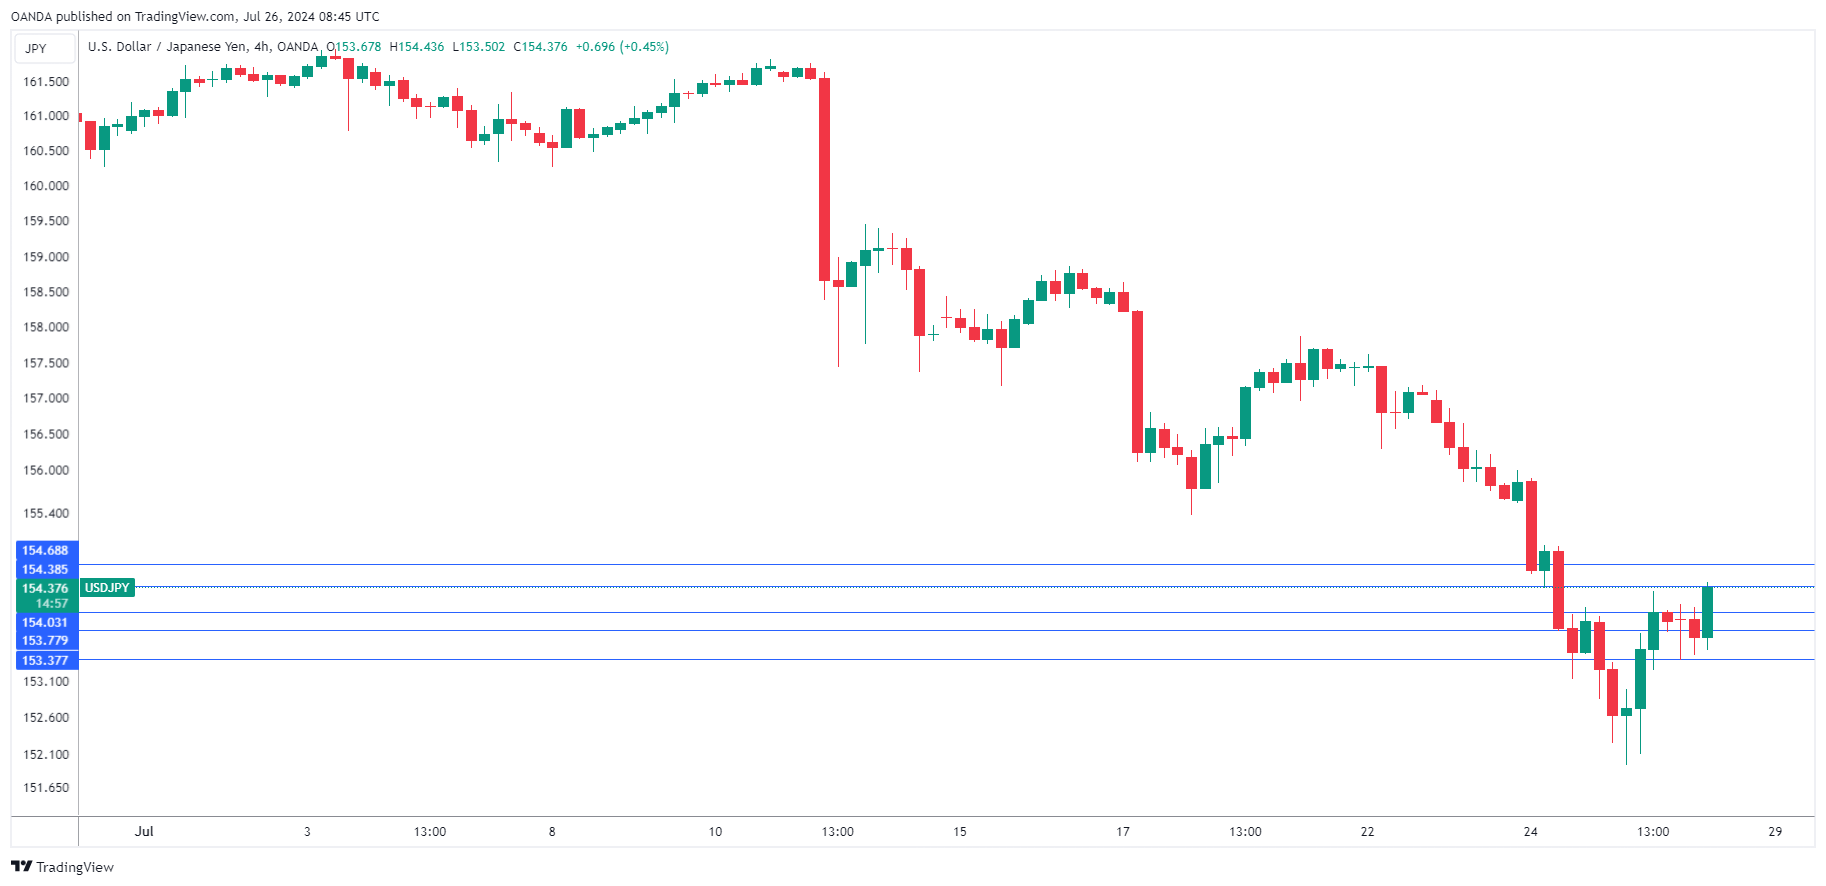
The Japanese yen has hit the brakes on this week’s impressive rally. USD/JPY is trading at 154.34 in the European session, up 0.30% on the day. On Thursday, the yen climbed as much as 1.3% but gave up all of those gains after the strong US GDP report. Still, the yen is up 1.9% this week.
Tokyo Core CPI ticks higher
Tokyo Core CPI rose to 2.2% y/y in July, a notch higher than the 2.1% gain in June and matching the market forecast. This is the third straight acceleration and the highest level since March. Higher electricity prices drove the gain. Earlier this week, service inflation for businesses rose to 3% in July, up from 2.7% in June and above the market forecast of 2.6%. This was the highest level in 33 years.
The Bank of Japan faces a tough task and must decide whether to maintain policy or deliver a rate hike at next week’s meeting. It’s a close call as to what decision the central bank will make and Bank officials can be expected to maintain radio silence.
There are strong arguments for both sides. Inflation and wage growth have been moving higher which would support a rate hike. As well, a rate hike could give a boost to the yen, which has been trading at multi-year lows. On the other hand consumption remains weak and a rate hike would only further dampen consumer spending.
Fed eyes Core PCE Price index
Later today, the US releases Core PCE Price index, which is the Federal Reserve’s preferred inflation measure. The index is expected to rise 0.1% m/m in June, matching the May figure. The PCE Price index is expected to ease to 2.5% y/y, down a notch from 2.6% in May.
USD/JPY Technical
- USD/JPY has pushed past resistance at 154.03 and is testing resistance at 154.39, followed by 154.68
- 153.74 and 153.38 are the next support levels
ECB consumer survey: Inflation expectations steady, economic growth outlook deteriorates
The latest ECB Consumer Expectations Survey results revealed stable inflation expectations but a more negative outlook for economic growth.
Median inflation expectations for the next 12 months remained unchanged at 2.8%, holding at their lowest level since September 2021. Similarly, inflation expectations for three years ahead stayed steady at 2.3%.
However, economic growth projections have taken a downturn. Expectations for growth over the next 12 months worsened, with the median forecast dropping to -0.9%, compared to -0.8% in May.
On a positive note, expectations for the unemployment rate in 12 months' time decreased slightly to 10.6% from 10.7% in May, marking the lowest level since the series began.
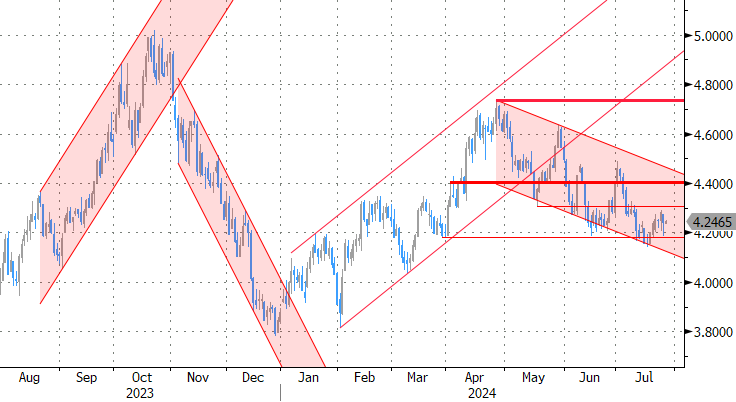
USDCAD Eases After Aggressive Rally to 1.3845
- USDCAD exits from consolidation area
- Momentum oscillators indicate bearish correction
USDCAD rallied towards the 1.3845 high and completed the seventh consecutive green day on Thursday following the bounce off the 200-day simple moving average (SMA) near 1.3600. The pair climbed above the medium-term trading range, suggesting more gains may be on the cards.
However, the technical oscillators indicate an overstretched market. In the overbought region, the stochastic posted a bearish crossover within its %K and %D lines, while the RSI is pointing downwards beneath the 70 level.
A potential downside retracement could drive traders towards the immediate support of 1.3790, ahead of 1.3755. Below these levels, the bullish crossover within the 20- and 50-day SMAs around 1.3700 may halt steeper decreases.
On the other hand, a successful rise above 1.3845 could meet resistance at 1.3900, taken from the peak in October 2023. Further advances may push the price until 1.3975, achieved in October 2022.
Summarizing, USDCAD posted an impressive bullish move, but the momentum oscillators show that a negative correction may be the next possible scenario.

Crypto Market Takes a Chance on Recovery
Market Picture
The cryptocurrency market rallied 3.4% overnight to $2.4 trillion, taking advantage of the mixed performance of US indices, with the Russell2000 and Dow Jones up and the Nasdaq100 and S&P500 down. It’s not a full recovery, but it’s the second bounce in a week from just under $2.31 trillion.
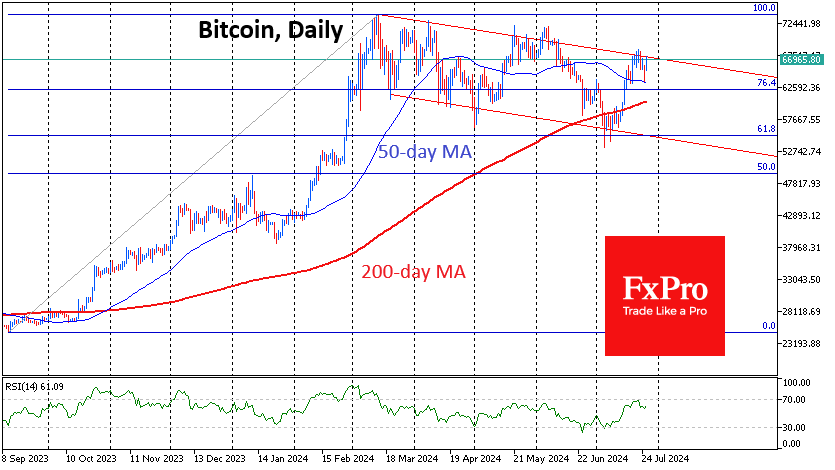
Bitcoin rose 4.4% over the last 24 hours to $67.0K, taking the crypto market with it. It bounced off the 50-day moving average and continued to gain strength on Friday. This is an indication of the strength of the bulls, who have managed to defend the medium-term uptrend. At current levels, bitcoin has returned to the upper boundary of the descending channel formed in March.
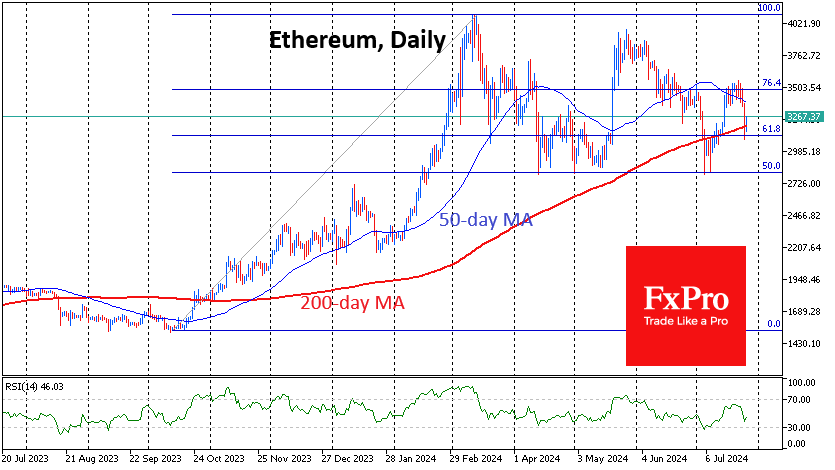
Ethereum is finding support near its 200-day moving average, which also demonstrates the bulls’ desire to keep the coin in a long-term growth trend and confidently buy on dips towards $3000. Ethereum is now trading near $3200 and has no technical hurdles ahead until the $3500 area where local profit-taking could occur.
News Background
The sell-off largely replicates the pattern seen at the launch of the Bitcoin ETF in January.
According to SoSoValue, net outflows from spot Ethereum ETFs totalled $133.2 million as of 24 July. Inflows into “new” ETH-based ETFs were not enough to offset $326.9m of client withdrawals from Grayscale’s ETHE.
The Bitstamp exchange has reported that it has received the assets of the bankrupt Mt. Gox, following a similar report from the Kraken exchange. The payouts came after a series of transactions that saw the platform’s guarantor move 48,641 BTC worth more than $3 billion.
In contrast, spot bitcoin ETFs returned to positive flows with net inflows of $44.5 million on the day. Cumulative inflows since the launch of BTC ETFs in January totalled $17.5 billion.
According to VanEck’s baseline scenario, Bitcoin could reach $2.9 million by 2050, given its acceptance as a global medium of exchange and reserve currency. In a bearish scenario, the price will only rise to $130,300.
Marathon Digital, the largest mining company in the US, bought $100 million worth of bitcoins. The decision was made considering the recent market correction and the company’s return to its strategy of holding all mined bitcoins on its balance sheet.
GBPJPY Extends Decline to a Fresh 2-month Low
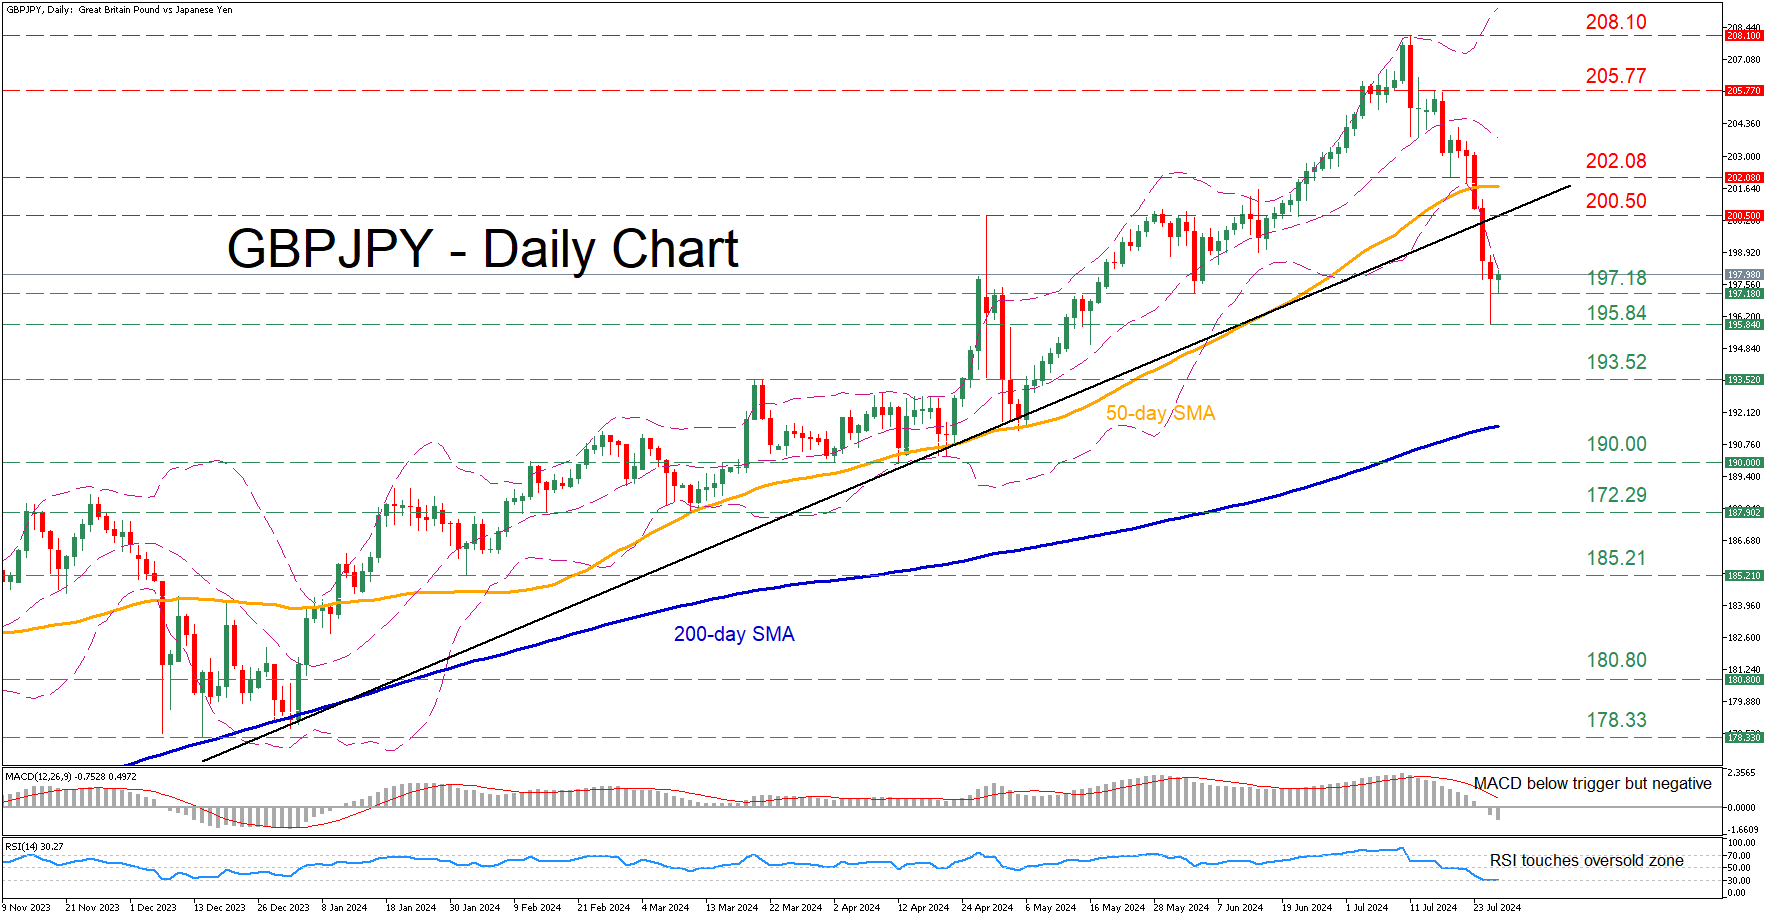
- GBPJPY pulls back from its 16-year peak of 208.10
- The pair falls to its lowest level since May 16
- RSI and MACD warn of an overstretched retreat
GBPJPY has been in a prolonged uptrend since early 2024, posting a 16-year high of 208.10 on July 11. However, the pair has been undergoing a pullback since then, with the price violating both the supportive trendline in place since January and the 50-day simple moving average (SMA).
Should the bears attempt to push the price lower, they would have to initially clear the June low of 197.18 before attention shifts to the recent two-month bottom of 195.84. Failing to halt there, the pair might challenge the March resistance of 193.52. Further declines could then cease at the 190.00 psychological mark, which provided strong support in April.
Alternatively, if the price edges back higher, the April peak of 200.50 may prove to be the first barrier for the bulls to overcome. Piercing through that wall, the price could advance towards 202.08 before it faces the July resistance of 205.77. A violation of the latter might set the stage for the 16-year high of 208.10.
In brief, GBPJPY has been experiencing a downside correction from its recent multi-year high, with the break below the crucial ascending trendline further darkening the technical picture. However, the bears should be cautious as the short-term oscillators are flagging overbought conditions.
Performance of Dollar Again Unconvincing, Mixed at Best
Markets
The IT-driven risk-off initially supported a classic safe haven run on core bonds yesterday. German yields at some point lost another 5-7 bps. However, equities gradually found a bottom going in the opening of US markets, looking forward the US data. US Q2 GDP growth printed higher than expected at 2.8% Q/Qa (1.4% in Q1 and 2.0% expected) with still a solid contribution from private consumption (+2.3% Q/Qa). Price indicators were mixed (GDP price index lower than expected at 2.3%, but core PCE deflator higher than expected at 2.9%). Jobless claims declined slightly more than expected (235k) and core durable goods orders also beat expectations. These data at least don’t suggest the Fed should rush into a big (communication) U-turn at next week’s policy meeting. On Wednesday, markets still largely ignored a solid US PMI report, but yesterday’s data finally triggered a tentative bottoming out process on the recent sharp decline in yields, especially at the short end of the curve. The US 2-y yield finished the day little changed at 4.43%. Longer yields also closed off the intraday lows but still declined up to 5.8 bps (30-y). Similar narrative on European yields with German yields at the end of the day declining between 2.1 bps (2-y) and 3.2 bps (30-y). Both the S&P (-0.51%) and the Nasdaq (-0.93%) still closed in negative territory, but selling pressure also tentatively eased intraday. The performance of the dollar again was unconvincing, mixed at best. DXY closed little changed (104.35). USD/JPY intraday tested the 152 area, but closed the session little changed near 154. EUR/USD, despite recent poor data (including the IFO confidence yesterday) even gained marginally (close 1.0846). EUR/GBP even staged a remarkable rebound off the 0.84 support area (close 0.844).
Asian equity markets this morning show signs of stabilization but gains, if any remain limited. US yields are holding near yesterday’s closing levels. The dollar is losing a few ticks again (DXY 104.27, USD/JPY 153.77, EUR/USD 1.0855). Later today, the focus will be on the US July spending and income data and on the related price deflators. Headline PCE inflation is expected to cool to 0.1% M/M and 2.4 Y/Y, the core measure is seen at 0.2% M/M and 2.5% Y/Y (from 2.6%). We don’t expect this report to bring big additional news going into next week Fed meeting. If the equity sell-off halts (at least temporarily), core yields also might look for a bottom after recent sharp repositioning. We look out whether the US 2-y yield will manage to close above the 4.40% reference. For the EMU 2-y swap the 3.0% barrier is an interesting reference. Recently the dollar performance against the other majors (euro, yen) was unconvincing and we don’t see that changing short-term.
News & Views
Inflation in Japan’s capital city Tokyo using the Bank of Japan’s preferred gauge (ex. fresh food) accelerated from 2.1% y/y to 2.2% in July. The uptick was supported by monthly increases in utilities (+2.8%), transport & communication (+0.5%) and entertainment (+1.3%). Fresh food tumbled 2.7% m/m, helping to explain the drop in overall Tokyo CPI from 2.3% to 2.2%. The core gauge excluding fresh food and energy prices slipped from 1.8% to 1.5%. In addition with services price inflation slowing to just 0.5% (unchanged on a monthly basis) from 0.9% the month before, today’s numbers once again provide no clear signal for the Bank of Japan when it meets next week. The weak yen has been a headache for policymakers in the country and argued for rate action but the currency over the past couple of days dramatically appreciated against the likes of USD and EUR. This is likely to relief the BoJ of some pressure too. USD/JPY’s sharp decline did shift in lower gear following yesterday’s stronger-than-expected US Q2 GDP data though. The pair is currently trading slightly lower around 153.58. This compared to the 161+ levels at the beginning of the month.
Hungarian minister for economy Nagy said the recovery this year and the next will be weaker than hoped for, raising the possibility of additional stimulus in the 2025 pre-election year. The 2024 rebound is seen at 2.2-2.3% instead of the 2.5% estimate in April. Economic growth next year could then “approach” rather than “exceed” 4% provided that export markets recover and the government uses the 2025 budget to boost the economy, Nagy said, hinting at help for small businesses and families. The cabinet will submit its 2025 budget draft in November. Nagy’s comments feel weirdly timed, coming at a time when Hungary is trying to keep its deficits under control. The administration recently announced a fiscal stabilization plan to keep the 2024 deficit under the 4.5% of GDP target.
Graphs
GE 10y yield
The ECB cut its key policy rates by 25 bps at the June policy meeting. A more bumpy inflation path in H2 2024, the EMU economy gradually regaining traction and the Fed’s higher for longer US strategy make follow-up moves difficult. Markets are coming to terms with that. Meanwhile, much of the save haven bids were reversed after the (first round in) the French elections. The 2.34%-2.4% support zone looks solid.
US 10y yield
The Fed indicated that it needs more evidence to lower its policy rate. June dots suggested one move in 2024 and four next year. Disappointing ISM and back-to-back downward CPI surprises put the US money market back on (at least) two rate cuts this year (September/December). The US 10-yr yield tests the recent lows and the downside of the downward trend channel in the 4.2% area.
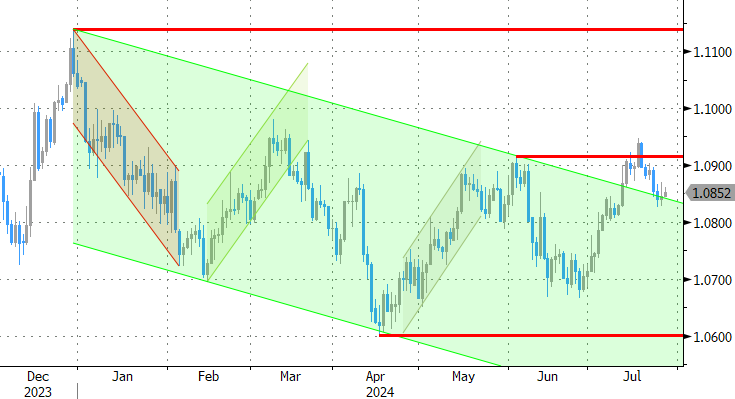
EUR/USD
EUR/USD tested the topside of the 1.06-1.09 range as the dollar lost interest rate support at stealth pace. Markets consider a September rate cut a done deal and only need confirmation from high-ranked Fed officials. In the meantime, the euro got rid of the (French) political risk premium. EUR/USD recently evolved back to a more neutral positioning but is holding up rather well despite ongoing poor EMU data.
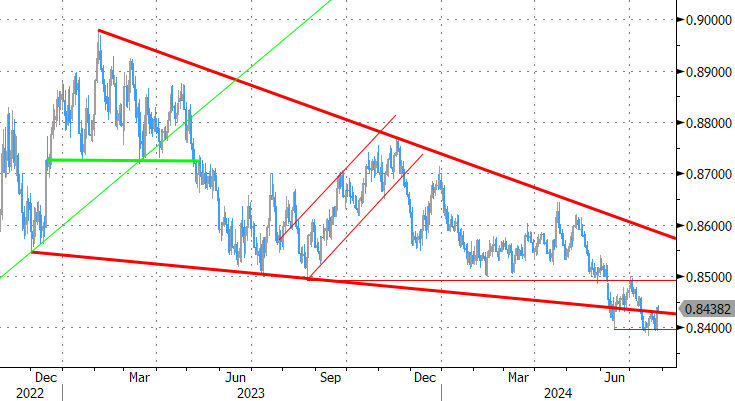
EUR/GBP
Debate at the BOE is focused at the timing of rate cuts. May headline inflation returned to 2%, but core measures weren’t in line with inflation sustainably returning to target any time soon. Still some BoE members at the June meeting appeared moving closer to a rate cut. Labour has yet to reveal its policy plans after securing a landslide election victory. EUR/GBP 0.84 support is being tested.
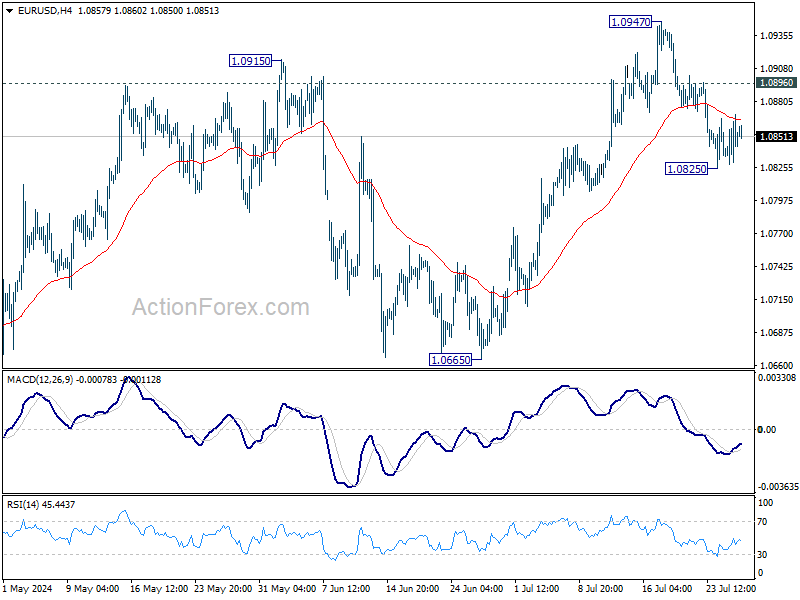
EUR/USD Daily Outlook
Daily Pivots: (S1) 1.0825; (P) 1.0848; (R1) 1.0867; More.....
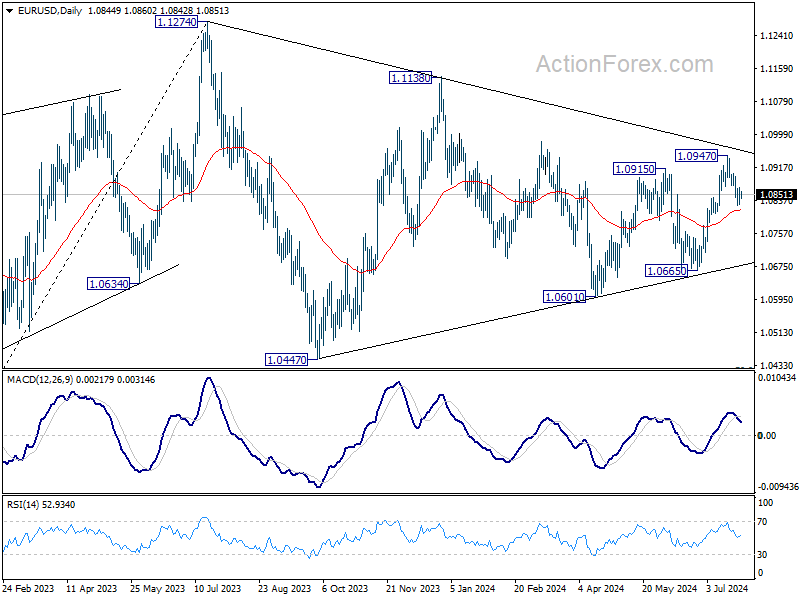
Intraday bias in EUR/USD is turned neutral with current recovery. Deeper fall is in favor as long as 1.0896 minor resistance holds. Below 1.0825 will target 55 D EMA (now at 1.0813). Sustained break there will argue that whole rebound from 1.0601 has completed with three waves up to 1.0947, and target 1.0601/0665 support zone. Nevertheless, break of 1.0896 will bring retest of 1.0947 resistance instead.
In the bigger picture, price actions from 1.1274 are viewed as a corrective pattern that's still be in progress. Break of 1.1138 resistance will be the first signal that rise from 0.9534 (2022 low) is ready to resume through 1.1274 (2023 high). However, break of 1.0665 support will extend the correction with another falling leg back towards 1.0447 support.
GBP/USD Daily Outlook
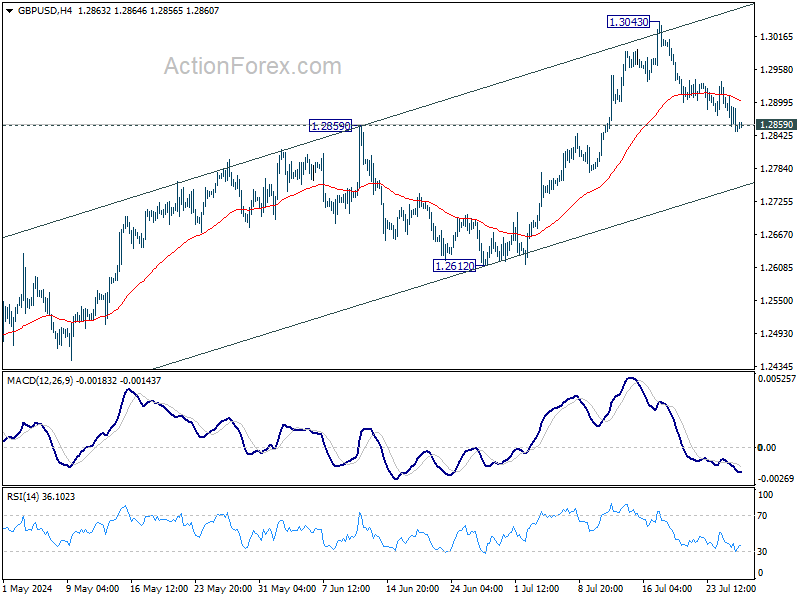
Daily Pivots: (S1) 1.2822; (P) 1.2876; (R1) 1.2903; More...
Outlook in GBP/USD is unchanged and intraday bias remains neutral. Further rally is expected with 1.2859 resistance turned support intact. Break of 1.3043 will resume the rise from 1.2298. However, firm break of 1.2859 will turn bias to the downside for deeper decline to 55 D EMA (now at 1.2771).
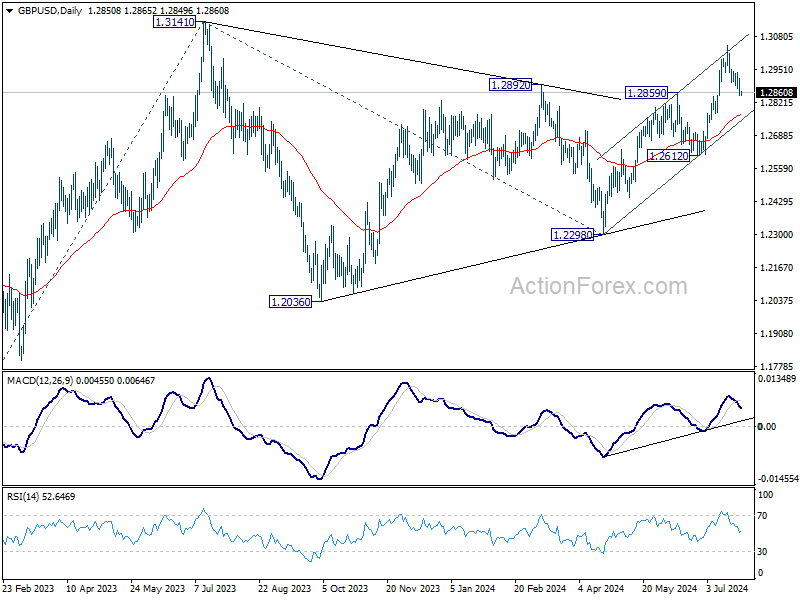
In the bigger picture, corrective pattern from 1.3141 medium term top (2023 high) could have completed with three waves to 1.2298 already. This will now remain the favored case as long as 1.2612 support holds. Firm break of 1.3141 will target 61.8% projection of 1.0351 (2022 low) to 1.3141 from 1.2298 at 1.4022.
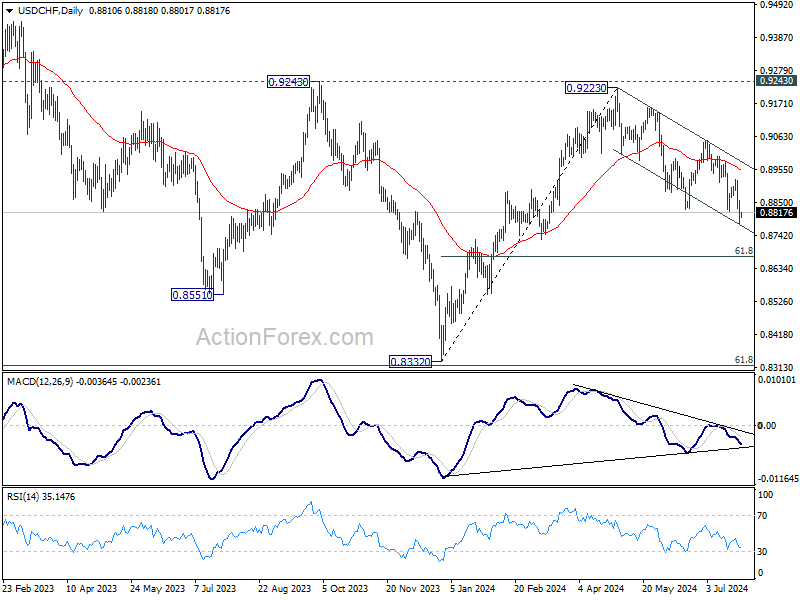
USD/CHF Daily Outlook
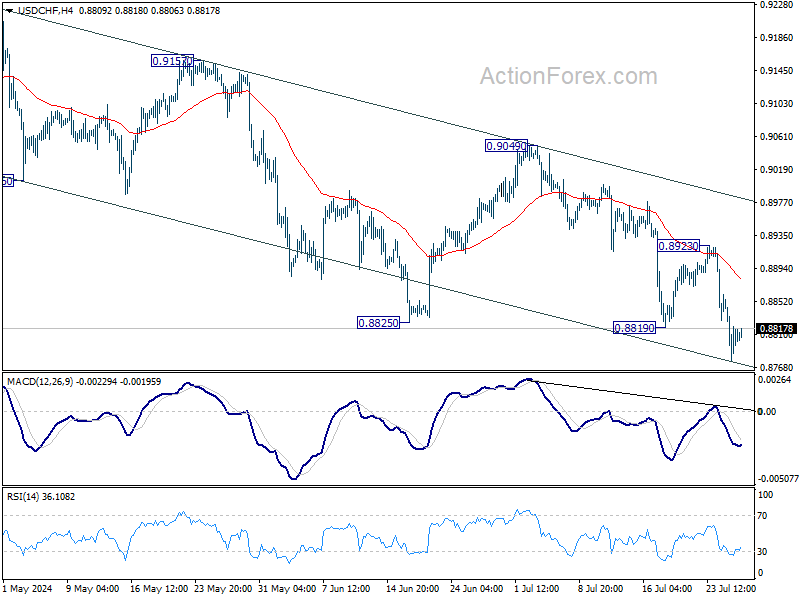
Daily Pivots: (S1) 0.8776; (P) 0.8818; (R1) 0.8858; More…
No change in USD/CHF's outlook and intraday bias stays on the downside. Fall from 0.9223 is in progress for 61.8% retracement of 0.8332 to 0.9223 at 0.8672. For now, risk will stay on the downside as long as 0.8923 resistance holds, in case of recovery.
In the bigger picture, with 0.9243 resistance intact, medium term outlook in USD/CHF is neutral at best. For now, more sideway trading is likely between 0.8332/9243. However, firm break of 0.9243 will indicate larger bullish trend reversal.