Sample Category Title
USD/JPY – Yen on a Tear, US GDP Blows Past Forecast
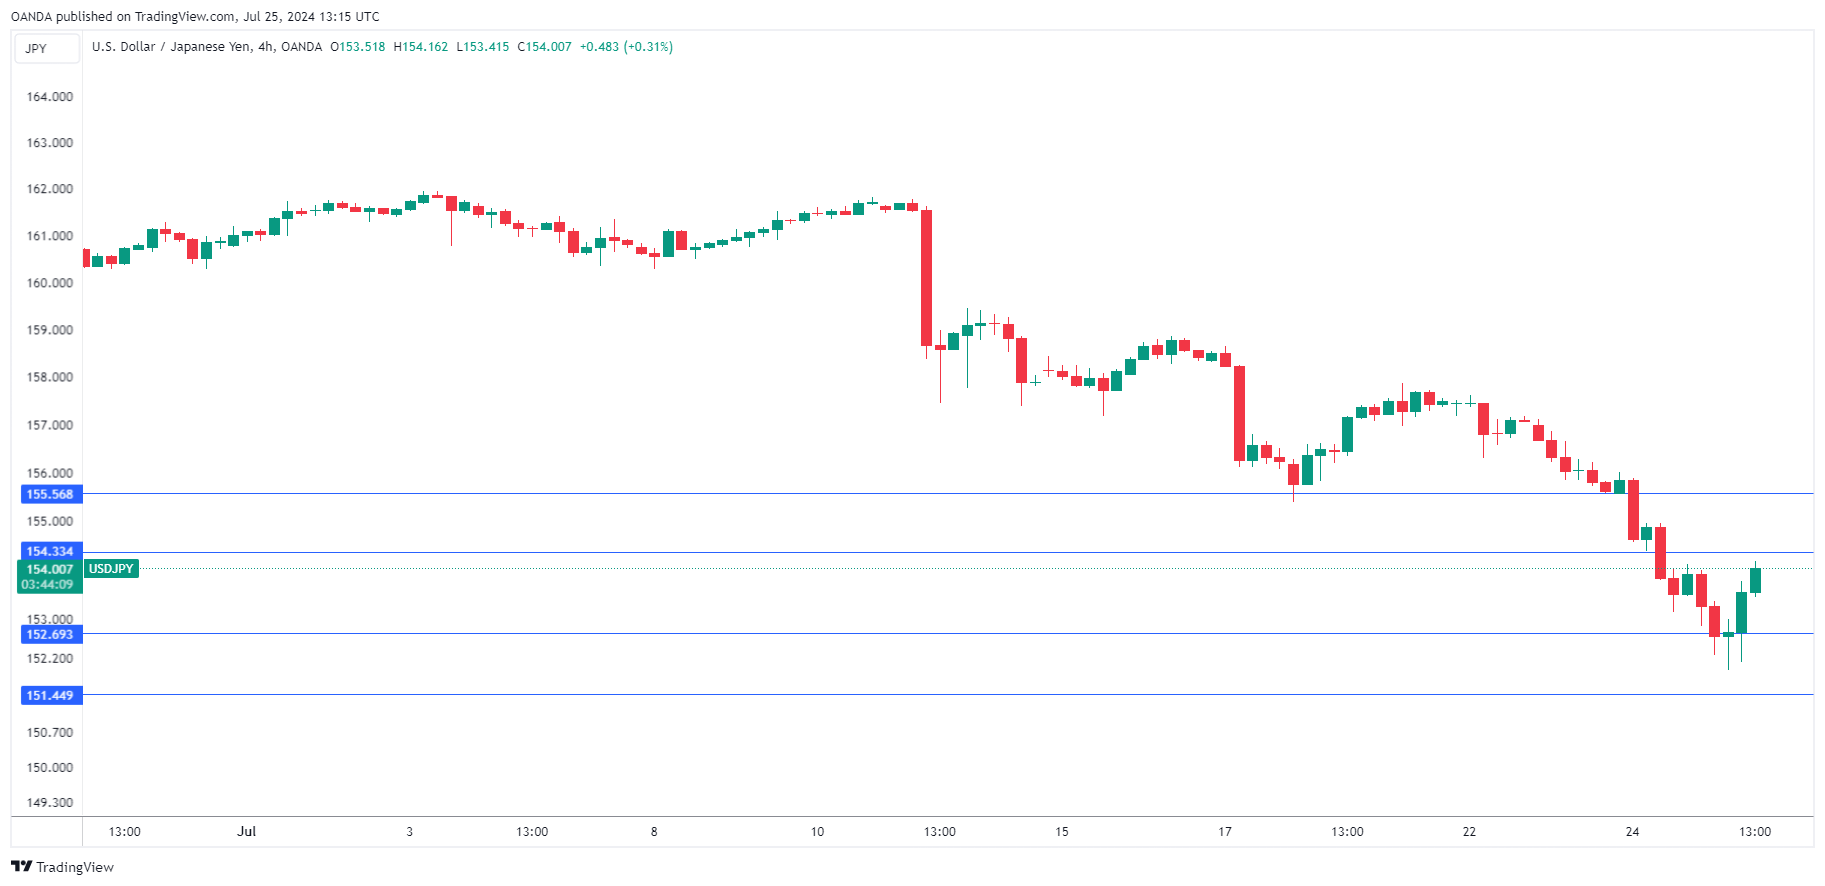
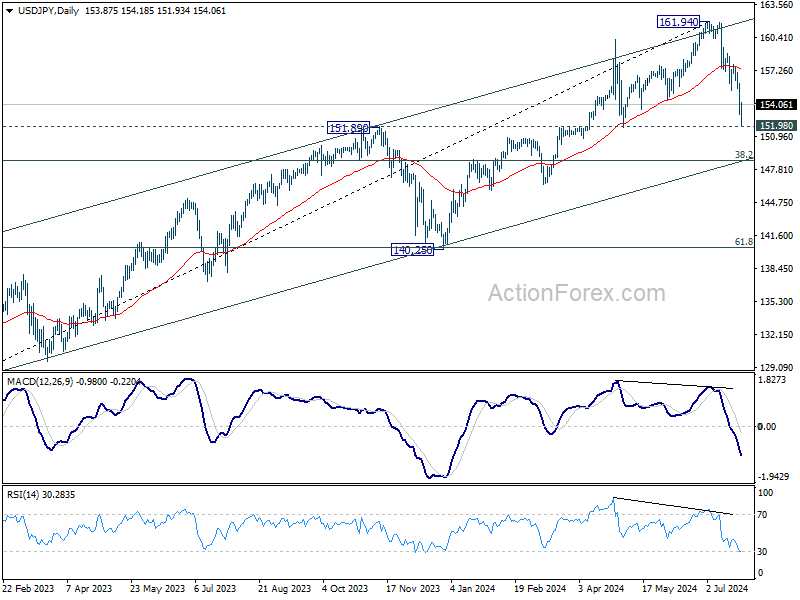
The Japanese yen continues to gain ground against the US dollar. USD/JPY is trading at 153.68 early in the North American session, down 0.14% on the day. Earlier today, USD/JPY fell as low as 151.93 (1.3%), its lowest level since May 3, before paring most of these losses. The yen has soared, rising 2.4% this week and a staggering 4.5% in the month of July.
Buzz around BoJ meeting
There’s plenty of buzz but also uncertainty in the air as the yen has gone on a torrid run against the hapless US dollar. The yen jumped 1.1% on Wednesday after a senior Japanese official urged the Bank of Japan to normalize policy. As well, the sharp drop in global tech stocks sent investors fleeing to traditional safe havens, including the Japanese yen.
The Bank of Japan meets on July 30-31 and it’s a close call as to whether it will stay on the sidelines or raise interest rates. The central bank is also expected to announce details of a plan to cut bond purchases in order to reduce its massive monetary stimulus.
The BoJ has hinted that a rate hike is coming, but the question of timing is up in the air. Core inflation rose to 2.6% in June and wages have climbed sharply, setting up the case for the central bank to raise rates. On the other side of the coin, consumer spending has been weak and inflation is relatively moderate.
US GDP climbs to 2.8%
The US economy climbed 2.8% y/y in the second quarter, double the 1.4% rate in the first quarter and blowing past the forecast of 2.0%. An increase in consumer spending helped drive the strong gain. On the inflation front, the personal consumption expenditures price index, a key measure for the Federal Reserve, eased to 2.6%, down from 3.4% in Q1.
.
USD/JPY Technical
- USD/JPY tested support at 152.68 earlier. Below, there is support at 151.45
- There is resistance at 154.33 and 155.56
Sunset Market Commentary
Markets
Risk off quickly spread from the US yesterday to Asian and later European dealings today. Triggered by AI/tech companies on Wall Street yesterday, the equity sell-off broadened in the likes of the EuroStoxx50 amid weaker guidance from consumer staples (including Nestlé). Losses at some point amounted to 1.7% and are as much as 2.5% in Italy. The slide in US stock markets eased a bit, with indices opening between -0.3% and +0.1%. US yields built on their recent correction by shedding between 7-9 bps going into the release of a series of important economic data. After a (long) string of disappointments, markets long for some upbeat news. Yesterday’s PMI’s were not at all bad (especially services) but didn’t quite get the job done. US Q2 GDP growth today came in at 2.8% q/q annualized, double the pace in Q1 and easily topping the 2% estimate. Personal consumption (2.3%) contributed more than half (1.57 ppts) with gross private investment (8.4%) securing the second place (1.46 ppts – 0.82 ppts of which driven by rising inventories). Government consumption (3.1%) added 0.53 ppts while net exports served as a drag (-0.72 ppts) amid rising imports (6.9%) outpacing exports (2.0%). The PCE price deflator missed the bar on a headline level (2.3% in Q2 vs 2.6% expected, down from 3.1%) but was higher-than-anticipated in the underlying gauge (from 3.7% to 2.9% vs 2.7%). Weekly jobless claims came in slightly less than feared (235k) and (core) durable goods orders – barring the major headline miss on non-defense aircraft orders – mostly came in to the stronger side of expectations. Yields welcomed the news by paring losses a bit to 2.5-5 bps across the US curve. The 2-yr yield tested 4.33% support before revisiting 4.40% again. Money markets barely changed their Fed rate cut expectations for the year though. Assuming no decision is made in November, investors are still pondering the chances for a sizeable 50 bps cut somewhere this year. The US data help European yields to find an intraday bottom as well with German yields almost fully erasing 5-7 bps of losses. In European swap yields, the 2-yr yield’s break below 3% is less compelling than it was before the numbers rolled in. UST underperformance and increased speculation/anticipation on the Fed easing cycle keeps the dollar at bay even at times of risk aversion such as today. EUR/USD loses some ground to 1.0835. USD/JPY made a sharp U-turn following the data batch, rebounding from as low as 151.94 to 153.92.
News & Views
Business sentiment and activity among British manufacturers as captured in the Quarterly Industrial Trends survey of the Confederation of British Industry (CBI) showed some mixed signals, but CBI assessed the outlook as fairly constructive. Optimism among manufacturers fell slightly in July, after rising in April for the first time in nearly three years (balance -9 from +9 in April). Output volumes were broadly unchanged in the quarter to July (-3 from +3), following a similar result in the three months to June and underperformed expectations for modest growth. However, manufacturers continue to expect output to increase over the next three months (+25%), with growth expectations the strongest since March 2022. Average cost growth accelerated compared with April and remained elevated compared to historical norms (+52% from 39%, historical average +18%). Cost growth is expected to slow in the quarter to October, while remaining historically strong. Domestic and export price inflation also accelerated but are both expected to slow in the next three months. Meanwhile, manufacturers expect to raise their headcount in the next three months (and at the fastest pace for a year), and investment intentions for the year ahead have generally improved. As was the case with other UK data evidence, the CBI survey today provide no clear message whether the BOE should/can already cut rates at next week’s MPC meeting.
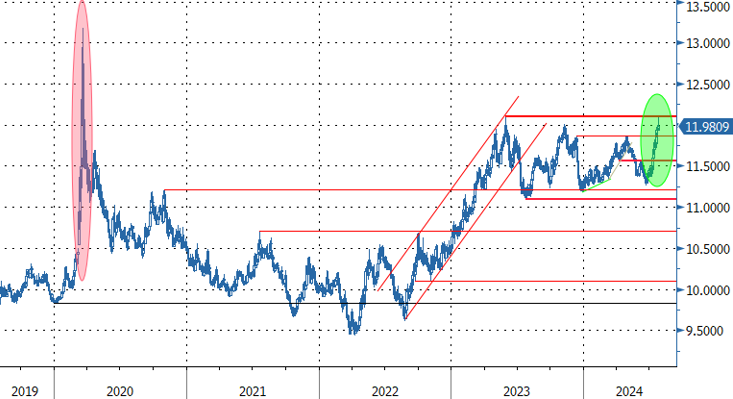
Confidence in the Norwegian industrial sector as measured by the business tendency survey for manufacturing, mining and quarrying improved to 3.9 in the second quarter from 0.6 thee in April. Business assessment improved for all measured variables (total production volume, average employment, new orders received from home markets and new orders received from export markets) both for the current assessment and for expected changes compared to the next quarter. Still better industrial prospects didn’t help the Norwegian currency. The negative global sentiment vs smaller, commodity related currencies today culminated in a test of the EUR/NOK 2023 high by EUR/NOK. NOK losses were paired afterwards to 11.98 currently.
Graphs
US 2-yr rebounds from 4.33% support to trade back north of 4.40% amid strong Q2 growth
USD/JPY stages sharp intraday U-turn as solid-to-strong eco data eases some downturn concerns
EUR/NOK: krone tested 2023 highs as risk aversion continues to dominate on markets
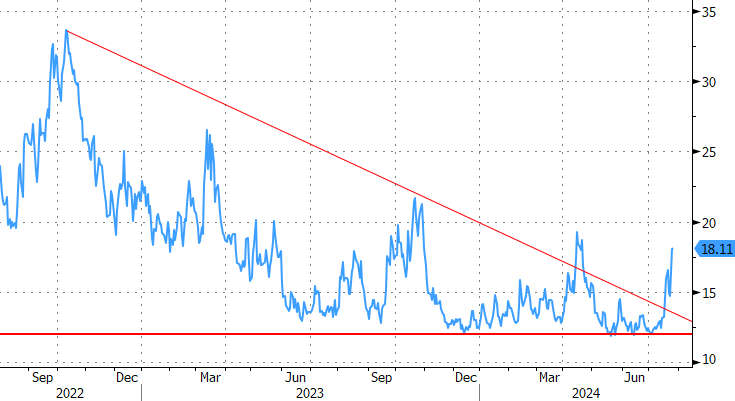
VIX index jumped from recent historical lows. Sell-off wave rolls over equity markets
EUR/USD Mid-Day Outlook
Daily Pivots: (S1) 1.0821; (P) 1.0844; (R1) 1.0861; More.....
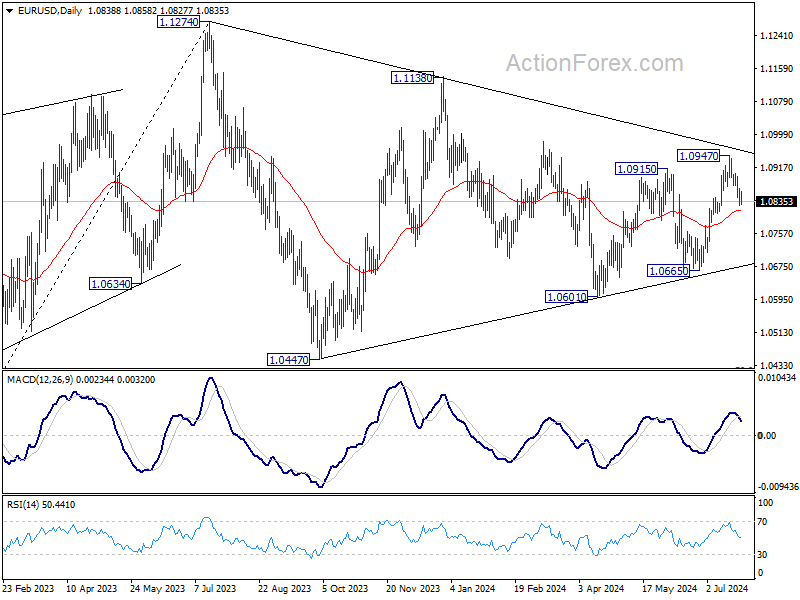
Intraday bias in EUR/USD stays on the downside, and fall from 1.0947 short term top should extend to 55 D EMA (now at 1.0813). Sustained break there will argue that whole rebound from 1.0601 has completed with three waves up to 1.0947, and target 1.0601/0665 support zone. On the upside, above 1.0896 minor resistance will turn intraday bias neutral first. But, risk will stay on the downside as long as 1.0947 resistance holds, in case of recovery.
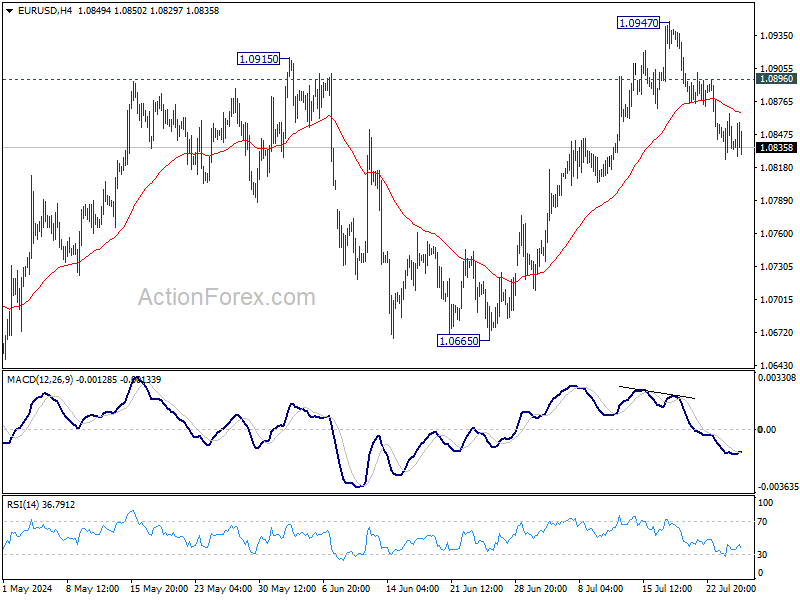
In the bigger picture, price actions from 1.1274 are viewed as a corrective pattern that's still be in progress. Break of 1.1138 resistance will be the first signal that rise from 0.9534 (2022 low) is ready to resume through 1.1274 (2023 high). However, break of 1.0665 support will extend the correction with another falling leg back towards 1.0447 support.
GBP/USD Mid-Day Outlook
Daily Pivots: (S1) 1.2877; (P) 1.2907; (R1) 1.2938; More...
Intraday bias in GBP/USD remains neutral first. Further rally is expected with 1.2859 resistance turned support intact. Break of 1.3043 will resume the rise from 1.2298. However, firm break of 1.2859 will turn bias to the downside for deeper decline to 55 D EMA (now at 1.2771).
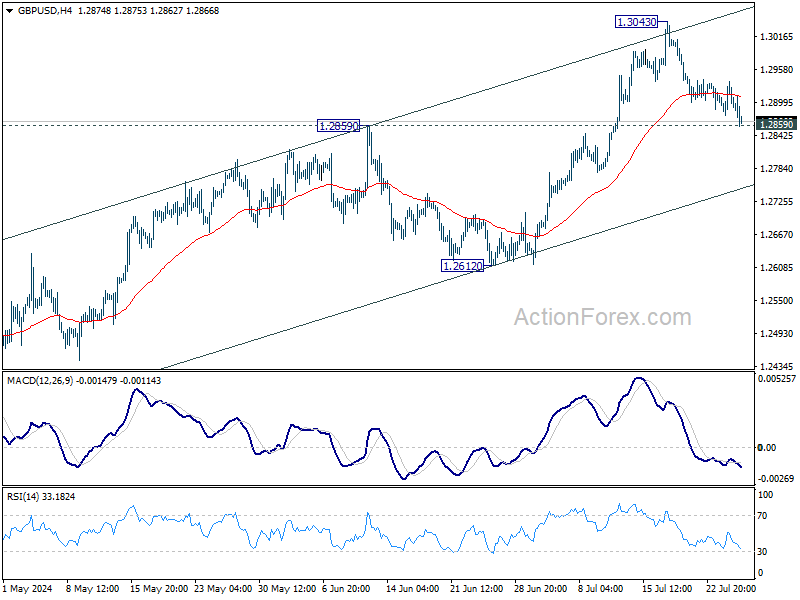
In the bigger picture, corrective pattern from 1.3141 medium term top (2023 high) could have completed with three waves to 1.2298 already. This will now remain the favored case as long as 1.2612 support holds. Firm break of 1.3141 will target 61.8% projection of 1.0351 (2022 low) to 1.3141 from 1.2298 at 1.4022.
USD/CHF Mid-Day Outlook
Daily Pivots: (S1) 0.8813; (P) 0.8868; (R1) 0.8907; More…
Intraday bias in USD/CHF remains on the downside for the moment. Fall from 0.9223 is in progress for 61.8% retracement of 0.8332 to 0.9223 at 0.8672. For now, risk will stay on the downside as long as 0.8923 resistance holds, in case of recovery.
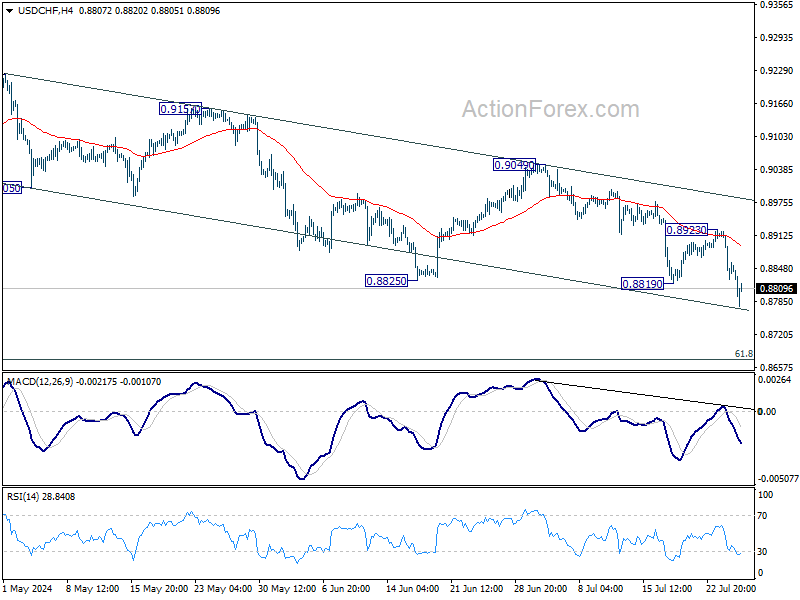
In the bigger picture, with 0.9243 resistance intact, medium term outlook in USD/CHF is neutral at best. For now, more sideway trading is likely between 0.8332/9243. However, firm break of 0.9243 will indicate larger bullish trend reversal.
U.S. Economic Resilience on Display in the Second Quarter
The U.S. economy surprised to the upside in the second quarter of 2024, expanding by 2.8% quarter-on-quarter (q/q, annualized) against expectations for around 2%.
Looking under the hood, consumer spending was slightly stronger than we had forecast, advancing by 2.3% q/q. That was driven by a rebound in durable goods spending (+4.7%), while spending on services downshifted to a modest 2.2%, from 3.3% in the first quarter.
Business investment rose a sturdy 5.2% on a surge in equipment spending (+11.6%). Meanwhile, spending on structures gave back a small part of its recent strength (-3.3%) and spending on intellectual property products continued running at a healthy clip (4.5%).
Two other areas of upside surprise were government outlays and residential investment. Government spending rose 3.1%, driven by a 5.2% increase in national defense outlays. Residential investment still declined by 1.4% on the quarter, but that was a smaller drop than we had pencilled in.
Inventory building added significantly to growth in the second quarter, contributing 0.8 percentage points (p.p.) on a quarterly basis. However, that was nearly entirely offset by the drag from net exports (-0.7 p.p.). Imports were up strongly on the quarter, subtracting 0.9 p.p. from headline growth.
Final domestic demand was up a healthy 2.7%, building on the 2.4% gain in the first quarter.
Key Implications
We had expected the U.S. economy to gear down a bit more in the second quarter, but its resilience was on display once again. However, the details of the report are consistent with further slowing ahead, as outlined in our June forecast. The uptick in consumer outlays was driven by a rebound in durables spending, which we don't expect to be sustained, while the larger services spending category is slowing in the background. We will get the June personal spending data tomorrow, which will clarify how momentum was looking as we headed into the third quarter.
Also, the upside surprise on government spending coming from national defense may be a one-off, and could likely downshift in the coming quarter. All that to say we appear to be in a goldilocks scenario for the U.S. economy – growth is moderating gradually while inflation is getting closer to the Fed's target. This should enable the Fed to start cutting interest rates later this year.
USD/JPY Mid-Day Outlook
Daily Pivots: (S1) 152.68; (P) 154.33; (R1) 155.56; More...
Intraday bias in USD/JPY is turned neutral first with current recovery, and some consolidations would be seen above 151.93 temporary low. But risk will remain on the downside as long as 155.36 support turned resistance holds. Decisive break of 151.89 resistance turned support will argue that large scale correction is underway to 148.66 fibonacci level. Nevertheless, break of 155.36 will turn bias back to the upside for stronger rebound.
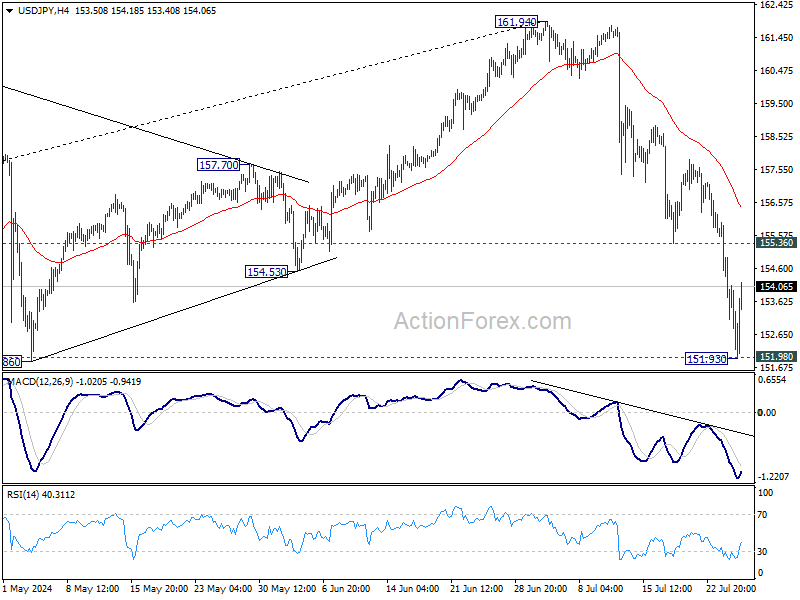
In the bigger picture, considering the depth and momentum of the current decline, 161.94 should be a medium term top already. Fall from there is seen as correcting the whole rise from 127.20 (2023 low) at least. Break of 151.89 will pave the way to 38.2% retracement of 127.20 to 161.94 at 148.66. Risk will now stay on the downside as long as 55 D EMA (now at 157.25) holds, in case of rebound.
Dollar Edges Up After Strong Q2 GDP, Yen Finally Retreats
Dollar rises modestly in early US trading following stronger-than-expected Q2 GDP data. The robust performance overshadowed the mixed durable goods orders data, instilling some optimism in the market. Despite this, overall market reactions remain subdued. US futures point to a flat open, suggesting a degree of stabilization following yesterday's sharp selloff. Additionally, 10-year yield has recovered slightly from its earlier dip.
Meanwhile, the Japanese Yen, which had seen significant gains recently, is retreating slightly. The buying climax for the Yen might have passed, but it's too early to determine if risk sentiment has improved. Traders could be switching their positions to the Yen's safe-haven counterpart, the Swiss Franc, which is currently the strongest currency for the day.
In the broader currency markets, Swiss Franc is leading as the strongest performer, followed by Yen and Euro. Australian Dollar is at the bottom of the chart, followed by New Zealand Dollar. British Pound is currently the third weakest of the day. Dollar and Canadian Dollar are mixed in the middle.
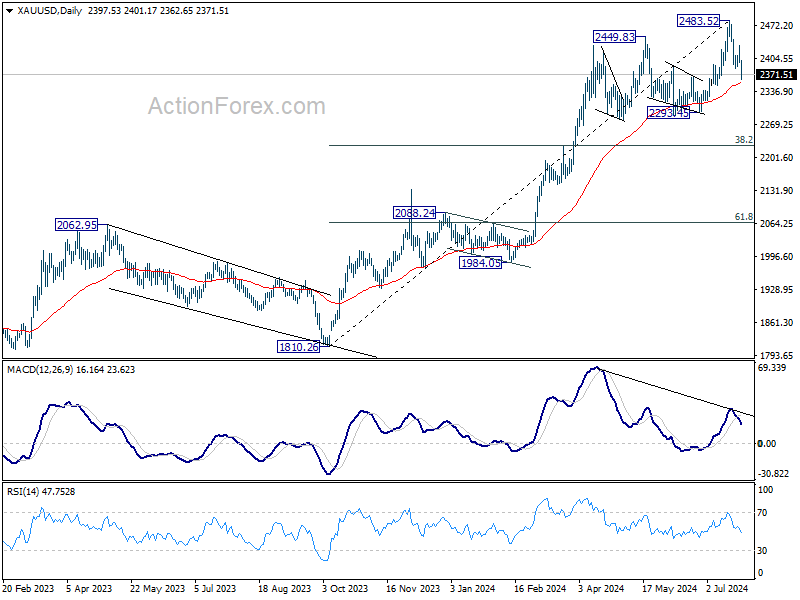
Technically, Gold's pullback from 2483.52 record high resumed today. Immediate focus is on 55 D EMA (now at 2354.60) Strong support from there would keep near term outlook bullish for another rise through 2483.52 before topping. However, considering bearish divergence condition in D MACD, sustained break of 55 D EMA will argue that a medium term top was already in place. Fall from 2483.52 would then be correcting whole five wave rally from 1810.26. Next target is 38.2% retracement of 1810.26 to 2483.52 at 2226.33.
In Europe, at the time of writing, FTSE is down -0.29%. DAX is down -0.99%. CAC is down -1.81%. UK 10-year yield is down -0.0111 at 4.149. Germany 10-year yield is down -0.013 at 2.433. Earlier in Asia, Nikkei fell -3.28%. Hong Kong HSI fell -1.77%. China Shanghai SSE fell -0.52%. Singapore Strait Times fell -0.88%. Japan 10-year JGB yield fell -0.0029 to 1.075.
US Q2 GDP grows 2.8% annualized, inflation pressures ease
The advance estimate of US GDP growth in Q2 2024 showed a robust 2.8% annualized increase, significantly exceeding the anticipated 2.0% and doubling Q1's pace of 1.4%.
This stronger-than-expected growth was driven by rises in consumer spending, private inventory investment, and nonresidential fixed investment. Notably, imports also increased, which are subtracted in the GDP calculation.
On the inflation front, GDP price index slowed from 3.1% to 2.3%, falling below the expected 2.6%. PCE price index also eased from 3.4% to 2.6%, and core PCE price index saw a notable decrease from 3.7% to 2.9%.
The sharp uptick in GDP growth, coupled with cooling inflation metrics, presents an optimistic economic outlook. Deceleration in price indexes suggests easing inflationary pressures, which would support rate cut by Fed in the coming months.
US durable goods orders falls -6.6% mom, but ex-transport orders up 0.4% mom
US durable goods orders fell sharply by -6.6% mom to USD 264.5 in June, much worse than expectation of 0.4% mom rise. However, ex-transportation orders rose 0.5% mom to USD 188.7B, above expectation of 0.2% mom. Ex-defense orders fell -7.0% mom to USD 247.6B. Transportation equipment drove the headline contraction and fell -20.5% mom to USD 75.8B.
US initial jobless claims falls to 235k vs exp 238k
US initial jobless claims fell -10k to 235k in the week ending July 20, slightly below expectation of 238k. Four-week moving average of initial claims was relatively unchanged at 236k.
Continuing claims fell -9k to 1851k in the week ending July 13. Four-week moving average of continuing claims rose 5k to 1854k, highest since December 4, 2021.
German Ifo falls to 87, economy stuck in crisis
Germany's Ifo Business Climate Index fell from 88.6 to 87.0 in July, missing expectations of 89.0. Current Assessment Index also dropped from 88.3 to 87.1, below the anticipated 88.5. Additionally, Expectations Index declined from 88.8 to 86.9, underperforming the forecast of 89.0.
Sector-wise, manufacturing index plunged from -9.3 to -14.1, indicating significant dissatisfaction among manufacturers. Services sector saw a decline from 4.2 to 0.7, while the trade sector fell from -23.6 to -27.8. Construction also showed a decrease, moving from -25.2 to -26.0.
Ifo noted that sentiment has "declined considerably," with companies expressing growing dissatisfaction with the current business situation. The level of skepticism regarding the coming months has increased notably. The German economy, as described by Ifo, is currently "stuck in crisis."
Japanese government notes export stagnation as global risks mount
Japan's government maintained its economic assessment but noted a more pessimistic outlook for exports due to weakening demand from China.
According to the Cabinet Office's Monthly Economic Report, the Japanese economy is recovering at a "moderate pace," though it has recently "appeared to be pausing." The assessment of exports was downgraded from "appearing to be pausing for picking up" to "almost flat," reflecting the impact of slowing Chinese demand.
In the short term, the economy is expected to continue its moderate recovery, supported by an "improving employment and income situation." However, several risks threaten this outlook. These include the slowdown in global economies, high-interest rates in the US and Europe, and the "lingering stagnation of the real estate market in China."
The report also highlighted the need to monitor price increases, geopolitical tensions in the Middle East, and fluctuations in financial and capital markets.
USD/JPY Mid-Day Outlook
Daily Pivots: (S1) 152.68; (P) 154.33; (R1) 155.56; More...
Intraday bias in USD/JPY is turned neutral first with current recovery, and some consolidations would be seen above 151.93 temporary low. But risk will remain on the downside as long as 155.36 support turned resistance holds. Decisive break of 151.89 resistance turned support will argue that large scale correction is underway to 148.66 fibonacci level. Nevertheless, break of 155.36 will turn bias back to the upside for stronger rebound.
In the bigger picture, considering the depth and momentum of the current decline, 161.94 should be a medium term top already. Fall from there is seen as correcting the whole rise from 127.20 (2023 low) at least. Break of 151.89 will pave the way to 38.2% retracement of 127.20 to 161.94 at 148.66. Risk will now stay on the downside as long as 55 D EMA (now at 157.25) holds, in case of rebound.
Economic Indicators Update
| GMT | Ccy | Events | Actual | Forecast | Previous | Revised |
|---|---|---|---|---|---|---|
| 23:50 | JPY | Corporate Service Price Index Y/Y Jun | 3.00% | 2.60% | 2.50% | 2.70% |
| 08:00 | EUR | Germany IFO Business Climate Jul | 87 | 89 | 88.6 | |
| 08:00 | EUR | Germany IFO Current Assessment Jul | 87.1 | 88.5 | 88.3 | |
| 08:00 | EUR | Germany IFO Expectations Jul | 86.9 | 89 | 89 | 88.8 |
| 08:00 | EUR | Eurozone M3 Money Supply Y/Y Jun | 2.20% | 1.90% | 1.60% | 1.50% |
| 12:30 | USD | Initial Jobless Claims (Jul 19) | 235K | 238K | 243K | |
| 12:30 | USD | GDP Annualized Q2 P | 2.80% | 2.00% | 1.40% | |
| 12:30 | USD | GDP Price Index Q2 P | 2.30% | 2.60% | 3.10% | |
| 12:30 | USD | Durable Goods Orders Jun | -6.60% | 0.40% | 0.10% | |
| 12:30 | USD | Durable Goods Orders ex Transport Jun | 0.50% | 0.20% | -0.10% | |
| 14:30 | USD | Natural Gas Storage | 13B | 10B |
Elliott Wave Analysis: USDCAD Turning Upside from Sideways
Hello traders, welcome to a new blog post. Today, we will discuss USDCAD as the pair is set to break out of a range that has lasted over two years. How soon can the breakout happen?
In May 2021, USDCAD completed a five-year-long bearish corrective cycle that started in January 2016. Since then, the long-term bullish trend from 2007 has resumed. Despite that the pair has spent most of the last two years in a range, a breakout is imminent. The pair is expected to break out of the range in the long term. Afterward, the bullish sequence should extend beyond the January 2016 top towards prices not seen since 2003.
USDCAD Elliott Wave Analysis – Weekly Chart, 07.24.2024
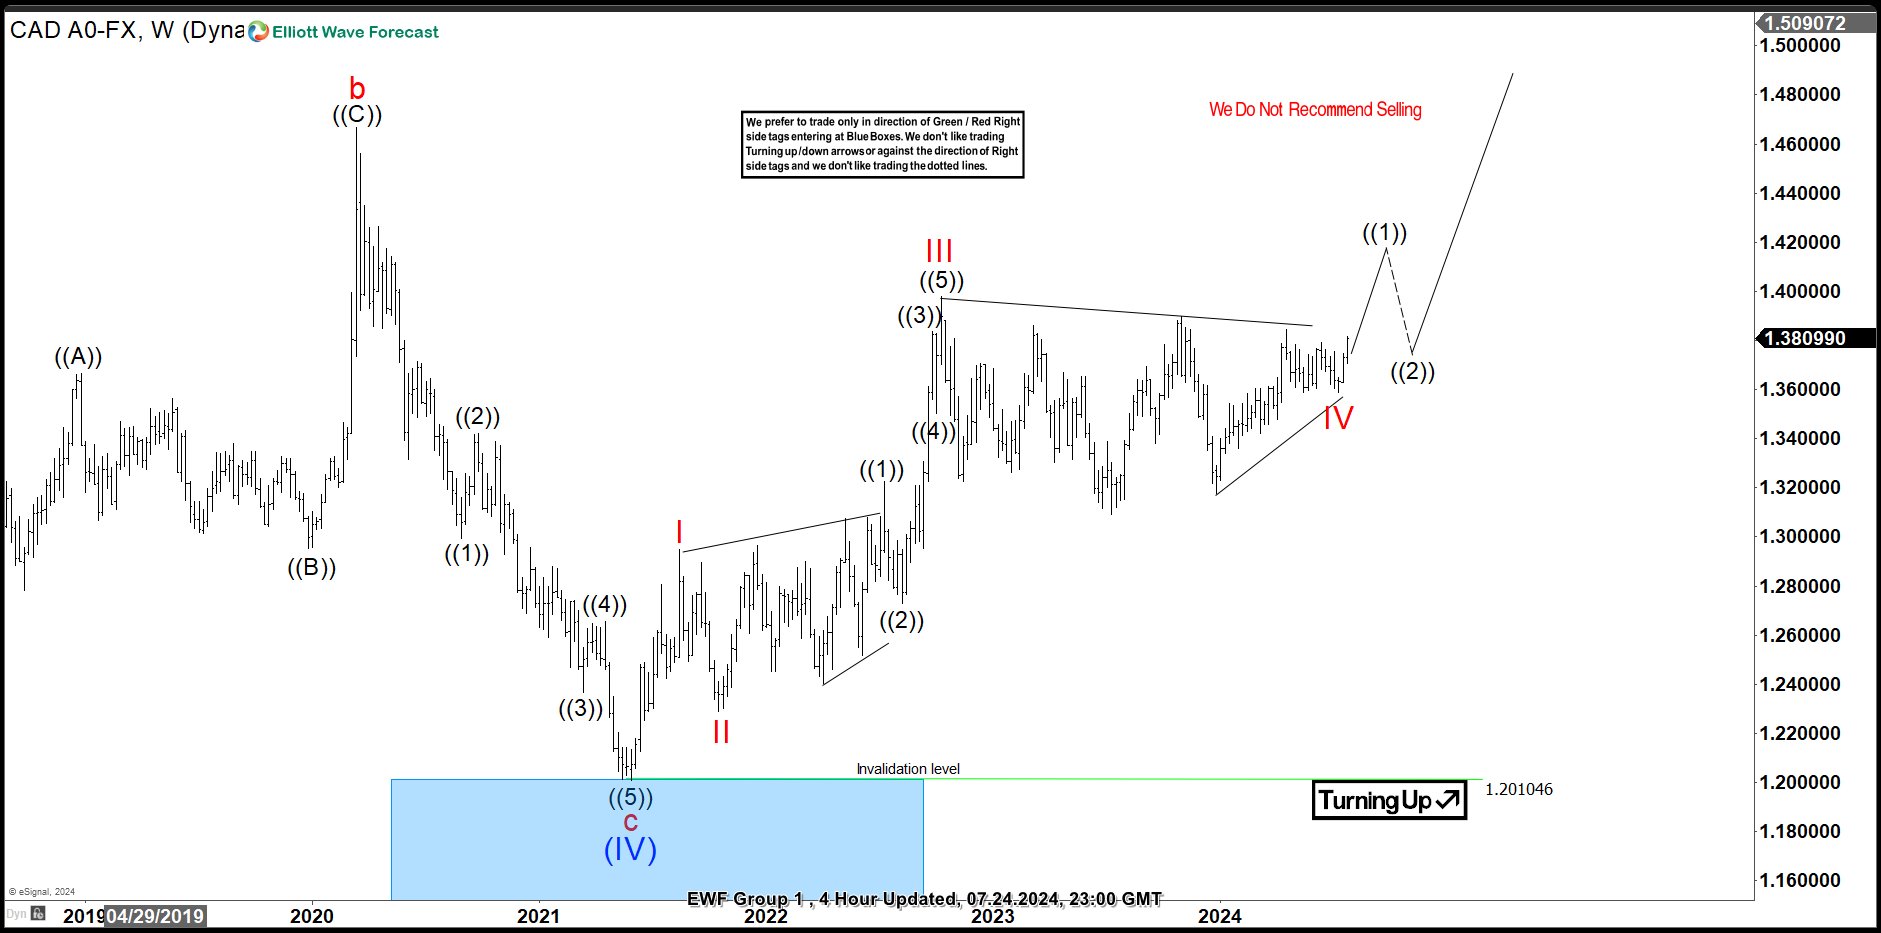
Recently, on 07.24.2024, we shared the USDCAD weekly chart with members of Elliottwave-Forecast to show the long-term path. Our Elliott wave analysis calls for the extension of wave (V) of the supercycle degree that started in May 2021, where wave (IV) ended at the equal leg. The blue box shows where long-term buyers entered into positions. They are now in a risk-free area where they can anticipate more gains. Meanwhile, the price has completed sub-waves I to IV of (V). Wave IV ended as a triangle structure that lasted over two years. Thus, we are calling for wave ((1)) of V to extend out of the range with a 5-wave structure. Along wave ((1))’s path, we will buy the pullbacks in 3, 7, or 11 swings at the extreme on the H4 or Daily chart.
USDCAD Elliott Wave Analysis – H4 Chart, 07.24.2024
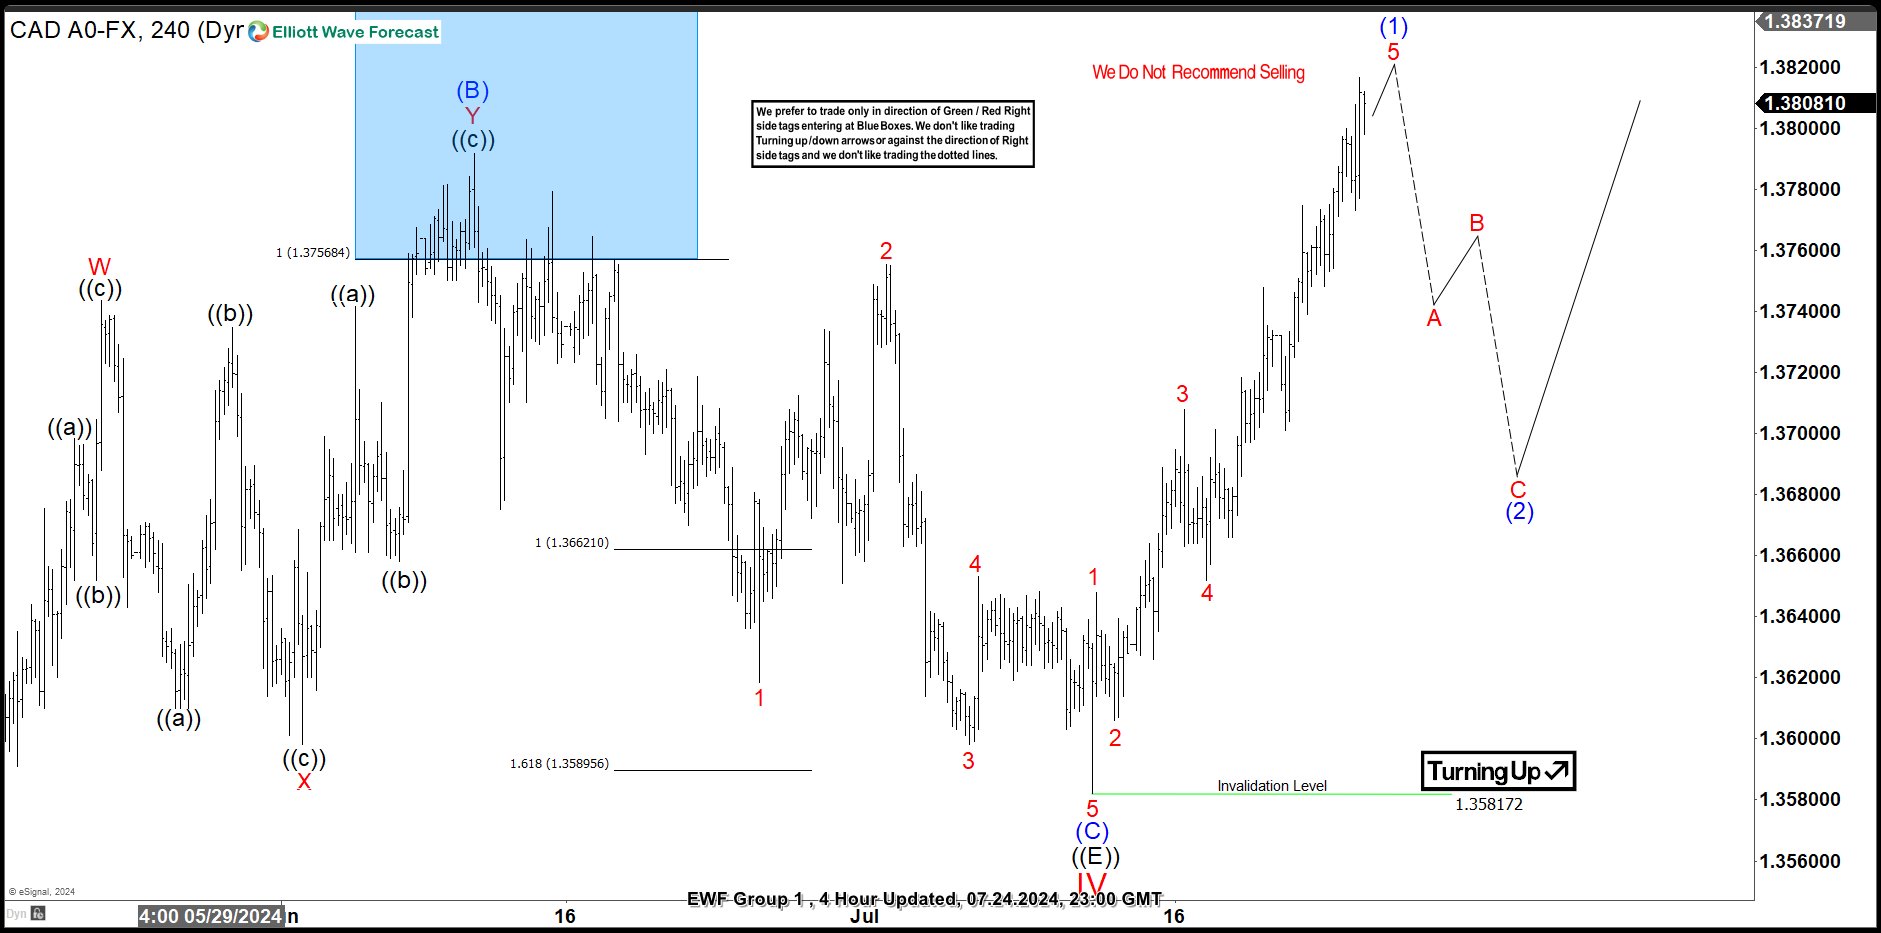
The chart above shows the shorter cycles on the H4 chart. We also shared this chart with members on 07.24.2024. The chart shows the early progress of wave V of (V). An impulse sequence appears to be emerging and close to completion from the July 2024 low. This bullish impulse sequence is expected to complete wave (1) of ((1)) of V of (V). Eventually, wave (1) will be completed, and a pullback in wave (2) will follow. Buyers will wait to buy again at the end of wave (2) if it completes a 3, 7, or 11 swing at the extreme.
GBP/USD Faces Downward Pressure Amid US Dollar Strength
GBP/USD pair is down to 1.2892 on Thursday. Selling intensified on the 18th of July. Since then, GBP has remained under pressure, although it is making attempts to stabilise.
Statistics released earlier showed that UK private sector activity improved in July. PMI data indicated that activity in the services sector expanded slightly, while in the industrial segment, it was the highest since February 2022.
The data aligned with forecasts and confirmed the positive sentiment in industrial production after Labour's convincing election victory.
The market is watching the situation with the Bank of England interest rate. The probability of a rate reduction at the August meeting is at most 40%. The UK regulator holds a neutral view of the monetary policy structure and is unlikely to make decisions that could have a mixed effect.
Overall, GBP remains under pressure from the US Dollar, which is receiving support from various sides.
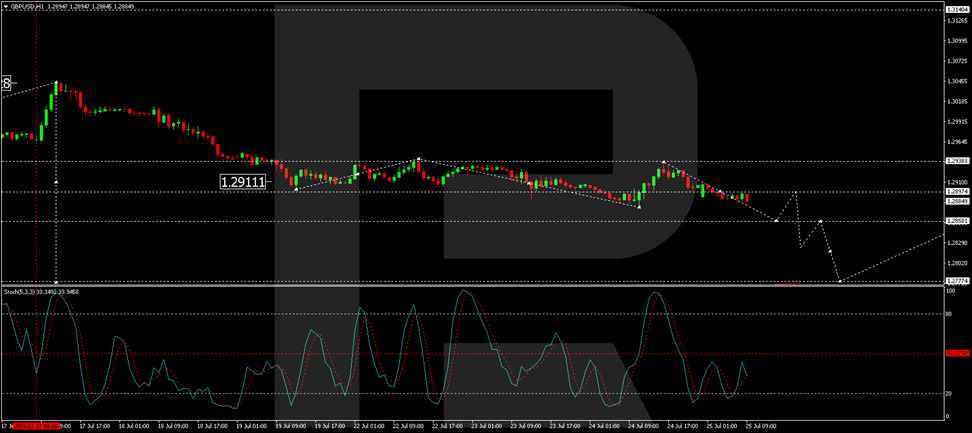
GBP/USD Technical Analysis
On the H4 chart of GBP/USD, the market has formed a consolidation range around the 1.2911 level. Today, the market broke out of this range downwards. The potential for a downside wave to 1.2777 is almost open. The target is the first one. After reaching this level, we will consider the probability of correction to 1.2911 (test from below). Technically, this scenario is confirmed by the MACD indicator. Its signal line is above the zero mark and is directed strictly downwards.
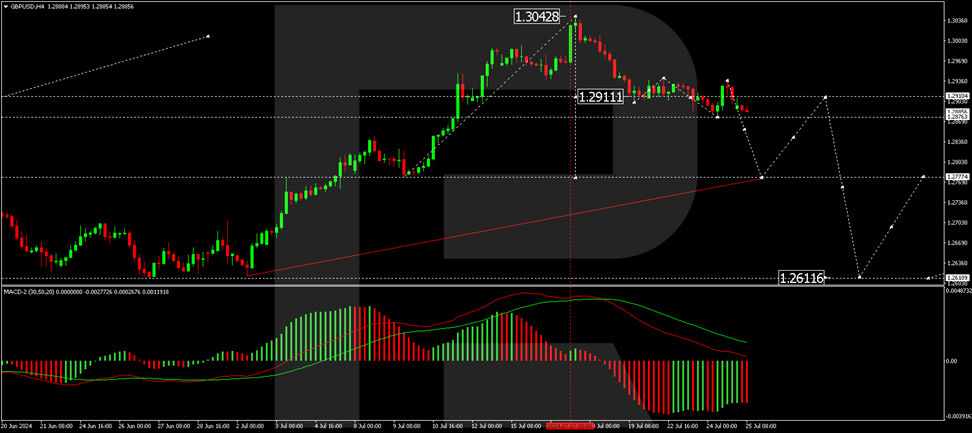
On the H1 chart of GBP/USD, a correction wave to the level of 1.2937 is performed. Today, the structure of decrease to the level of 1.2858 is formed. After working off this level, we will consider the probability of a growth link to the level of 1.2897. At this point, the correction potential will be exhausted. After the correction is over, we will consider the beginning of a new wave of decline to 1.2824 with the prospect of trend continuation to the level of 1.2777. Technically, this scenario is confirmed by the Stochastic oscillator. Its signal line is under the level of 50 and continues to decline to the level of 20.