
Sample Category Title
EUR/JPY Daily Outlook
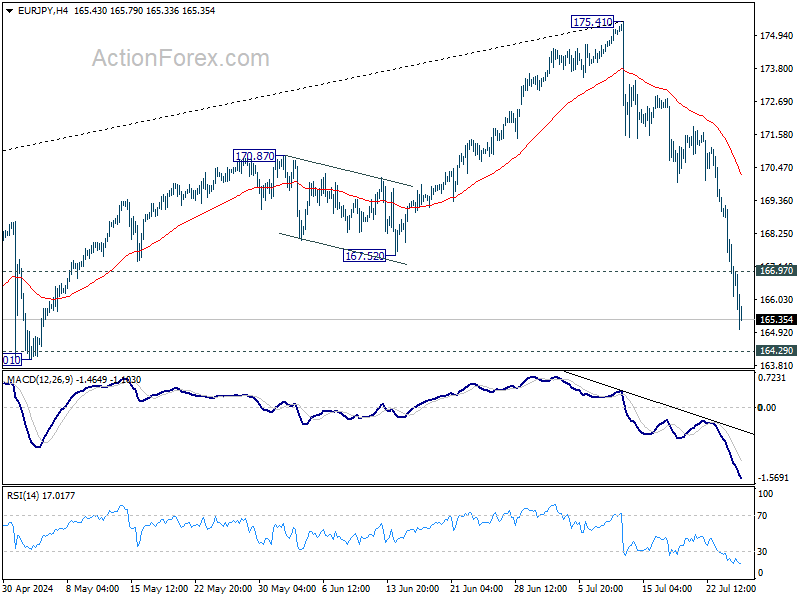
Daily Pivots: (S1) 165.57; (P) 167.39; (R1) 168.64; More...
EUR/JPY's steep decline from 175.41 extends further today and there is no sign of bottoming yet. Medium term channel support is also breached. Intraday bias stays on the downside for 164.29 key resistance turned support. Firm break there will argue that larger scale correction is underway for 155.91 fibonacci level. On the upside, above 166.97 minor resistance will turn intraday bias neutral first.
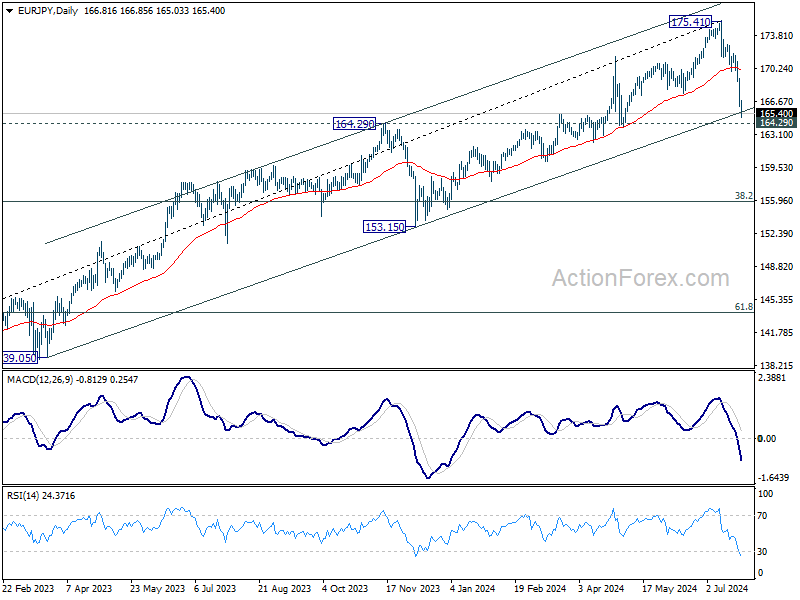
In the bigger picture, immediate focus is now on 164.29 resistance turned support. Strong rebound from there will retain medium term bullishness for resuming the up trend through 175.41 at a later stage. However, decisive break of 164.29 will indicate that fall from 175.41 is at least correcting the rise from 124.73, with risk of bearish trend reversal. Deeper decline would be seen to 38.2% retracement of 124.37 to 175.41 at 155.91.
EUR/GBP Daily Outlook
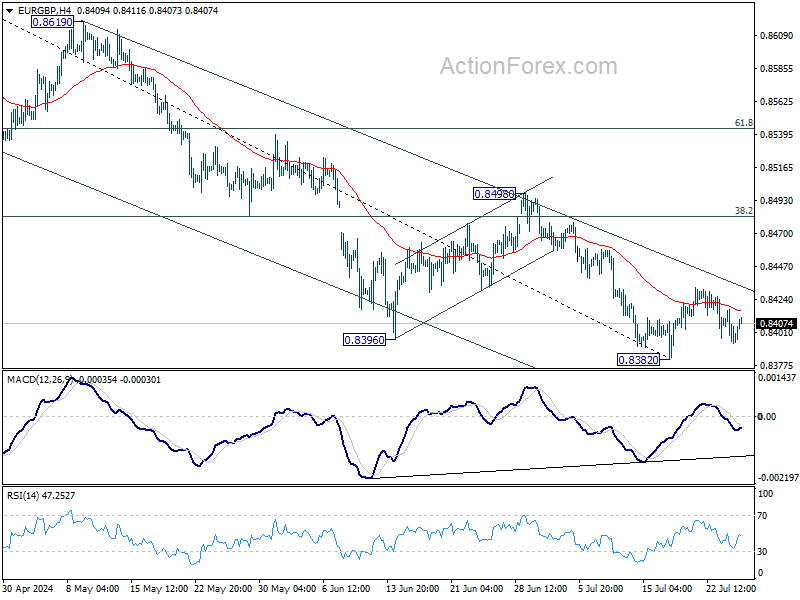
Daily Pivots: (S1) 0.8389; (P) 0.8403; (R1) 0.8413; More....
Range trading continues in EUR/GBP and intraday bias stays neutral. While rebound from 0.8382 could extend higher, outlook will stay bearish as long as 0.8498 resistance holds. Larger down trend should resume through 0.8382 at a later stage.
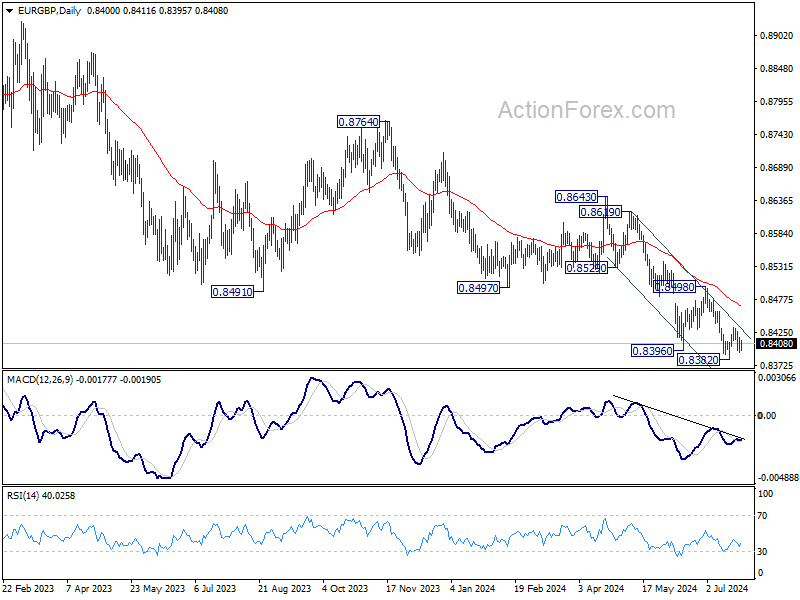
In the bigger picture, down trend from 0.9267 (2022 high) is in progress. Next target is 0.8201 key support (2022 low). For now, outlook will remain bearish as long as 0.8643 resistance holds, even in case of stronger rebound.
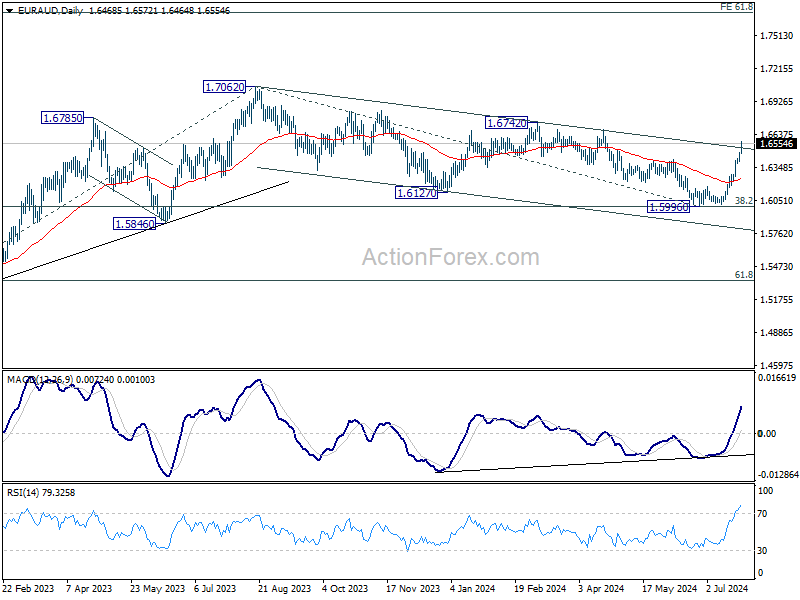
EUR/AUD Daily Outlook
Daily Pivots: (S1) 1.6423; (P) 1.6450; (R1) 1.6498; More...
EUR/AUD's rally from 1.5996 accelerates higher today and intraday bias stays on the upside for 1.6742 resistance. Decisive break there will argue that larger up trend is ready to resume and target 1.7062 high next. On the downside, below 1.6464 minor support will turn intraday bias neutral and bring consolidations first, before staging another rally.
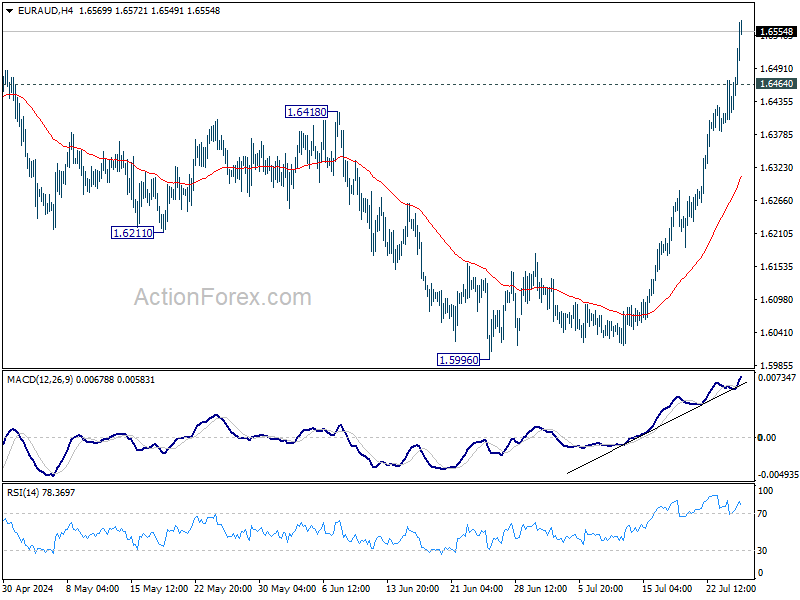
In the bigger picture, fall from 1.7062 medium term top is seen as a correction to the up trend from 1.4281 (2022 low) and could have completed after hitting 38.2% retracement of 1.4281 to 1.7062 at 1.6000. On resumption next target will be 61.8% projection of 1.4281 to 1.7062 from 1.5996 at 1.7715. This will now remain the favored case as long as 55 D EMA (now at 1.6251) holds.
A Bad Day for Tech Stocks
Underwhelming results from Tesla and Alphabet painted the equity markets in the red yesterday. The S&P500 experienced its worst selloff since December 2022 with a 2.30% drop. It tested its 50-DMA (near 5428) to the downside. Nasdaq 100 tumbled 3.65% and sank below its own 50-DMA. Tesla dived more than 12% on earnings miss and no fresh news on robotaxis, Google lost 5% on prospects of increased AI spending. Google’s capex spending will reach or exceed $24bn that will bring the total spending this year to almost $50bn - or around 84% more than the past five-year average according to the WSJ. The company CEO thinks that underinvesting is a bigger risk than overinvesting. But that narrative is no longer welcome among investors.
As such, the prospect of higher AI spending pause a problem even for the investors of the companies that will benefit from that spending. Nvidia saw its stock price dive 6.80%. Broadcom fell more than 7.50% as AMD sank 6% below its 200-DMA. This harsh market reaction to Google earnings – which were a beat by the way - hints that we are coming to a point in the AI rally where investors are increasingly impatient to see their massive spending turn into profits, while the big spenders continue to say that they should spend more before seeing the benefits. As such, Meta – which could also tell its investors that more spending is in store – also fell more than 5% yesterday. All in all, Roundhill’s Magnificent 7 ETF dropped more than 6% yesterday, slipped and closed below the 50-DMA. For the bears who were waiting in ambush, the time of correction may have come and could erase 10-15% from the S&P500 if the upcoming earnings can’t turn the wind.
Also, from a broader perspective, the fact that the Federal Reserve (Fed) cut expectations are rising is not positive for the Big Tech stocks as these behemoths were seen as a safe place to hide when the rates were high, and could see their advance wane due to a sector rotation. Therefore, a tech selloff combined with lower interest rates, is expected to boost appetite for small caps, and the dullest pockets of the market – like consumer staples, healthcare and utilities. But yesterday, the wining combo of tech outflows and lower yields couldn’t cheer up the Russell 2000 – which closed the day 2% lower.
Yet, note that the US yield curve got steeper yesterday, as the 2-year yield fell below 4.45% for the first time since February while the 10-year yield took the opposite direction and rose to 4.30%, narrowing the gap between the two to just 15bp – the smallest gap since October 2023. That’s a confirmation that investors see the Fed lowering its rates sooner and more rapidly than previously expected. The consensus is two – or maybe 3 – rate cuts this year, with the first one seen coming in September, but the odds for an earlier rate cut - next week - are on the rise since the former NY Fed head Bill Dudley called for lower rates preferable at next week’s meeting. Activity on Fed funds futures assess less than 7% probability for a hurried rate cut next week and because the Fed has no reason to rush to the exit in the absence of a reason to do so – like a bank stress or abnormally soft economic data – I think that we will still have to wait for September to see the Fed cut its rates for the first time this year.
In the FX
The fact that the Fed and the market is preparing to cut should keep the US dollar index under pressure, although the rising Fed cut bets also softens the dovish central bank expectations elsewhere and should limit the potential weakness of the greenback. The US dollar index fell below its 200-DMA yet yesterday. Due today, the latest US GDP update is expected to show that the US economy may have secured a 2% growth in the Q2, up from 1.4% printed earlier. And a relatively strong growth from the US could limit the US dollar’s losses, as economic woes rise elsewhere. The EURUSD extended losses to1.0825 after a set of weaker-than-expected PMI numbers from the eurozone fueled the expectation that the European Central Bank (ECB) won’t have a choice but to cut in September. The weakness in German economy, where the composite PMI sank unexpectedly into the contraction zone for the first time since April, and a further slowdown in French manufacturing stood out. Consequently, the rising dovish ECB expectations defy the rising dovish Fed expectations and could eventually prevent the EURUSD from making that move above the 1.10.
Speaking of rate cuts, the Bank of Canada (BoC) cut its policy rate by 25bp to 4.50% yesterday, as expected, and highlighted the downside risks fueling the BoC doves and sent the USDCAD past the 1.38 as predicted.
Elsewhere, the long yen trade is gaining momentum. The USDJPY fell to 152.23 due to rising bets on a Bank of Japan (BoJ) rate hike and the unwinding of carry positions. The major risk is that the BoJ might refuse to hike next week, causing the entire long yen trade to collapse. But that’s probably just a bad thought.
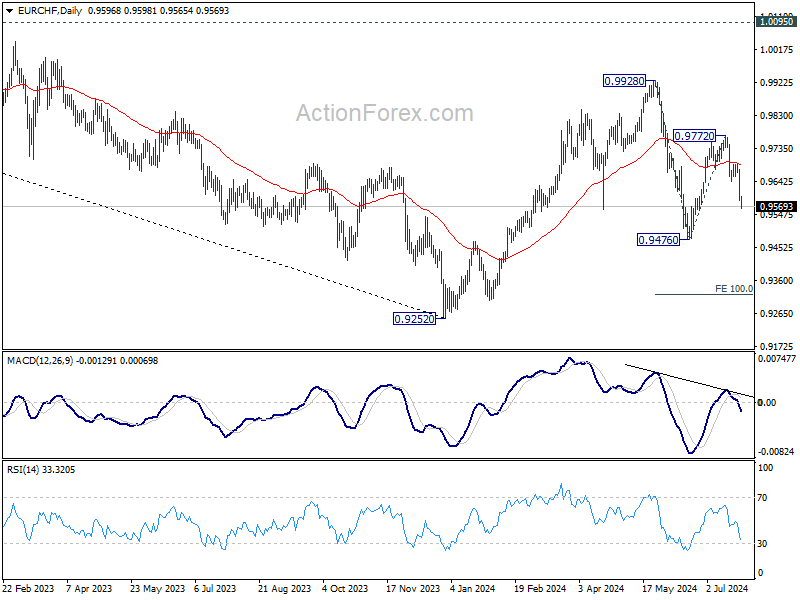
EUR/CHF Daily Outlook
Daily Pivots: (S1) 0.9563; (P) 0.9620; (R1) 0.9652; More....
EUR/CHF's fall from 0.9772 continues today and intraday bias stays on the downside. With 61.8% retracement of 0.9476 to 0.9772 at 0.9589 broken, next target is 0.9476 low. Firm break there will resume whole fall from 0.9928 to 100% projection of 0.9928 to 0.94767 from 0.9772 at .9320. On the upside, above 0.9641 support turned resistance will turn intraday bias neutral first.
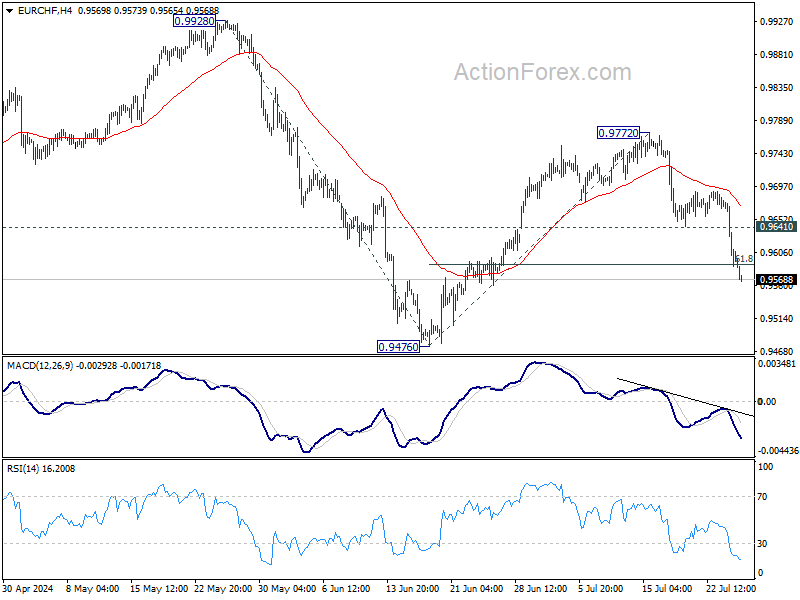
In the bigger picture, with 1.0095 key medium term resistance intact, price actions from 0.9252 (2023 low) are seen as a corrective pattern. Fall from 0.9928 might be the second leg and break of 0.9476 would bring deeper fall to retest 0.9252 low. But strong support should be seen there to extend the corrective pattern with another rising leg. In case, medium term outlook will be neutral at best as long as 1.0095 structural resistance holds.
Relentless Yen Rally in Risk-Off Market: Will US GDP Turn the Tide?
Risk aversion has firmly gripped the markets, leading to the steepest selloff in US stocks since 2022 overnight. This sharp decline continued into the Asian trading session, with Nikkei plunging nearly 3%. The market rout is further exacerbated by a broad decline in base metals, oil, and even cryptocurrencies, signaling a widespread flight to safety.
Amidst this backdrop, Japanese Yen's rally appears unstoppable. Yen, along with Swiss Franc and Dollar, are benefiting from their status as safe-haven currencies. Conversely, commodity currencies such as the Australian Dollar are bearing the brunt of the selloff, sinking to the bottom of the performance charts. Euro and British Pound are faring relatively better, positioning themselves in the middle of the pack.
Today's key economic focus is US Q2 GDP advance report, where growth is expected to pick up to 2.0% annualized from Q1's 1.4%. This anticipated increase is attributed to resilient consumer spending, which has persisted despite inflationary pressures and high borrowing costs. However, there are concerns about how long this resilience can last, especially as pandemic-era savings dwindle.
A lower-than-expected GDP reading could strengthen the case for Fed to implement two interest rate cuts this year. Yet, it's uncertain if the markets will maintain the trend of interpreting "bad news as good news."
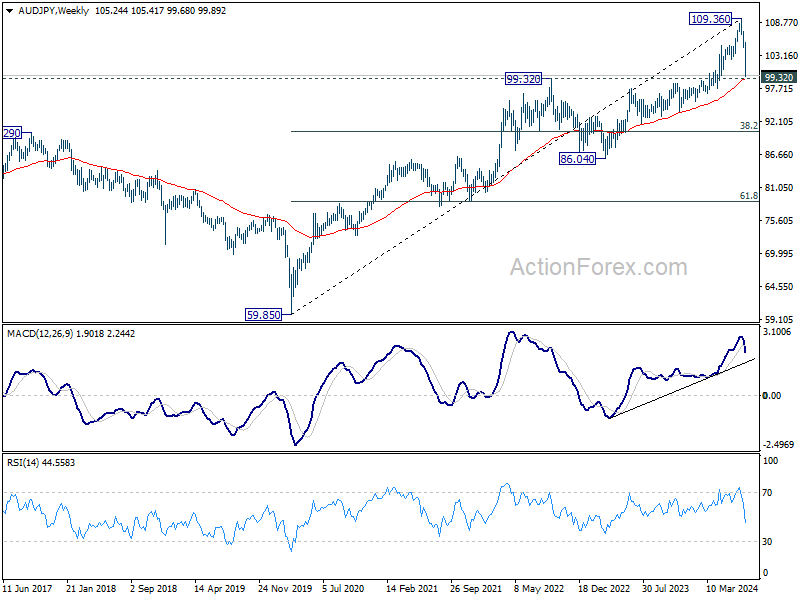
Technically, AUD/JPY is now in proximity to a key medium term support zone with this week's free fall. There is prospect of stabilization around 99.32 resistance turned support as well as 55 W EMA (now at 99.24). However, decisive break there will argue that it's already correcting the whole up trend from 59.85, could pave the way back to 38.2% retracement of 59.85 to 109.36 at 90.44.
In Asia, at the time of writing, Nikkei is down -3.21%. Hong Kong HSI is down -1.72%. China Shanghai SSe is down -0.72%. Singapore Strait Times is down -0.90%. Japan 10-year JGB yield is down -0.0101 at 1.067. Overnight, DOW fell -1.25%. S&P 500 fell -2.31%. NASDAQ fell -3.64%. 10-year yield rose 0.047 to 4.286.
Tech Woes and Election Jitters Trigger Steep US Stock Sell-Off
US stocks took a steep dive overnight, with S&P 500 and NASDAQ Composite suffering their worst sessions since 2022, down -2.31% and -3.64% respectively. The sell-off was triggered by disappointing earnings reports from tech giants Alphabet and Tesla. Alphabet's shares fell -5%, marking their biggest one-day drop since January 31, while Tesla plummeted -2.3%, its worst performance since 2020.
Beyond earnings, the market's unease is likely compounded by the approaching US presidential election in November. With Joe Biden stepping out of the race and Kamala Harris stepping in, Donald Trump's lead appeared to have narrowed significantly, and political uncertainty is looming large. Investors seem to be moving to lock in profits after the strong record run since last November, bracing for volatility in the lead-up to the election. This could signal a correction period, with the market possibly experiencing downward pressure for the next few months.
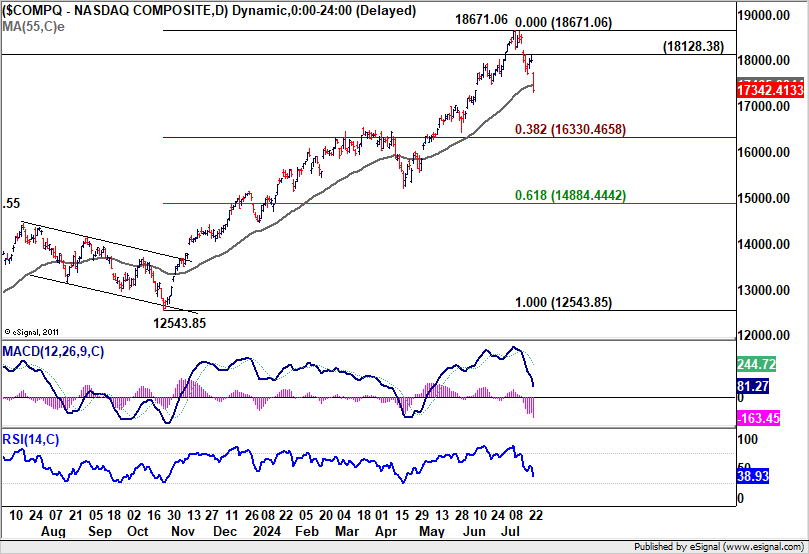
Technically, NASDAQ's break of 55 D EMA (now at 17465.33) argues that it might at least be correcting the up trend from 12543.85. Risk is now on the downside as long as 18128.38 resistance holds. NASDAQ could falls to 38.2% retracement of 12543.85 to 18671.06 at 16330.46 before finding strong support to set the range for consolidations.
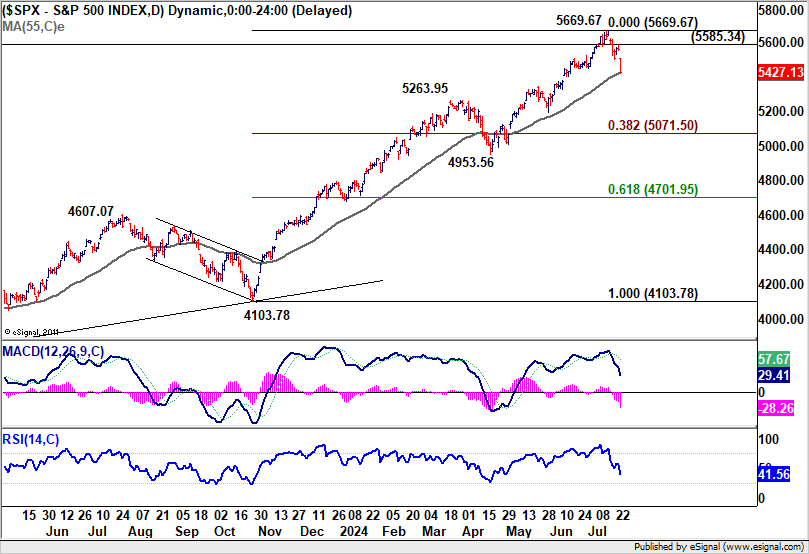
As for S&P 500, risk will stay on the downside as long as 5585.34 resistance holds. Decisive break of 55 D EMA (now at 5418.40) will align the outlook with NASDAQ. Deeper fall would be then be seen in S&P 500 to 38.2% retracement of 4103.78 to 5669.67 at 5071.50, before forming a base to set the range for medium term consolidations.
Japanese government notes export stagnation as global risks mount
Japan's government maintained its economic assessment but noted a more pessimistic outlook for exports due to weakening demand from China.
According to the Cabinet Office's Monthly Economic Report, the Japanese economy is recovering at a "moderate pace," though it has recently "appeared to be pausing." The assessment of exports was downgraded from "appearing to be pausing for picking up" to "almost flat," reflecting the impact of slowing Chinese demand.
In the short term, the economy is expected to continue its moderate recovery, supported by an "improving employment and income situation." However, several risks threaten this outlook. These include the slowdown in global economies, high-interest rates in the US and Europe, and the "lingering stagnation of the real estate market in China."
The report also highlighted the need to monitor price increases, geopolitical tensions in the Middle East, and fluctuations in financial and capital markets.
Looking ahead
Germany Ifo business climate is the main feature in European session while Eurozone will release M3 money supply. Later in the day, US Q2 GDP advance will take center stag, while jobless claims and durable goods orders will also be published.
EUR/CHF Daily Outlook
Daily Pivots: (S1) 0.9563; (P) 0.9620; (R1) 0.9652; More....
EUR/CHF's fall from 0.9772 continues today and intraday bias stays on the downside. With 61.8% retracement of 0.9476 to 0.9772 at 0.9589 broken, next target is 0.9476 low. Firm break there will resume whole fall from 0.9928 to 100% projection of 0.9928 to 0.94767 from 0.9772 at .9320. On the upside, above 0.9641 support turned resistance will turn intraday bias neutral first.
In the bigger picture, with 1.0095 key medium term resistance intact, price actions from 0.9252 (2023 low) are seen as a corrective pattern. Fall from 0.9928 might be the second leg and break of 0.9476 would bring deeper fall to retest 0.9252 low. But strong support should be seen there to extend the corrective pattern with another rising leg. In case, medium term outlook will be neutral at best as long as 1.0095 structural resistance holds.
Economic Indicators Update
| GMT | Ccy | Events | Actual | Forecast | Previous | Revised |
|---|---|---|---|---|---|---|
| 23:50 | JPY | Corporate Service Price Index Y/Y Jun | 3.00% | 2.60% | 2.50% | 2.70% |
| 08:00 | EUR | Germany IFO Business Climate Jul | 89 | 88.6 | ||
| 08:00 | EUR | Germany IFO Current Assessment Jul | 88.5 | 88.3 | ||
| 08:00 | EUR | Germany IFO Expectations Jul | 89 | 89 | ||
| 08:00 | EUR | Eurozone M3 Money Supply Y/Y Jun | 1.90% | 1.60% | ||
| 12:30 | USD | Initial Jobless Claims (Jul 19) | 238K | 243K | ||
| 12:30 | USD | GDP Annualized Q2 P | 2.00% | 1.40% | ||
| 12:30 | USD | GDP Price Index Q2 P | 2.60% | 3.10% | ||
| 12:30 | USD | Durable Goods Orders Jun | 0.40% | 0.10% | ||
| 12:30 | USD | Durable Goods Orders ex Transport Jun | 0.20% | -0.10% | ||
| 14:30 | USD | Natural Gas Storage | 13B | 10B |
Elliott Wave Intraday Analysis: Ethereum (ETHUSD) Pullback In Progress
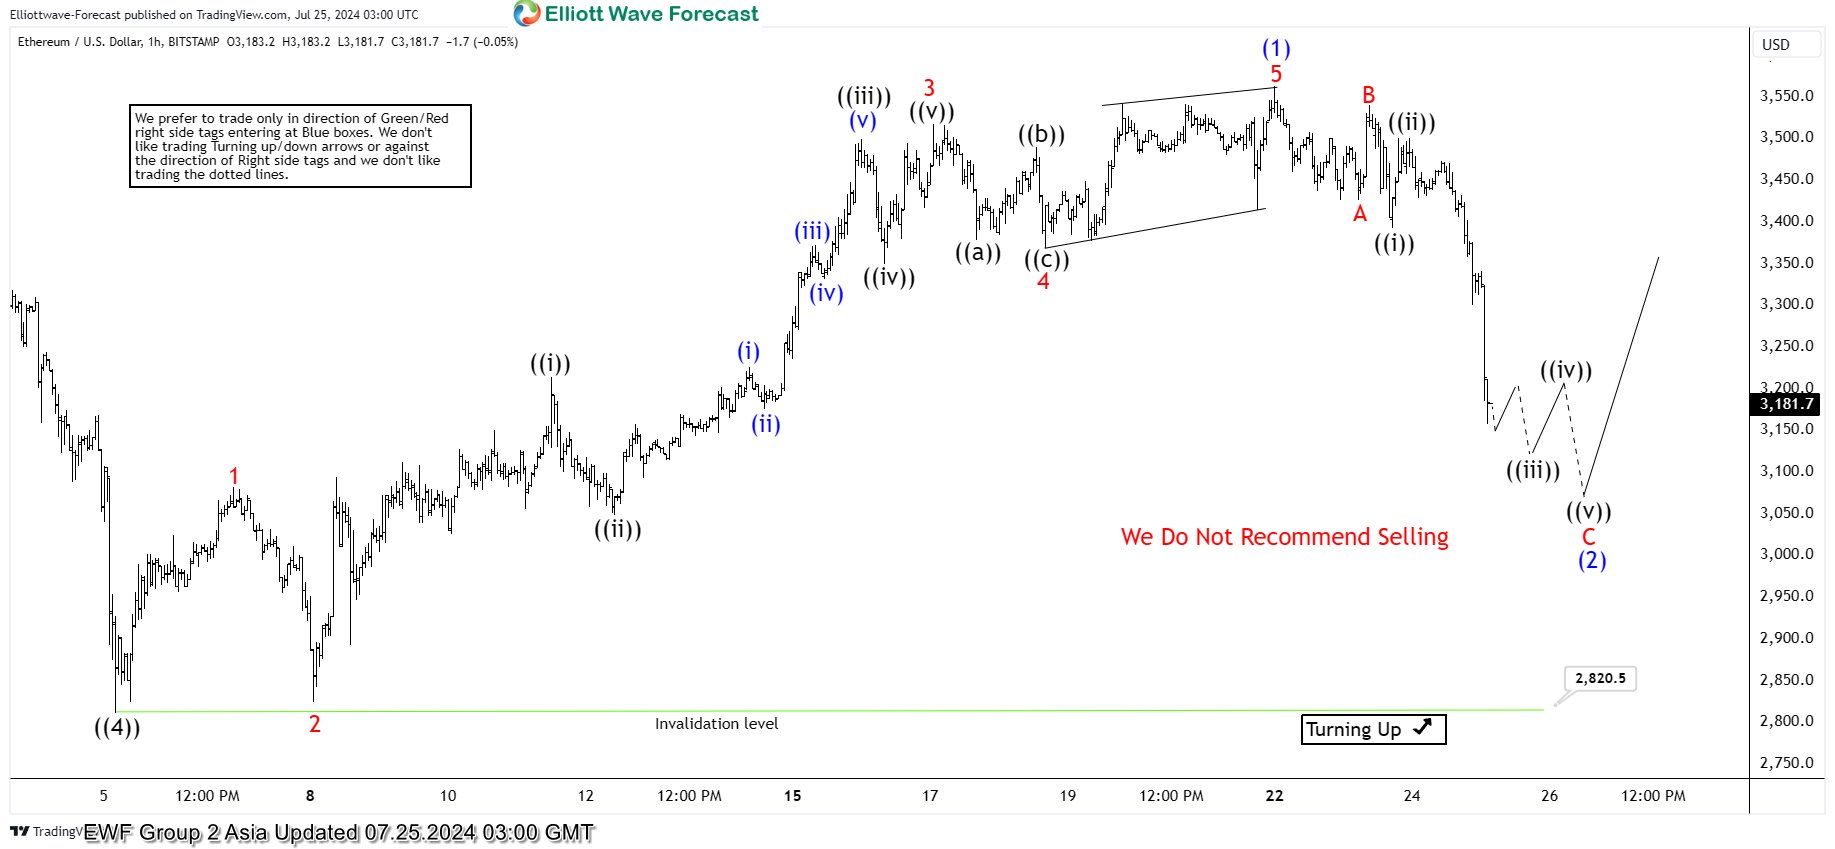
Short Term Elliott Wave View in Ethereum (ETHUSD) suggests the impulse sequence ended at $3562.6 high started from 7.05.2024 low. Below there, it favors corrective pullback in wave (2). In daily sequence, it ended ((4)) correction at $2811 low as double three structure against November-2022 low. Above ((4)) low, it ended wave (1) rally at $3562.6 high as the part of ((5)). Within (1), it placed 1 at $3081.6 high and 2 at $2824 low as dip pullback. It resumed higher in 3 as extended wave, ended at $3517.2 high as 2.618 Fibonacci extension of 1. Within 3 of (1), it placed ((i)) at $3213.6 high, ((ii)) at 3048.9 low, ((iii)) at $3499.1 high, ((iv)) at $3350 low & ((v)) at $3517.2 high. It placed 4 as 3 swing pullback at $3368.5 low and 5 as diagonal sequence ended at $3562.6 high as (1) as impulse sequence.
Below $3562.6 high, it favors corrective pullback in (2), which expects to stay above $2811 low to turn higher. It placed A of (2) at $3426 low and B at $3450.2 high. Below there, it favors downside in ((iii)) of C, while placed ((i)) at $3393 low and ((ii)) at $3500.6 high. It expects two minor lows to finish ((iii)) of C before any bounce in ((iv)) followed by final push lower. The pullback showing the extended C leg in (2) pullback, which can end soon before turning higher in (3). Further upside (3) will confirm above $3562.6 high. Alternatively, if it breaks below $2811 low, it can extend ((4)) as double correction against November-2022 low in daily sequence.
Ethereum (ETHUSD) 60 Minutes Elliott Wave Chart
Ethereum (ETHUSD) Elliott Wave Video
https://www.youtube.com/watch?v=XUMeOpzkK3s
Japanese government notes export stagnation as global risks mount
Japan's government maintained its economic assessment but noted a more pessimistic outlook for exports due to weakening demand from China.
According to the Cabinet Office's Monthly Economic Report, the Japanese economy is recovering at a "moderate pace," though it has recently "appeared to be pausing." The assessment of exports was downgraded from "appearing to be pausing for picking up" to "almost flat," reflecting the impact of slowing Chinese demand.
In the short term, the economy is expected to continue its moderate recovery, supported by an "improving employment and income situation." However, several risks threaten this outlook. These include the slowdown in global economies, high-interest rates in the US and Europe, and the "lingering stagnation of the real estate market in China."
The report also highlighted the need to monitor price increases, geopolitical tensions in the Middle East, and fluctuations in financial and capital markets.
Tech Woes and Election Jitters Trigger Steep US Stock Sell-Off
US stocks took a steep dive overnight, with S&P 500 and NASDAQ Composite suffering their worst sessions since 2022, down -2.31% and -3.64% respectively. The sell-off was triggered by disappointing earnings reports from tech giants Alphabet and Tesla. Alphabet's shares fell -5%, marking their biggest one-day drop since January 31, while Tesla plummeted -2.3%, its worst performance since 2020.
Beyond earnings, the market's unease is likely compounded by the approaching US presidential election in November. With Joe Biden stepping out of the race and Kamala Harris stepping in, Donald Trump's lead appeared to have narrowed significantly, and political uncertainty is looming large. Investors seem to be moving to lock in profits after the strong record run since last November, bracing for volatility in the lead-up to the election. This could signal a correction period, with the market possibly experiencing downward pressure for the next few months.
Technically, NASDAQ's break of 55 D EMA (now at 17465.33) argues that it might at least be correcting the up trend from 12543.85. Risk is now on the downside as long as 18128.38 resistance holds. NASDAQ could falls to 38.2% retracement of 12543.85 to 18671.06 at 16330.46 before finding strong support to set the range for consolidations.
As for S&P 500, risk will stay on the downside as long as 5585.34 resistance holds. Decisive break of 55 D EMA (now at 5418.40) will align the outlook with NASDAQ. Deeper fall would be then be seen in S&P 500 to 38.2% retracement of 4103.78 to 5669.67 at 5071.50, before forming a base to set the range for medium term consolidations.
Crude Oil Prices Continue to Fall, USD/JPY Tumbles
Key Highlights
- Crude oil prices started a fresh decline below the $80.00 support.
- A connecting bearish trend line is forming with resistance at $78.80 on the 4-hour chart.
- USD/JPY declined heavily below the 155.50 support.
- The US Gross Domestic Product could grow 2% in Q2 2024 (Prelim).
Crude Oil Price Technical Analysis
After a close below the $82.00 level, Crude oil prices started a steady decline. It broke the $80.20 and $80.00 support levels to enter a bearish zone.
Looking at the 4-hour chart of XTI/USD, the price settled below the $80.00 level, the 200 simple moving average (green, 4-hour), and the 100 simple moving average (red, 4-hour). The decline gained pace below the $78.50 level.

Finally, it tested the $77.25 zone and recently started a consolidation phase. There was a minor increase above the $78.00 level. However, the bears are active below $78.50.
There is also a connecting bearish trend line forming with resistance at $78.80 on the same chart. The next major resistance is near the $79.50 zone, above which the price may perhaps accelerate higher. In the stated case, it could even visit the $80.00 resistance.
If not, the price might start another decline. The first major support on the downside is near the $77.25 level. The next major support is $76.50. Any more losses might send oil prices toward $75.00 in the coming sessions.
Looking at USD/JPY, there were heavy losses below the 155.50 and 154.00 levels. The bears seem to be aiming for a move toward 150.00.
Economic Releases to Watch Today
- US Gross Domestic Product for Q2 2024 (Preliminary) – Forecast 2.0% versus previous 1.4%.
- US Durable Goods Orders for June 2024 – Forecast +0.3% versus +0.1% previous.
- US Initial Jobless Claims - Forecast 238K, versus 243K previous.