Sample Category Title
GBP/USD Mid-Day Outlook
Daily Pivots: (S1) 1.2822; (P) 1.2876; (R1) 1.2903; More...
No change in GBP/USD's outlook and intraday bias stays neutral. Further rally is expected with 1.2859 resistance turned support intact. Break of 1.3043 will resume the rise from 1.2298. However, firm break of 1.2859 will turn bias to the downside for deeper decline to 55 D EMA (now at 1.2771).
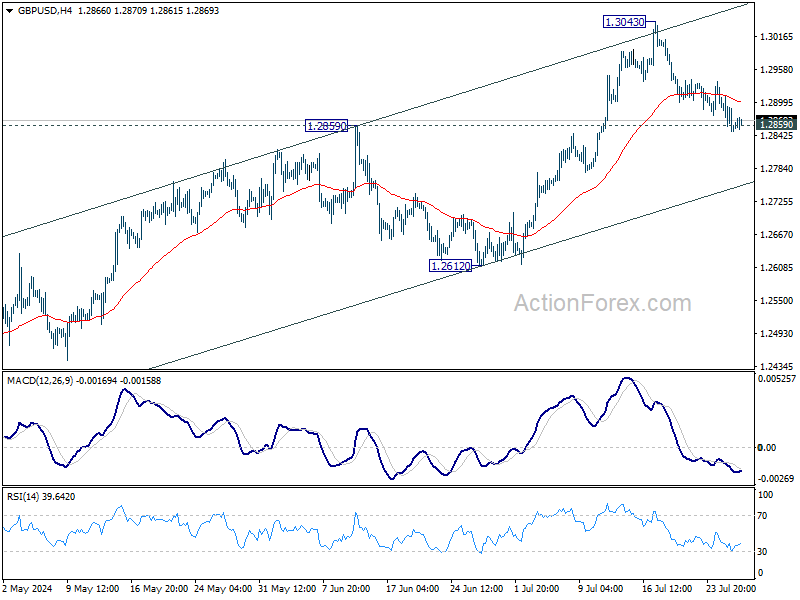
In the bigger picture, corrective pattern from 1.3141 medium term top (2023 high) could have completed with three waves to 1.2298 already. This will now remain the favored case as long as 1.2612 support holds. Firm break of 1.3141 will target 61.8% projection of 1.0351 (2022 low) to 1.3141 from 1.2298 at 1.4022.
USD/CHF Mid-Day Outlook
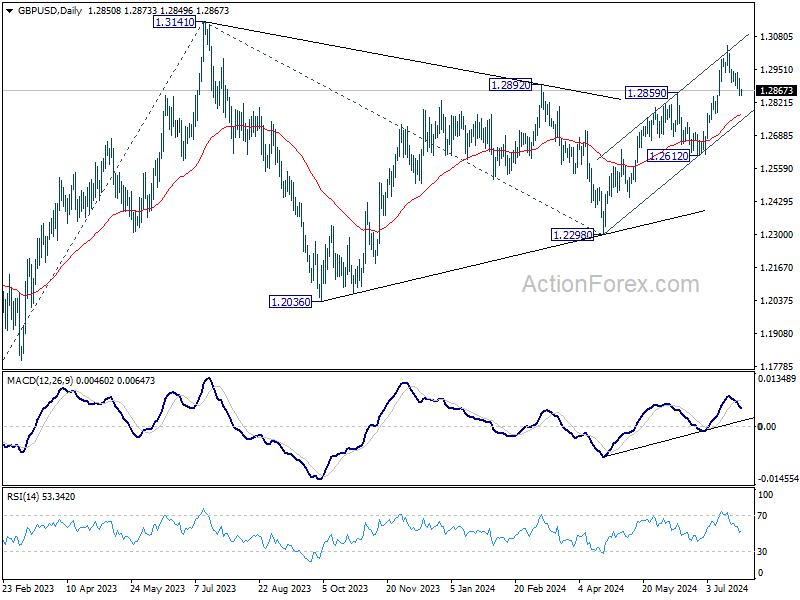
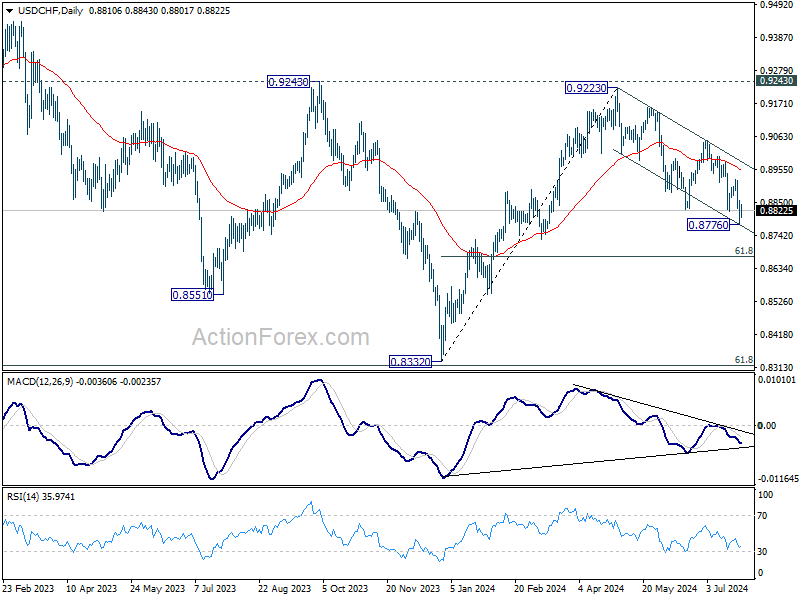
Daily Pivots: (S1) 0.8776; (P) 0.8818; (R1) 0.8858; More…
Intraday bias in USD/CHF is turned neutral with current recovery, and some consolidations would be seen above 0.8776 temporary low. Risk will stay on the downside as long as 0.8923 resistance holds. Break of 0.8776 will extend the fall from 0.9223 to 61.8% retracement of 0.8332 to 0.9223 at 0.8672.
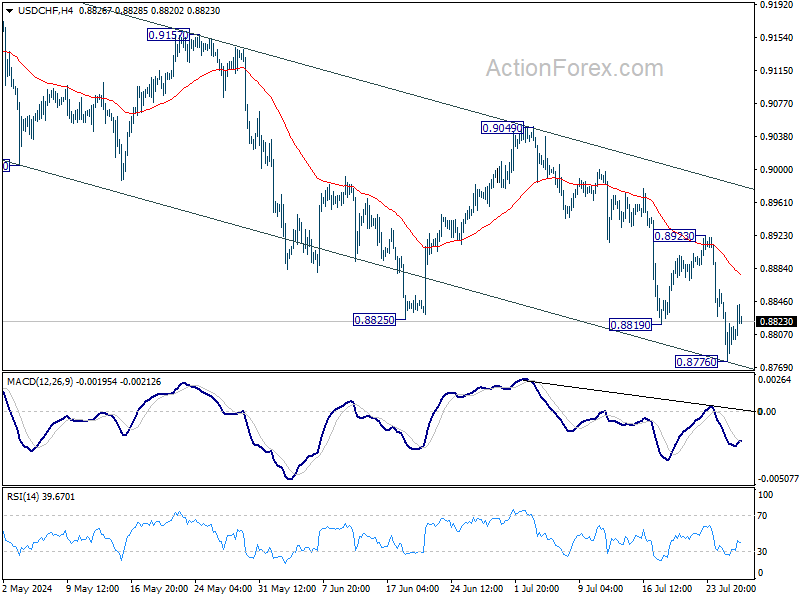
In the bigger picture, with 0.9243 resistance intact, medium term outlook in USD/CHF is neutral at best. For now, more sideway trading is likely between 0.8332/9243. However, firm break of 0.9243 will indicate larger bullish trend reversal.
US: Consumers Close Q2 on an Upbeat Note, But Momentum Unlikely to be Sustained
Personal income grew 0.2% month-on-month (m/m) in June, down from May's 0.4% gain, and below market expectations (also 0.4%).
Accounting for inflation and taxes, real personal disposable income growth slowed in June, up 0.1% m/m, relative to a 0.3% gain in May (revised down from 0.5% previously).
Personal consumption expenditures also geared down slightly in June, up 0.3% m/m. This is lower than the revised 0.4% recorded in May (0.2% previously), but in line with market expectations. Spending in real terms rose 0.2% m/m – adding to the 0.4% rise recorded in May. The uptick in real spending reflected increases in both goods (0.2%) and services (0.2%) outlays.
On inflation, the Fed's preferred inflation metric, the core PCE price deflator, ticked up on a monthly basis, but held steady annually. The measure rose from 0.1% to 0.2% month-over-month and remained at 2.6% annually. However, zeroing in on a 3-month annualized basis, core inflation has decelerated from its first quarter flare up, and now stands very close to the Fed's target, at 2.3%.
The personal savings rate declined to 3.4% in June from a downwardly revised 3.5% in May (previously 3.9%).
Key Implications
Today's report fills in some of the details of the headline numbers reported yesterday in the Q2 GDP advance release. Despite mounting challenges, such as slowing income growth and dwindling savings, the U.S. consumer powered ahead, closing out the second quarter with a decent showing. As such, real personal consumption expenditure growth was 2.3% annualized in 2024 Q2 (up from 1.5% in Q1). Most of the quarterly strength came from spending on goods (particularly durables), despite a solid showing from services spending in the final month of the quarter. Ultimately, with a decent handoff to Q3, consumers continue to display resilience, however continued cooling in the job market will put this to the test in the months ahead.
On the inflation front, despite a slight uptick in the monthly core figure, the recent cooling trend is likely to be interpreted favorably by the Federal Reserve. The trend is good news and it adds to the recent string of positive CPI inflation readings. With mounting evidence that both the economy and inflation are cooling, the prospect for a rate cut later this year continue to improve.
USD/JPY Mid-Day Outlook
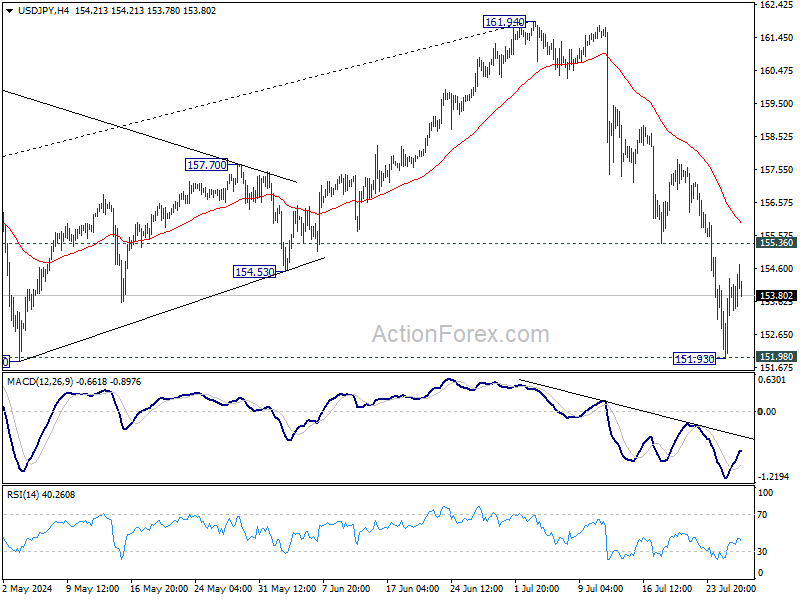
Daily Pivots: (S1) 152.48; (P) 153.40; (R1) 154.86; More...
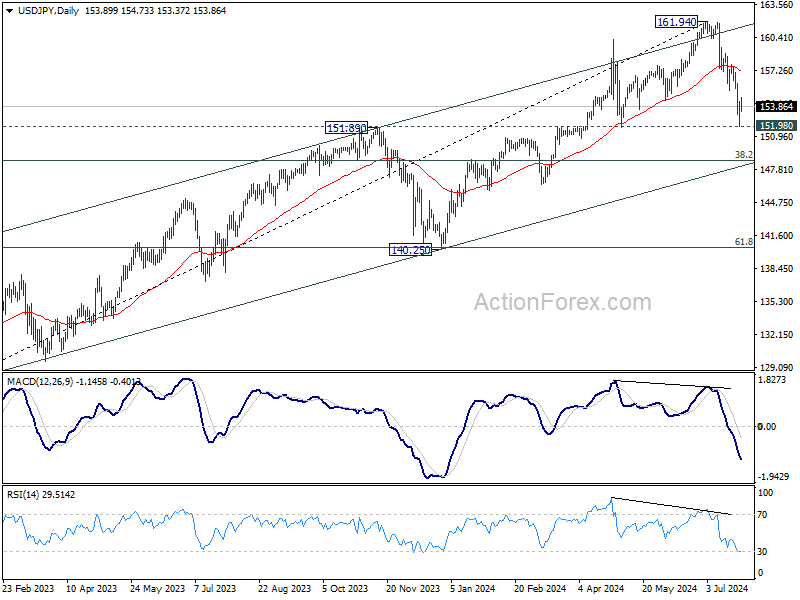
Intraday bias in USD/JPY remains neutral as consolidations continue above 151.93 temporary low. Risk will stay on the downside as long as 155.36 support turned resistance holds. Decisive break of 151.89 resistance turned support will argue that large scale correction is underway to 148.66 fibonacci level. Nevertheless, break of 155.36 will turn bias back to the upside for stronger rebound.
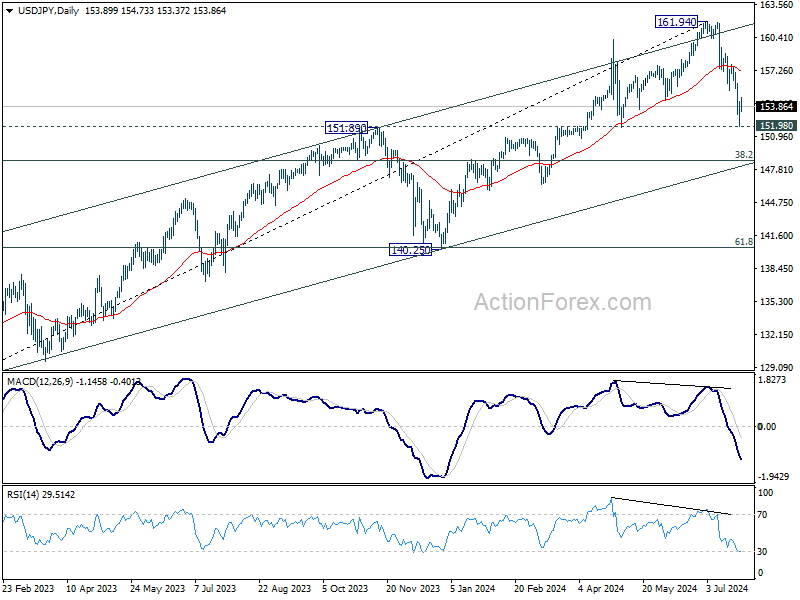
In the bigger picture, considering the depth and momentum of the current decline, 161.94 should be a medium term top already. Fall from there is seen as correcting the whole rise from 127.20 (2023 low) at least. Break of 151.89 will pave the way to 38.2% retracement of 127.20 to 161.94 at 148.66. Risk will now stay on the downside as long as 55 D EMA (now at 157.25) holds, in case of rebound.
Forex Markets Steady as Traders Shrug US PCE Data
Trading in the forex markets remains subdued today as investors take a breather from a week of high volatility. Most major currency pairs and crosses are trading within yesterday's ranges, with little reaction to US PCE inflation data. Annual Core PCE rate was surprisingly unchanged in June, but the slight monthly increase still indicates that disinflation is in progress, keeping investors relatively calm.
In other markets, US futures are trading sharply higher, suggesting that tech shares, in particular, are set to recover some of this week's steep losses. 10-year Treasury yield is slightly down, continuing its recent range-bound pattern. Gold is attempting to find support at the 55 D EMA to maintain its near-term bullish outlook, while WTI crude oil is struggling to reclaim 80 handle despite recovery yesterday.
In Europe, at the time of writing, FTSE is up 0.88%. DAX is up 0.41%. CAC is up 0.85%. UK 10-year yield is down -0.030 at 4.107. Germany 10-year yield is up 0.013 at 2.435. Earlier in Asia, Nikkei fell -0.53%. Hong Kong HSI rose 0.10%. China Shanghai SSE rose 0.14%. Singapore Strait Times fell -0.12%. Japan 10-year JGB yield fell -0.0128 to 1.062.
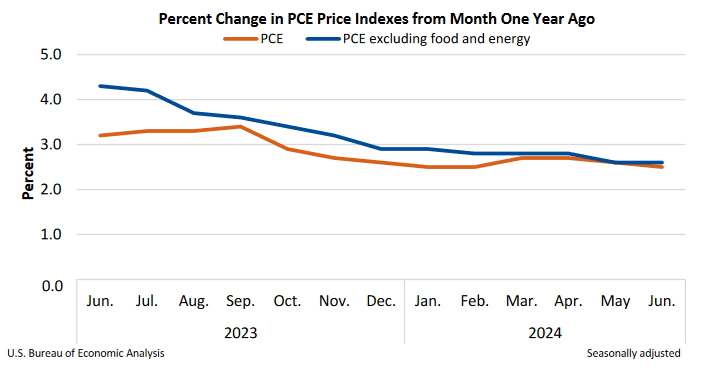
US PCE inflation slows to 2.5% in Jun, but core PCE unchanged at 2.6%
US PCE price index rose 0.1% mom in June, matched expectations. Core CPI (excluding food and energy) rose 0.2% mom, matched expectations. Prices for goods decreased -0.2% mom and prices for services increased 0.2% mom. Food prices increased 0.1% mom and energy prices decreased -2.1% mom.
From the same month one year ago, PCE price index growth slowed from 2.6% yoy to 2.5% yoy, matched expectations. However, core PCE price index was unchanged at 2.6% yoy, above expectation of 2.5% yoy. Prices for goods decreased -0.2% yoy and prices for services increased 3.9% yoy. Food prices increased 1.4% yoy and energy prices increased 2.0% yoy.
Personal income rose 0.2% mom or USD 50.4B, below expectation of 0.4% mom. Personal spending rose 0.3% mom or USD 57.6B, matched expectations.
ECB consumer survey: Inflation expectations steady, economic growth outlook deteriorates
The latest ECB Consumer Expectations Survey results revealed stable inflation expectations but a more negative outlook for economic growth.
Median inflation expectations for the next 12 months remained unchanged at 2.8%, holding at their lowest level since September 2021. Similarly, inflation expectations for three years ahead stayed steady at 2.3%.
However, economic growth projections have taken a downturn. Expectations for growth over the next 12 months worsened, with the median forecast dropping to -0.9%, compared to -0.8% in May.
On a positive note, expectations for the unemployment rate in 12 months' time decreased slightly to 10.6% from 10.7% in May, marking the lowest level since the series began.
Tokyo CPI core rises, but core-core falls; BoJ rate hike uncertainty persists
Japan's Tokyo CPI core (excluding food) increased from 2.1% yoy to 2.2% yoy in July, aligning with market expectations. This marks the third consecutive month of re-acceleration following a dip to 1.6% yoy in April. The primary driver of this uptick was energy prices, with electricity costs soaring by 19.7% yoy due to the termination of government utility subsidies.
However, other inflation measures showed a slowdown. CPI core-core (excluding food and energy) dropped from 1.8% yoy to 1.5% yoy. Additionally, services inflation decreased from 0.9% yoy to 0.5% yoy, while headline CPI fell slightly from 2.3% yoy to 2.2% yoy.
The increase in core inflation maintains the possibility of a BoJ rate hike next week. However, the current data is not sufficiently conclusive to confirm this outcome. Swap markets indicate a 38% probability of a 15bps hike. A Bloomberg survey reveals that 30% of BoJ watchers anticipate a hike, with 90% viewing it as a potential risk.
USD/JPY Mid-Day Outlook
Daily Pivots: (S1) 152.48; (P) 153.40; (R1) 154.86; More...
Intraday bias in USD/JPY remains neutral as consolidations continue above 151.93 temporary low. Risk will stay on the downside as long as 155.36 support turned resistance holds. Decisive break of 151.89 resistance turned support will argue that large scale correction is underway to 148.66 fibonacci level. Nevertheless, break of 155.36 will turn bias back to the upside for stronger rebound.
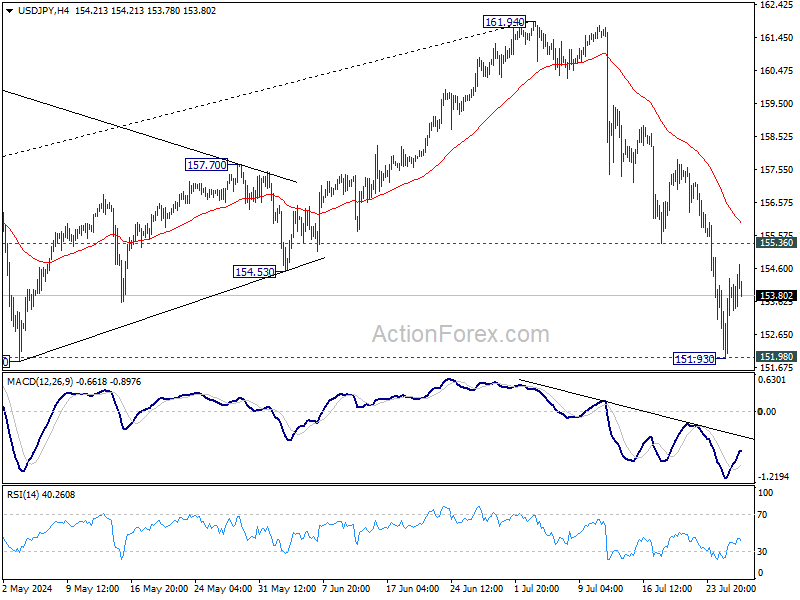
In the bigger picture, considering the depth and momentum of the current decline, 161.94 should be a medium term top already. Fall from there is seen as correcting the whole rise from 127.20 (2023 low) at least. Break of 151.89 will pave the way to 38.2% retracement of 127.20 to 161.94 at 148.66. Risk will now stay on the downside as long as 55 D EMA (now at 157.25) holds, in case of rebound.
Economic Indicators Update
| GMT | Ccy | Events | Actual | Forecast | Previous | Revised |
|---|---|---|---|---|---|---|
| 23:30 | JPY | Tokyo CPI Y/Y Jul | 2.20% | 2.30% | ||
| 23:30 | JPY | Tokyo CPI Core Y/Y Jul | 2.20% | 2.20% | 2.10% | |
| 23:30 | JPY | Tokyo CPI Core-Core Y/Y Jul | 1.50% | 1.80% | ||
| 12:30 | USD | Personal Income M/M Jun | 0.20% | 0.40% | 0.50% | |
| 12:30 | USD | Personal Spending Jun | 0.30% | 0.30% | 0.20% | |
| 12:30 | USD | PCE Price Index M/M Jun | 0.10% | 0.10% | 0.00% | |
| 12:30 | USD | PCE Price Index Y/Y Jun | 2.50% | 2.50% | 2.60% | |
| 12:30 | USD | Core PCE Price Index M/M Jun | 0.20% | 0.20% | 0.10% | |
| 12:30 | USD | Core PCE Price Index Y/Y Jun | 2.60% | 2.50% | 2.60% | |
| 14:00 | USD | Michigan Consumer Sentiment Jul F | 66 | 66 |
US PCE inflation slows to 2.5% in Jun, but core PCE unchanged at 2.6%
US PCE price index rose 0.1% mom in June, matched expectations. Core CPI (excluding food and energy) rose 0.2% mom, matched expectations. Prices for goods decreased -0.2% mom and prices for services increased 0.2% mom. Food prices increased 0.1% mom and energy prices decreased -2.1% mom.
From the same month one year ago, PCE price index growth slowed from 2.6% yoy to 2.5% yoy, matched expectations. However, core PCE price index was unchanged at 2.6% yoy, above expectation of 2.5% yoy. Prices for goods decreased -0.2% yoy and prices for services increased 3.9% yoy. Food prices increased 1.4% yoy and energy prices increased 2.0% yoy.
Personal income rose 0.2% mom or USD 50.4B, below expectation of 0.4% mom. Personal spending rose 0.3% mom or USD 57.6B, matched expectations.
Gold Technical: Recent Sell-off May Have Reached a Potential Bullish Reversal Level at US$2,353
- The recent weakness seen in Gold (XAU/USD) is likely to be driven by US politics as the “Gold premium” has moved in synch with the betting odds of Republican nominee Trump winning the US Presidential Election.
- The US Treasury market is likely to take a driver’s seat now as the focus returns to the monetary policy guidance from the outcome of the US Fed FOMC meeting next Wednesday, 31 July.
- The 10-year US Treasury real yield has staged a bearish reaction below its 2.00%/2.07% key intermediate resistance that may support higher Gold (XAU/USD) prices.
Since our last publication, the price actions of Gold (XAU/USD) have shaped the expected push-up to print another fresh all-time intraday high of US$2,484 on Wednesday, 17 July.
After that, Gold (XAU/USD) slipped by 5.26% to print an intraday low of US$2,353 on Thursday, 25 July. The recent weakness in the Gold is likely to be driven by the US Presidential Election fiasco where US President Biden dropped out of the race and nominated Vice President Harris as the Democrat presidential nominee with the support from most prominent Democrats to face off against the Republican presidential nominee Donald Trump.
The recent “Gold premium” has moved in synch with the betting odds of Trump winning the ticket to the White House in the past two weeks as Trump’s odds steadily increased and hit a recent peak on 15 July before it slipped. Interestingly, that was two days before Gold (XAU/USD) hit its US$2,484 current fresh all-time high on 17 July.
According to data from RealClear Politics, the average betting odds for Trump have slipped from a high of 66% on 15 July to 55% at this time of the writing. In contrast, the odds of the unofficial Democrat presidential nominee Harris have risen to 36% from 7% over the same period; indicating that the betting market thinks Harris is likely to be a tougher challenger for Trump, in turn, reduces the odds of Trumponomics 2.0 in November.
This direct correlation of Gold (XAU/USD) with Trump winning the US Presidential Election has been driven by his preferred fiscal policies of steep corporate tax cuts (a part of Trumponomics) which in turn is likely to widen the US budget deficit that faces the risk of another round of credit downgrade on US Treasuries by rating agencies. Hence, that’s a positive for Gold (XAU/USD), acting as a hedge in times of fiscal dominance that may lead market participants to question the credit standing and solvency of the US government.
Right now, given that the outcome of the US Federal Reserve monetary policy meeting is around the corner next Wednesday, 31 July, the focus will return to the US Treasury market (US politics taking a beat seat till October) which will be likely influenced by the latest monetary policy stance of the US Fed that can impact the prices of Gold (XAU/USD) in the next two weeks via the “opportunity cost” factor.
10-year US Treasury real yield remains below 2.00%
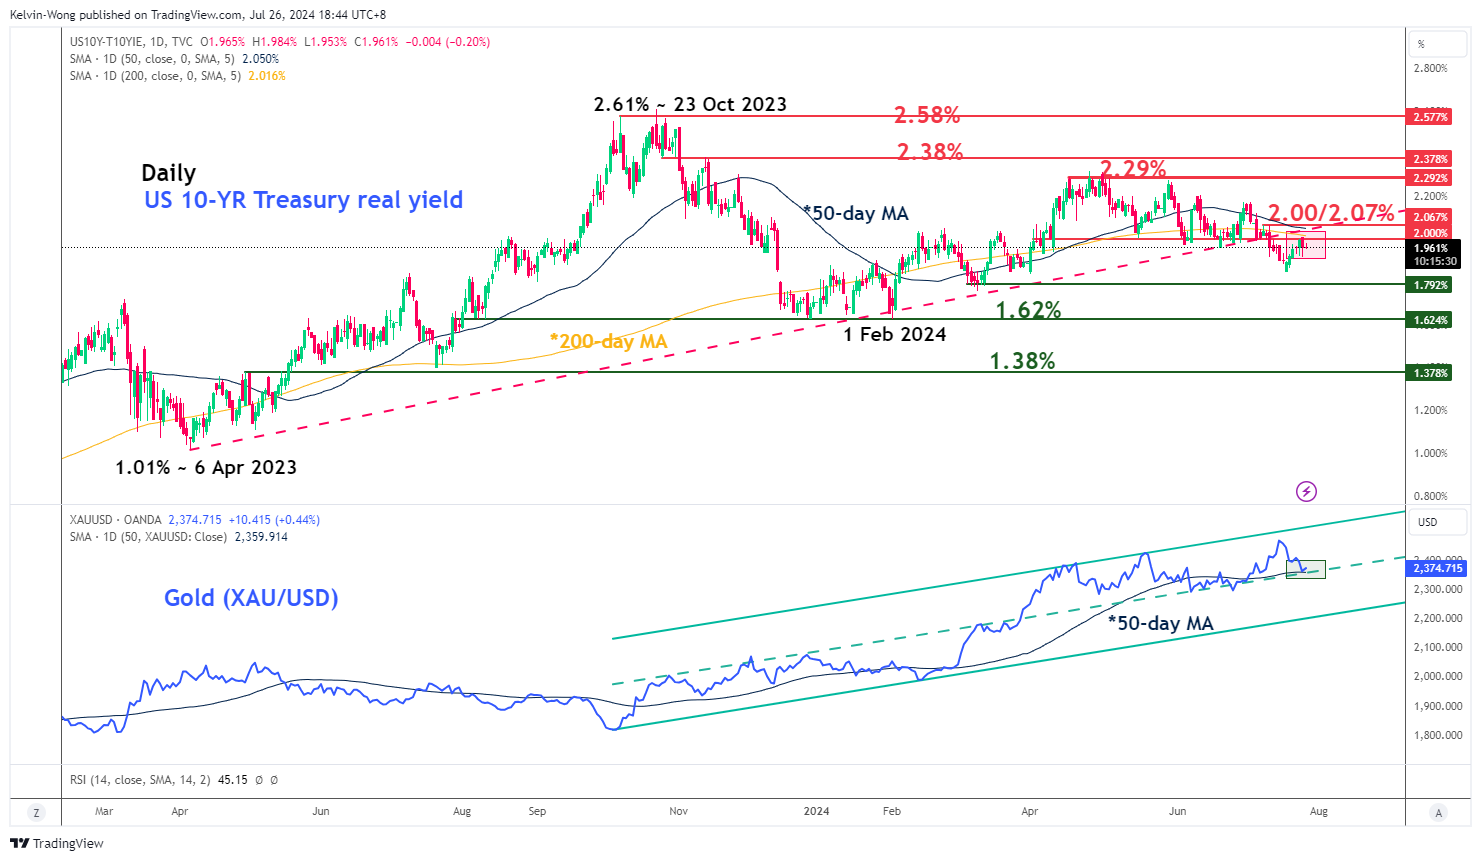
Fig 1: US 10-YR Treasury real yield major & medium-term trends as of 26 Jul 2024 (Source: TradingView, click to enlarge chart)
Based on the latest data from the CME FedWatch tool at this time of the writing, the Fed Funds rate futures market has priced in a high odd (89% chance) that the Fed is likely to enact its first interest rate cut of 25 bps on the 18 September FOMC follow by two more cuts of 25 bps each in November (76% chance) and December (66% chance) meetings.
Hence, market participants are now anticipating the start of an interest rate cut cycle rather than the Fed keeping interest rates at a higher level for an extended period. The odds of an interest rate cut cycle kicking off in the US in the near-term horizon are likely to increase if today’s core PCE inflation data for June comes in within or below expectations of 2.5% y/y, a dip from 2.6% y/y in May which indicates a clear path of deceleration in US inflationary trend.
Interestingly, the US Treasury market has painted a potential softer US inflationary trend picture ahead of the US PCE data release. The 10-year US Treasury real yield has shaped a bearish reaction right below a key intermediate resistance zone of 2.00%/2.07% that also confluences with the 50-day and 200-day moving averages that capped price actions since 11 July.
Yesterday’s dip in the 10-year US Treasury real yield has caused the recent price drop in Gold (XAU/USD) to stabilize right at its 50-day moving average and the median line of the medium-term ascending channel in place since the October 2023 low (see Fig 1).
Watch the US$2,386 potential upside trigger level for Gold
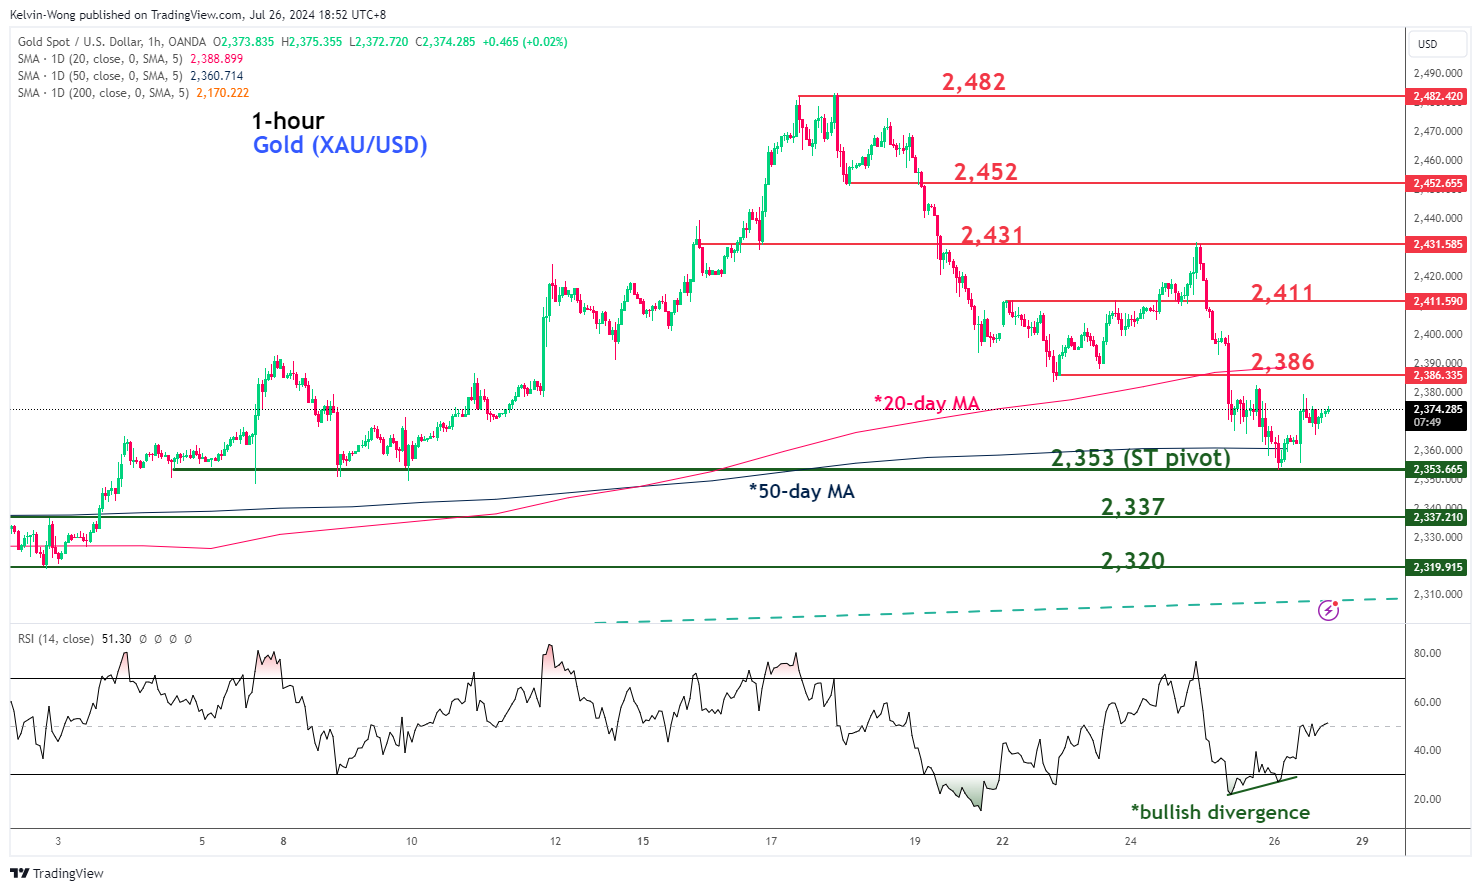
Fig 2: Gold (XAU/USD) short-term trend as of 26 Jul 2024 (Source: TradingView, click to enlarge chart)
Through the lens of technical analysis, the recent sell-off in Gold (XAU/USD) may have reached a bearish exhaustion inflection level at the US$2,353 short-term pivotal support (also the 50-day moving average).
Reinforced by the bullish divergence condition seen on the hourly RSI momentum indicator at its oversold region, a clearance above US$2,386 near-term resistance (potential upside trigger level) may see the next intermediate resistances to come in at US$2,411 and US$2,431 in the short-term horizon (see Fig 2).
However, failure to hold at US$2,353 is likely to see the extension of the corrective decline to expose the next intermediate supports at US$2,337 and US$2,320 in the first step.
Oil Price Reversal Ahead? Chart Patterns Indicate Possible Bounce at Support
- Oil prices have faced challenges recently, but buying pressure prevented a drop below $80.
- Technical indicators suggest potential for an upward bounce, with key resistance levels to watch.
- Fundamental factors like Canadian wildfires, US stockpiles, and rate cut expectations support oil prices.
Oil prices faced challenges yesterday until buying pressure during the US session prevented crude oil from dropping below the psychological 80.00 mark.
Currently, oil is on track for a third consecutive week of losses unless bullish momentum persists through Friday, which could result in oil finishing the week flat or with slight gains.
WTI losses have outpaced Brent this week, this could in part be down to output fears in Canada exerting downward pressure on WTI. Wildfires in Canada have led some producers to reduce production at a time of peak demand in both the US and Canada.
The drop of 8.1% in Chinese oil demand in June to 13.66 million bpd spooked market participants and brought growth concerns to the fore. The Chinese authorities did slash interest rates this week in a bid to ensure the economic targets set by the Government are reached.
In the Middle East, hopes for a ceasefire are growing despite ongoing tit-for-tat attacks between Israel, Hezbollah, and the Houthis in Yemen. On Friday morning, leaders from Australia, New Zealand, and Canada issued a joint statement calling for an immediate ceasefire. Such a ceasefire could help ease fears of a broader conflict, which could have significant implications for oil prices and supply chains.
Later in the day we have the US PCE data release which could stoke some short-term volatility and may be worth paying attention to.
Technical Analysis Oil
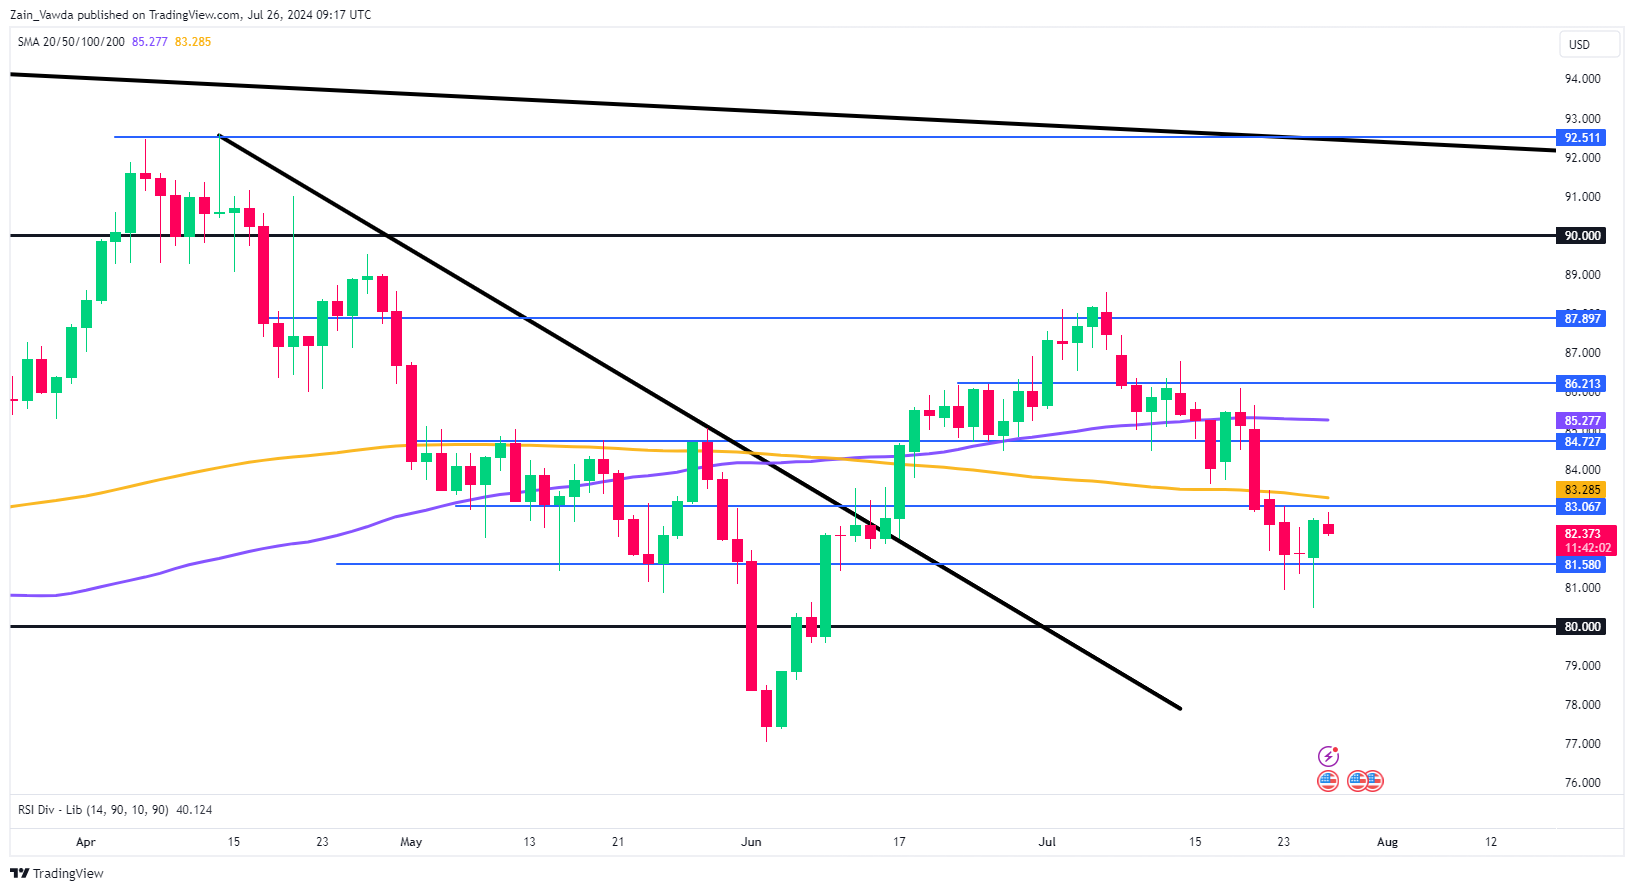
From a technical perspective, Brent appeared poised to test the 80.00 per barrel psychological mark. However, buying pressure during the US session yesterday around the 80.50 level pushed Brent prices back above the key resistance level at 81.58.
The daily candle closed with a hammer candlestick pattern, engulfing the previous two daily candles. Theoretically, this suggests further upside potential, though it will face several obstacles if Brent is to revisit its early July high around 88.552.
A move higher will need to overcome the confluence area around 83.00, where the 200-day moving average currently lies. A daily candle close above these hurdles could see Brent aiming for resistance at 84.727, before encountering the 100-day moving average at 85.277.
Conversely, a downward push would require a daily candle close below the 81.580 support level, opening the possibility of a move toward the 80.00 mark and potentially down to the recent lows around the 77.00 handle.
On the fundamental side, oil price fundamentals still seem supportive. Factors such as the Canadian wildfires affecting production, declining US stockpiles, and rate cut expectations are all providing support. Additionally, interest rate cuts in China might be seen as positive for oil prices and may not yet be fully priced in.
Brent Oil Chart, July 26, 2024
Source: TradingView (click to enlarge)
Support
- 81.58
- 80.00
- 77.00
Resistance
- 83.06
- 84.72
- 86.21
XAU/USD Outlook: Gold Edges Higher from Daily Cloud Top as Markets Await Release of US Data
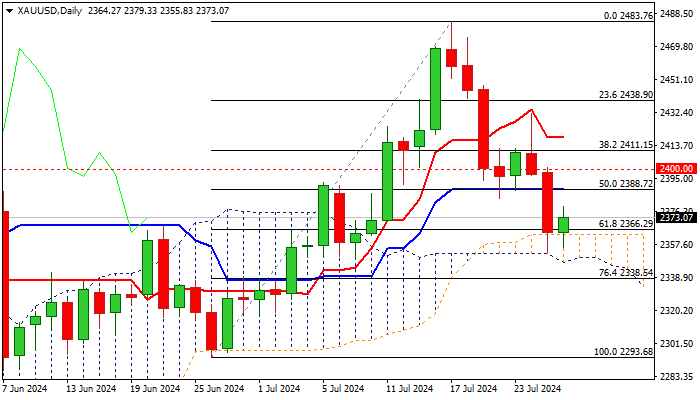
Gold price rose on Friday, as traders collected some profits from sharp fall in past two days (down nearly 3%), with strong acceleration lower on Thursday being sparked by upbeat US Q2 GDP numbers.
Strong technical support, provided by the top of daily Ichimoku cloud, repeatedly contained attacks, keeping the downside protected for now.
Initial signs of recovery come from fresh positive momentum and oversold stochastic on daily chart, with near term action being underpinned by daily cloud however, more work at the upside will be needed to improve the outlook and verify positive signal.
Bulls need to clear $2390/$2400 zone (20DMA / psychological) to signal a higher base ($2554) to spark recovery continuation and shift near-term focus higher.
On the other hand, gold is on track for the second consecutive weekly loss, with weakening weekly studies, likely to keep the downside vulnerable.
US PCE data (due later today) mark Fed’s key inflation measure and expected to provide more details about the start of rate cutting cycle by the US central bank, which is expected to generate fresh direction signal for the yellow metal.
Res: 2379; 2390; 2400; 2413.
Sup: 2363; 2347; 2338; 2324.
USD/CAD Rally Pauses: Awaiting Next Correction
The USD/CAD pair ended its continuous upward trend on Friday, 26 June 2024, settling around 1.3813, signalling a potential shift towards correction.
The Bank of Canada decided to lower the interest rate from 4.75% p.a. to 4.50% p.a. at its meeting this week. Overall, the tone of the Canadian regulator's remarks has changed. The Bank of Canada expects the economy to grow by 1.2% this year versus the previous forecast of 1.5%. Expectations for 2025 and 2026 were adjusted to 2.1% and 2.4% from 2.2% and 1.9%.
Inflation forecasts were also changed. By the end of 2024, the overall consumer price index is expected to fall to 2.6%. Inflation will be 2.4% in 2025 and 2.0% in 2026.
The Bank of Canada is confident that the state of the economy is well positioned for inflation to return to target even if economic activity improves slightly in the second half of this year.
Since 11 July, the CAD has been falling almost nonstop in tandem with the USD. It has only started to correct now that it has reached a three-month low.
USD/CAD technical analysis
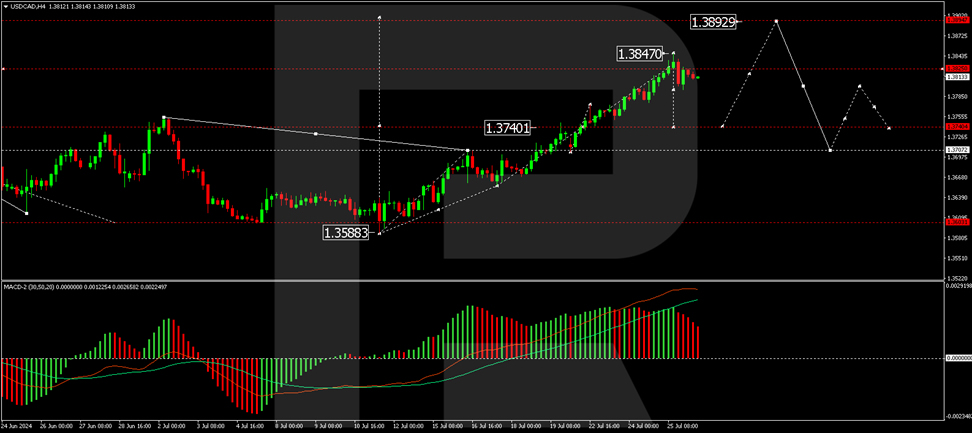
On the H4 chart of USD/CAD, the market has formed a consolidation range around 1.3740 and worked off the local target of the growth wave at 1.3847 in an upward movement. Today, we expect a new consolidation range to form at the current highs. In case of a downside exit, we will consider the probability of correction to 1.3740 (test from above). In case of an upward exit, we will consider the likelihood of the trend's continuation to 1.3892. Technically, this scenario is confirmed by the MACD indicator. Its signal line is at the maximum and is preparing for a decline.
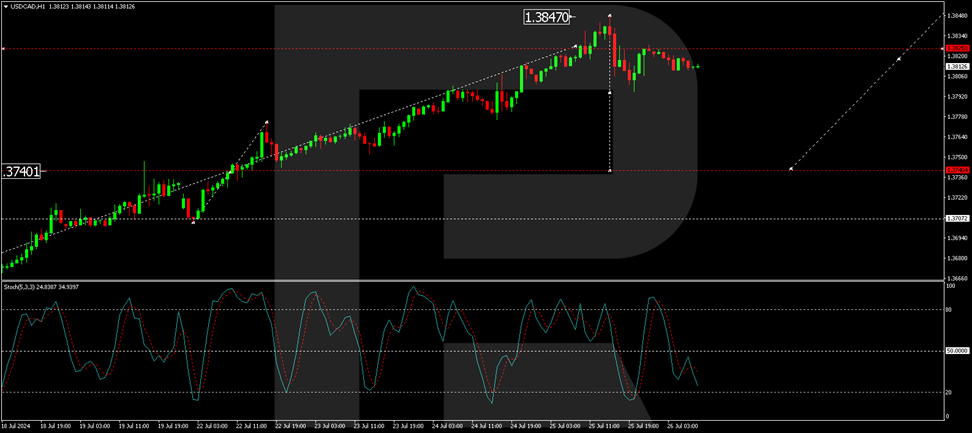
On the USD/CAD H1 chart, the market made a downward impulse to the level of 1.3795 and a correction to the level of 1.3825. The market has practically marked the boundaries of the consolidation range. We expect the exit from this range down to the level of 1.3790. If this level is breached, we will consider the correction wave development to continue to 1.3763. The target is local. Technically, this scenario is confirmed by the Stochastic oscillator. Its signal line is under the mark of 50 and is directed strictly downwards to the level of 20.