Sample Category Title
EUR/GBP Daily Outlook
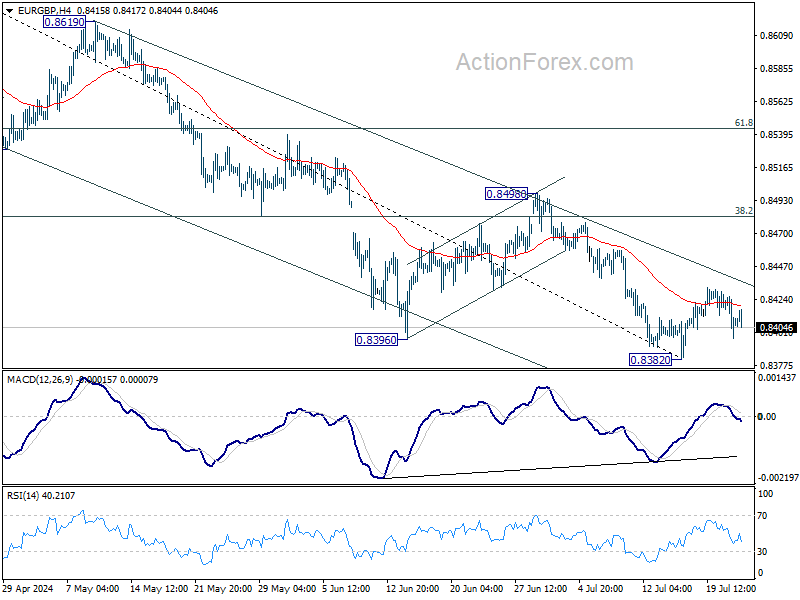
Daily Pivots: (S1) 0.8395; (P) 0.8411; (R1) 0.8424; More....
Intraday bias in EUR/GBP remains neutral as consolidations continue above 0.8382 low. While rebound from 0.8382 could extend higher, outlook will stay bearish as long as 0.8498 resistance holds. Larger down trend should resume through 0.8382 at a later stage.
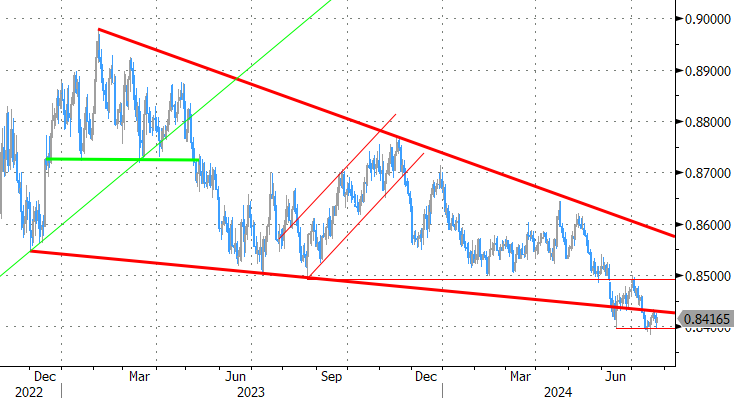
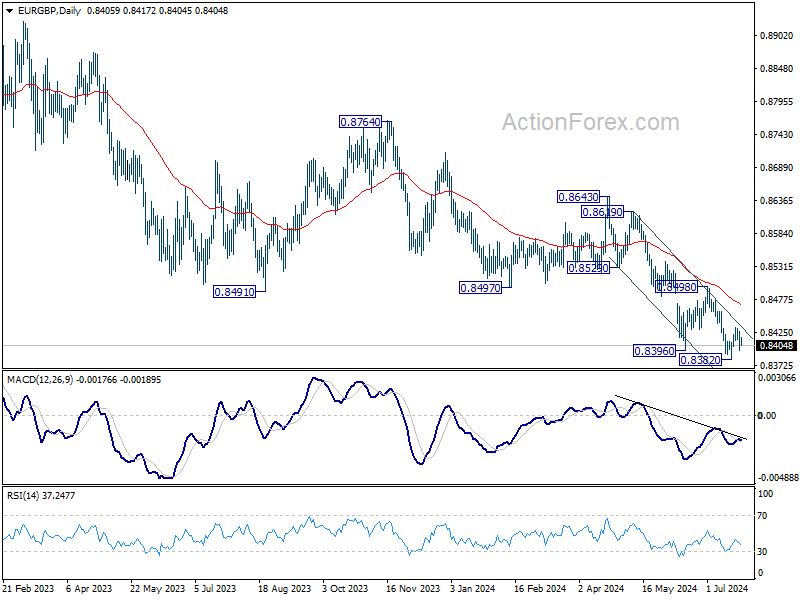
In the bigger picture, down trend from 0.9267 (2022 high) is in progress. Next target is 0.8201 key support (2022 low). For now, outlook will remain bearish as long as 0.8643 resistance holds, even in case of stronger rebound.
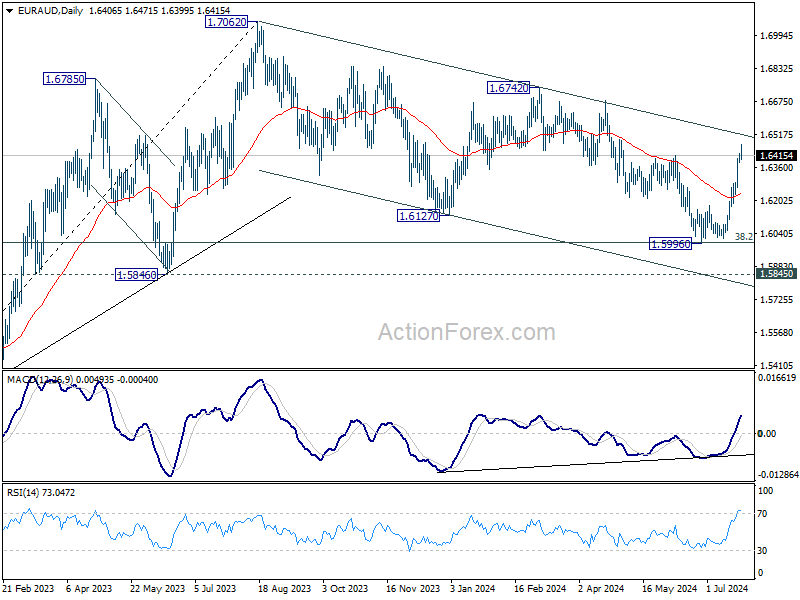
EUR/AUD Daily Outlook
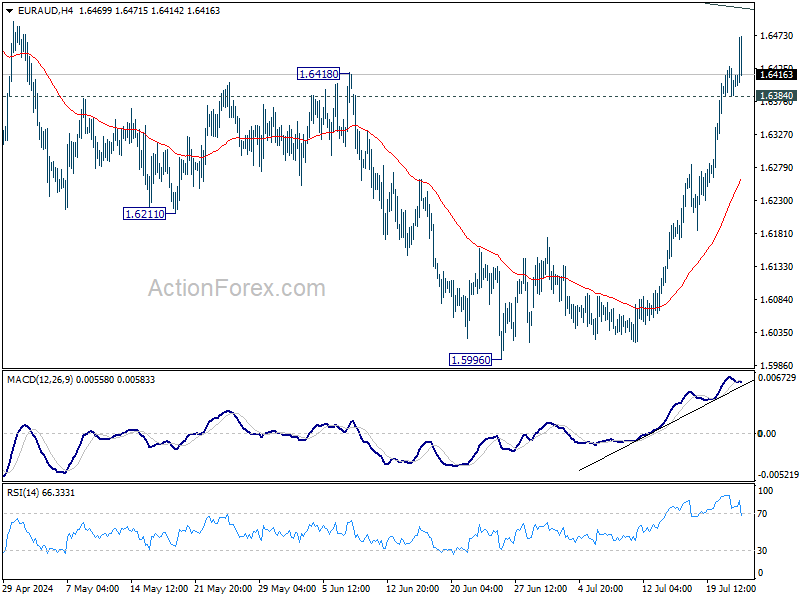
Daily Pivots: (S1) 1.6384; (P) 1.6407; (R1) 1.6428; More...
EUR/AUD's correction from 1.0762 has possibly completed with three waves down to 1.5996, after hitting 1.6000 fibonacci support. Break of 1.6148 resistance affirms this case. Intraday bias stays on the upside for 1.6742 resistance next. On the downside, below 1.6384 minor support will turn intraday bias neutral and bring consolidations first, before staging another rally.
In the bigger picture, fall from 1.7062 medium term top is seen as a correction to the up trend from 1.4281 (2022 low) only. Strong support is still expected between 1.5846 and 38.2% retracement of 1.4281 to 1.7062 at 1.6000 to bring rebound. Break of 1.6742 resistance indicate that the up trend is ready to resume through 1.7062.
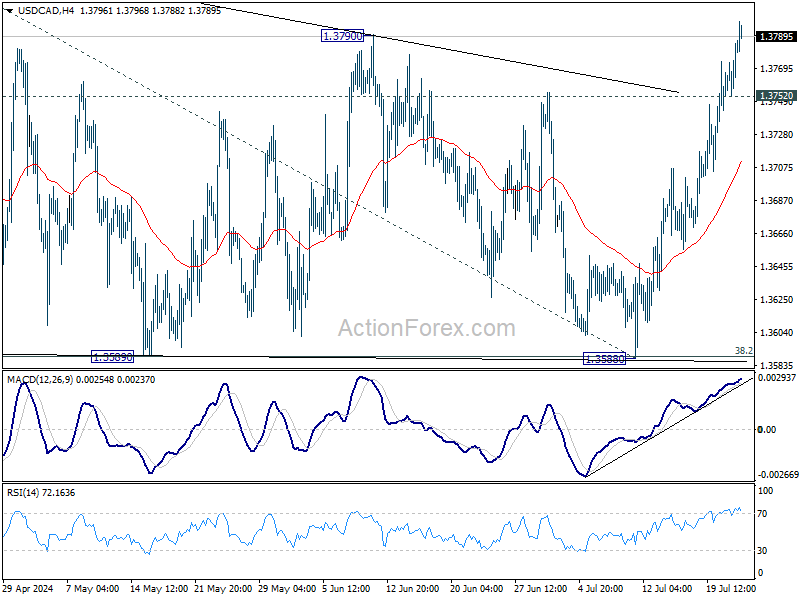
USD/CAD Daily Outlook
Daily Pivots: (S1) 1.3762; (P) 1.3774; (R1) 1.3797; More...
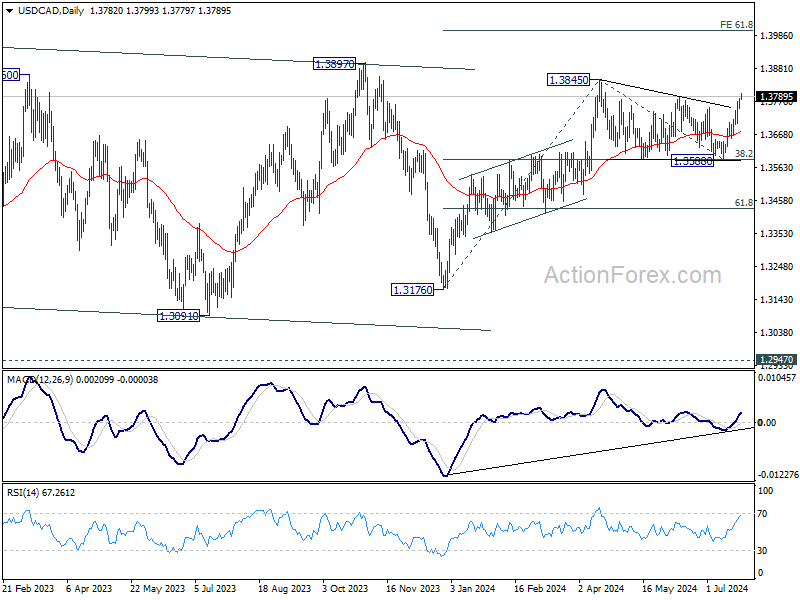
USD/CAD's break of 1.3790 resistance strengthens the case that consolidation from 1.3845 has completed at 1.3588. Intraday bias remains on the upside for retesting 1.3845 high next. Firm break there will resume whole rally from 1.3176 to 61.8% projection of 1.3176 to 1.3845 from 1.3588 at 1.4025. On the downside, below 1.3752 minor support will turn intraday bias neutral and bring consolidations first, before staging another rally.
In the bigger picture, price actions from 1.3976 (2022 high) are viewed as a corrective pattern. In case of another fall, strong support should emerge above 1.2947 resistance turned support to bring rebound. Firm break of 1.3976 will confirm up resumption of whole up trend from 1.2005 (2021 low). Next target is 61.8% projection of 1.2401 to 1.3976 from 1.3176 at 1.4149.
AUD/USD Daily Report
Daily Pivots: (S1) 0.6603; (P) 0.6625; (R1) 0.6637; More...
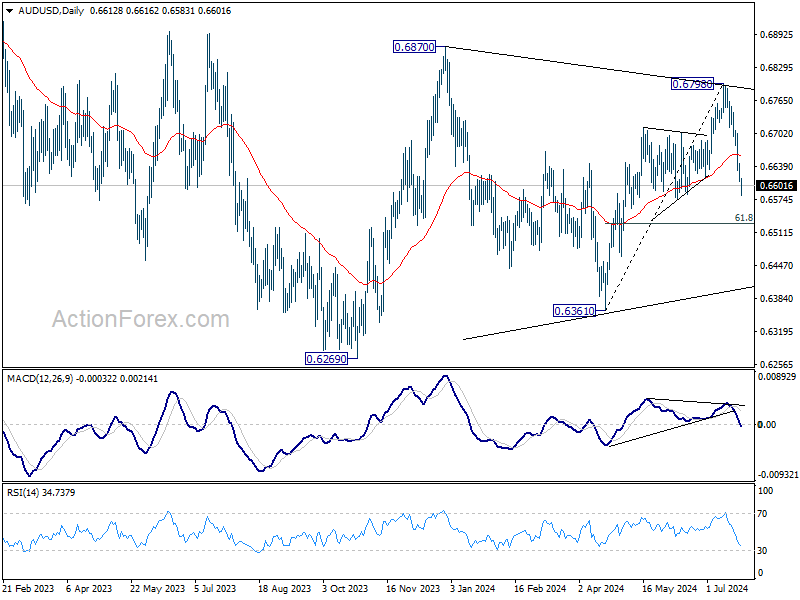
AUD/USD's fall from 0.6798 continues today and intraday bias remains on the downside. Rise from 0.6361 might have completed already. Deeper fall would now be seen to 61.8% retracement of 0.6361 to 0.6798 at 0.6528. On the upside, above 0.6645 minor resistance will turn intraday bias neutral and bring consolidations first, before staging another fall.
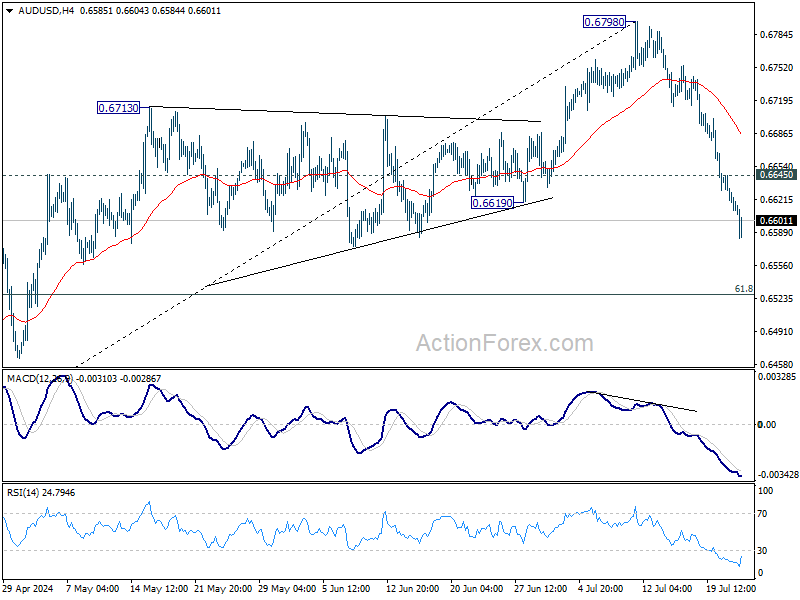
In the bigger picture, overall, price actions from 0.6169 (2022 low) are seen as a medium term corrective pattern, which is still extending. Break of 0.66870 resistance will extend the rising leg from 0.6269 towards 0.7156 (2023 high). However, break firm break of 0.6619 support will argue that another falling leg has started back towards lower side of the range between 0.6169/6361.
EUR/USD Daily Outlook
Daily Pivots: (S1) 1.0832; (P) 1.0865; (R1) 1.0885; More.....
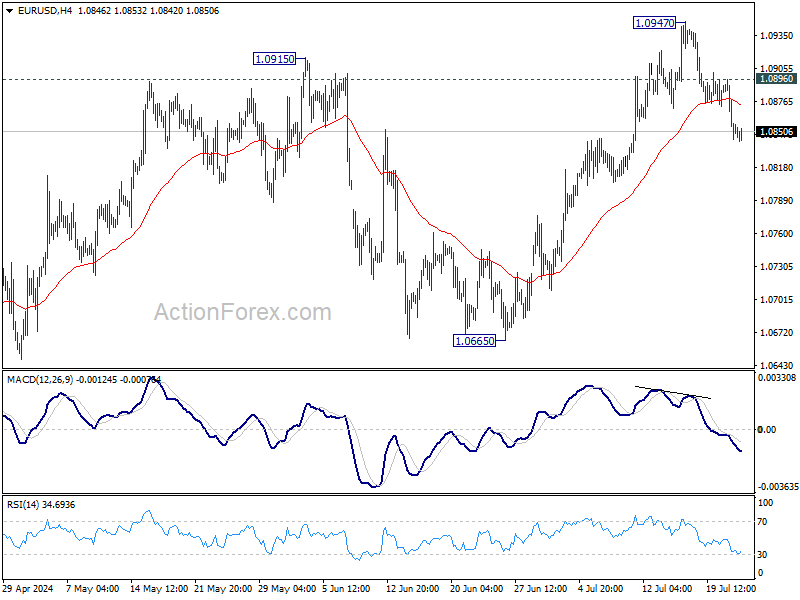
Intraday bias in EUR/USD remains mildly on the downside at this point. Fall from 1.0947 short term top should extend to 55 D EMA (now at 1.0813). Sustained break there will argue that whole rebound from 1.0601 has completed with three waves up to 1.0947, and target 1.0601/0665 support zone. On the upside, above 1.0896 minor resistance will turn intraday bias neutral first. But, risk will stay on the downside as long as 1.0947 resistance holds, in case of recovery.
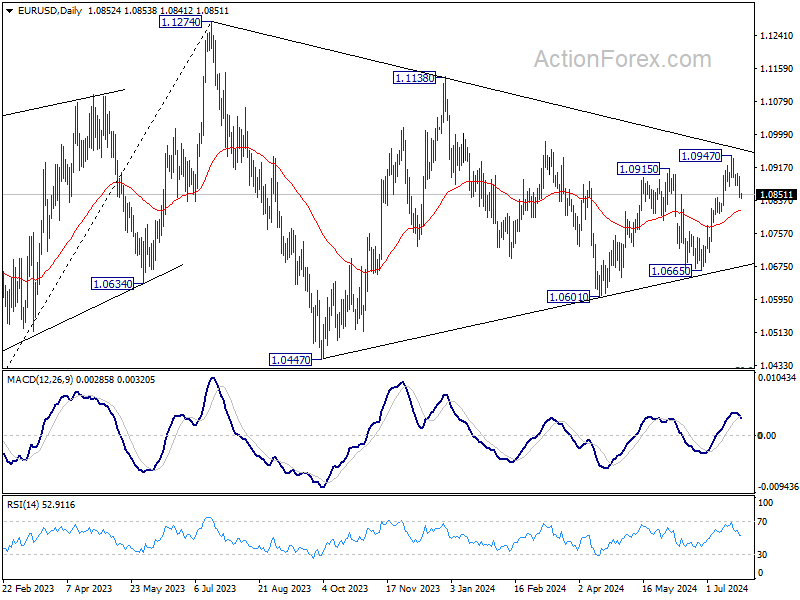
In the bigger picture, price actions from 1.1274 are viewed as a corrective pattern that's still be in progress. Break of 1.1138 resistance will be the first signal that rise from 0.9534 (2022 low) is ready to resume through 1.1274 (2023 high). However, break of 1.0665 support will extend the correction with another falling leg back towards 1.0447 support.
GBP/USD Daily Outlook
Daily Pivots: (S1) 1.2884; (P) 1.2911; (R1) 1.2935; More...
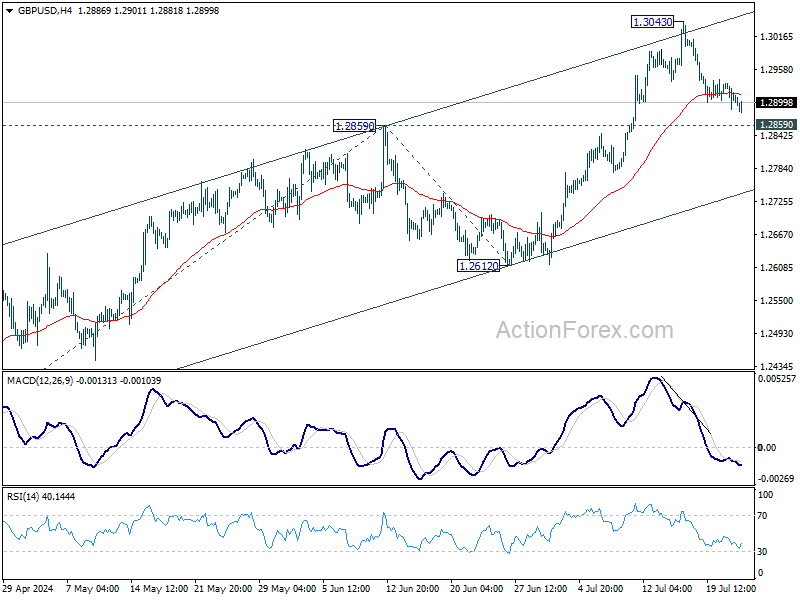
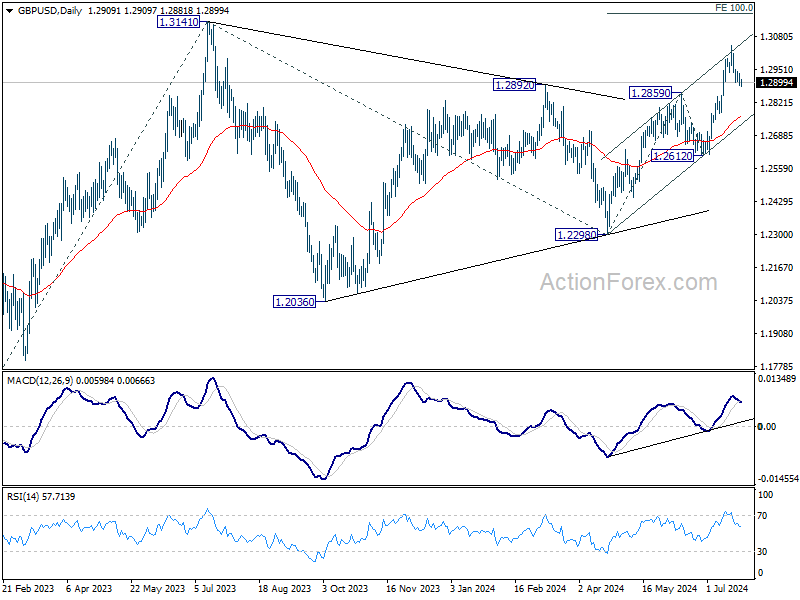
Intraday bias in GBP/USD remains neutral for the moment. Further rally is expected for now. Break of 1.3043 will resume the rise from 1.2298 and target 100% projection of 1.2298 to 1.2859 from 1.2612 at 1.3173, which is slightly above 1.3141 key medium term resistance. However, firm break of 1.2859 will turn bias to the downside for deeper decline.
In the bigger picture, corrective pattern from 1.3141 medium term top (2023 high) could have completed with three waves to 1.2298 already. This will now remain the favored case as long as 1.2612 support holds. Firm break of 1.3141 will target 61.8% projection of 1.0351 (2022 low) to 1.3141 from 1.2298 at 1.4022.
USD/CHF Daily Outlook
Daily Pivots: (S1) 0.8891; (P) 0.8908; (R1) 0.8930; More…
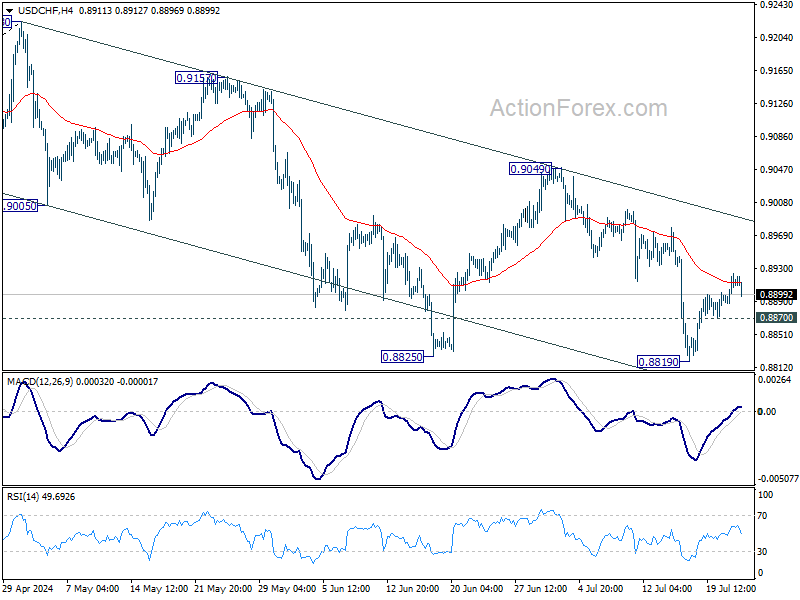
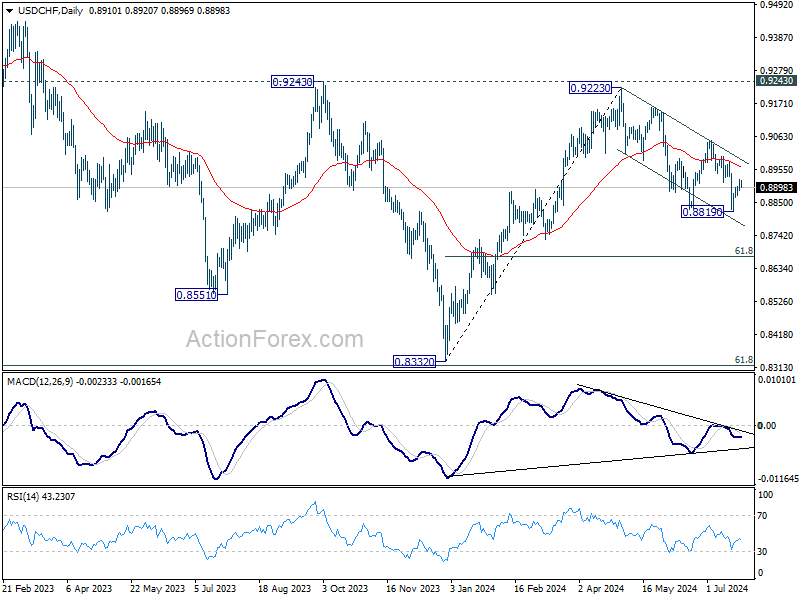
Intraday bias in USD/CHF stays mildly on the upside for the moment. Rebound from 0.8819 short term bottom could extend to 55 D EMA (now at 0.8967) and possibly above. But still, break of 0.9049 resistance is needed to confirm that fall from 0.9223 has completed. Otherwise, risk will stay on the downside for another fall at a later stage. On the downside, below 0.8870 will bring retest of 0.8819 low.
In the bigger picture, with 0.9243 resistance intact, medium term outlook in USD/CHF is neutral at best. For now, more sideway trading is likely between 0.8332/9243. However, firm break of 0.9243 will indicate larger bullish trend reversal.
Market Analysis: EUR/USD Trims Gains While USD/CHF Regains Strength
EUR/USD started a fresh decline below the 1.0900 support. USD/CHF is rising and might aim a move toward the 0.9000 resistance.
Important Takeaways for EUR/USD and USD/CHF Analysis Today
- The Euro struggled to clear the 1.0950 resistance and declined against the US Dollar.
- There is a key bearish trend line forming with resistance at 1.0870 on the hourly chart of EUR/USD at FXOpen.
- USD/CHF is showing positive signs above the 0.8900 resistance zone.
- There is a major bullish trend line forming with support at 0.8910 on the hourly chart at FXOpen.
EUR/USD Technical Analysis
On the hourly chart of EUR/USD at FXOpen, the pair failed to clear the 1.0950 resistance. The Euro started a fresh decline below the 1.0900 support against the US Dollar.
The pair declined below the 1.0875 support and the 50-hour simple moving average. Finally, the pair tested the 1.0840 level. A low was formed at 1.0841 and the pair is now consolidating losses. The pair is showing bearish signs, and the upsides might remain capped.
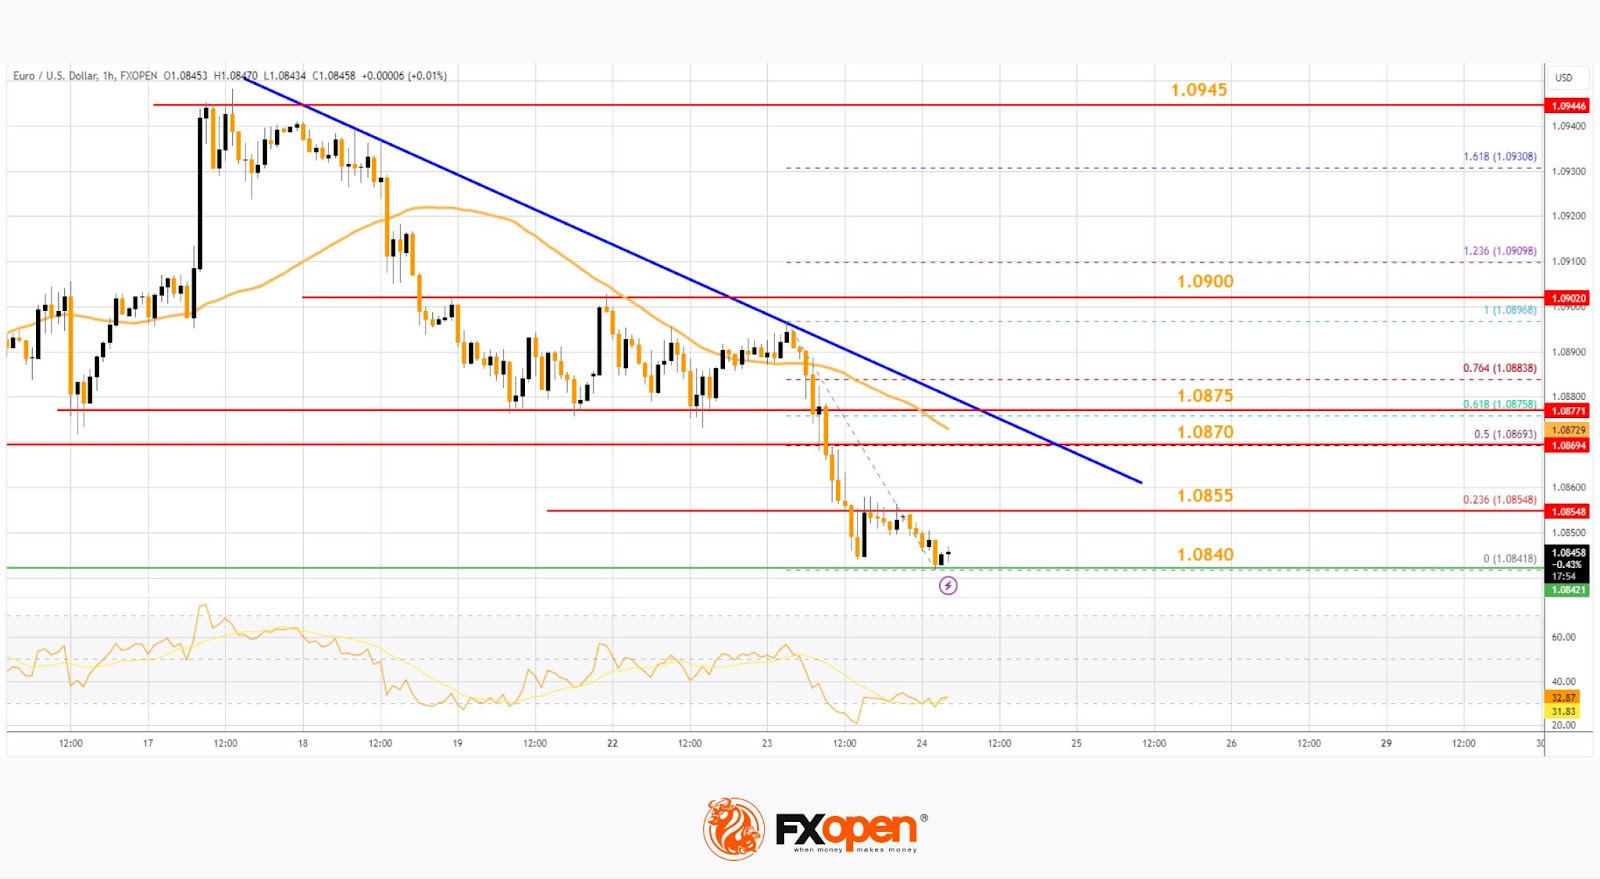
Immediate resistance on the upside is near the 23.6% Fib retracement level of the downward move from the 1.0896 swing high to the 1.0841 low at 1.0855.
The next major resistance is near the 1.0870 zone or the 50-hour simple moving average. It is close to the 50% Fib retracement level of the downward move from the 1.0896 swing high to the 1.0841 low. There is also a key bearish trend line forming with resistance at 1.0870.
An upside break above the 1.0870 level might send the pair toward the 1.0900 resistance. Any more gains might open the doors for a move toward the 1.0950 level.
On the downside, immediate support on the EUR/USD chart is seen near 1.0840. The next major support is near the 1.0810 level. A downside break below the 1.0810 support could send the pair toward the 1.0765 level.
USD/CHF Technical Analysis
On the hourly chart of USD/CHF at FXOpen, the pair started a decent increase from the 0.8820 support. The US Dollar climbed above the 0.8870 resistance zone against the Swiss Franc.
The bulls were able to pump the pair above the 50-hour simple moving average and 0.8900. Finally, the pair tested the 0.8925 zone. A high was formed near 0.8923 and the pair is still showing signs of more upsides. It is testing a major bullish trend line with support at 0.8910.
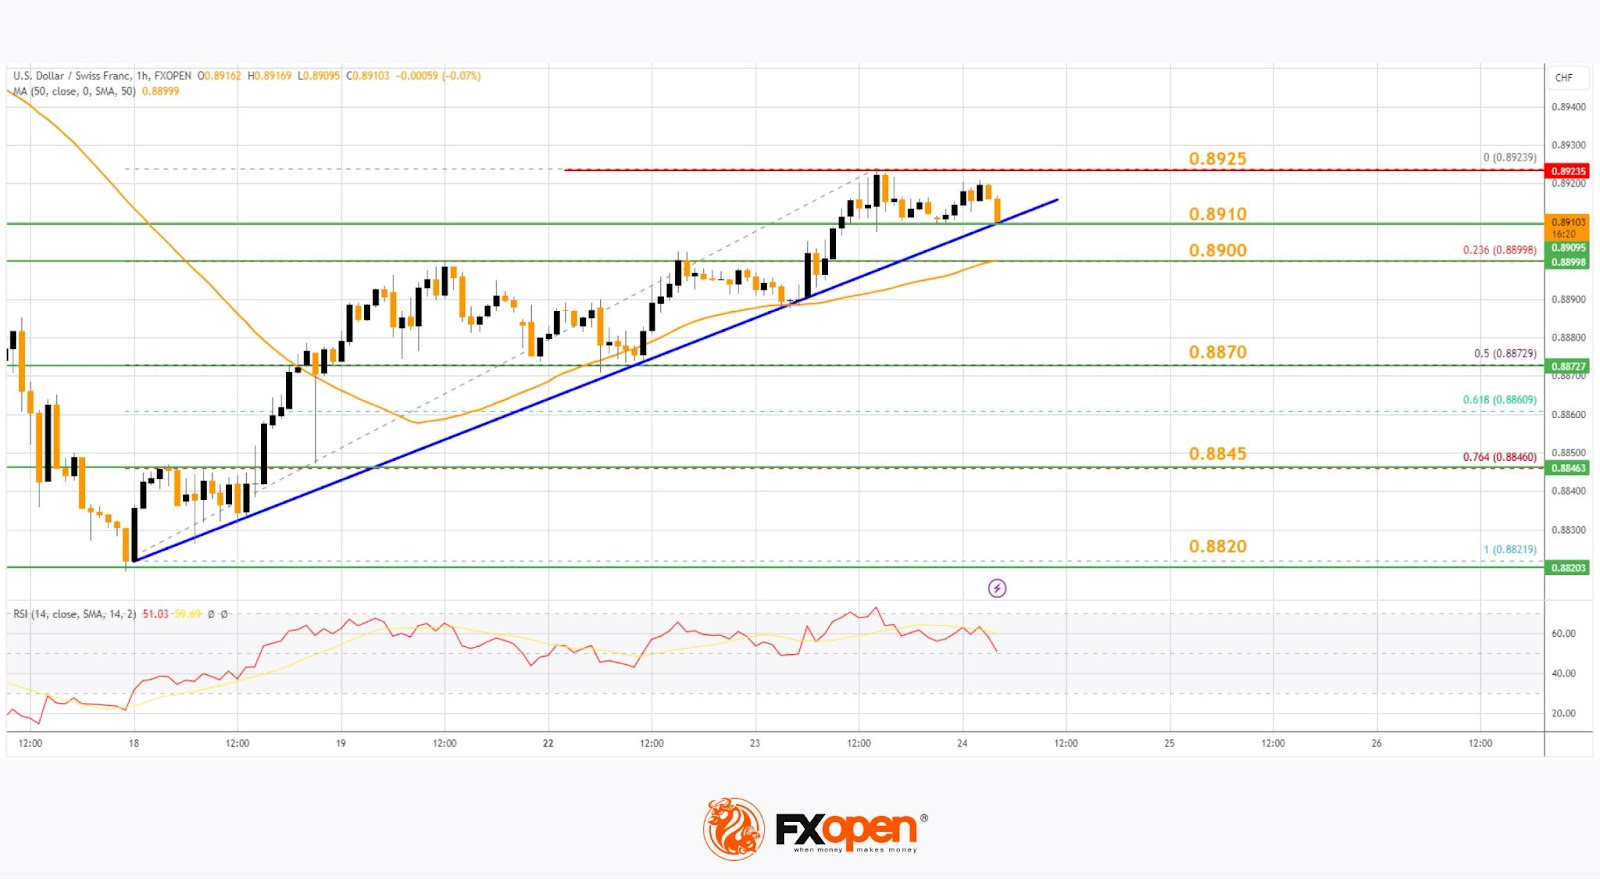
On the upside, the pair is now facing resistance near 0.8925. The next major resistance is at 0.8940. The main resistance is now near 0.8950. If there is a clear break above the 0.8950 resistance zone and the RSI remains above 50, the pair could start another increase. In the stated case, it could test 0.8980.
If there is a downside correction, the pair might test the 23.6% Fib retracement level of the upward move from the 0.8821 swing low to the 0.8923 high at 0.8900.
The first major support on the USD/CHF chart is near the 50% Fib retracement level of the upward move from the 0.8821 swing low to the 0.8923 high at 0.8870. A downside break below 0.8870 might spark bearish moves. The next major support is near the 0.8845 pivot level. Any more losses may possibly open the doors for a move toward the 0.8820 level in the near term.
Trade over 50 forex markets 24 hours a day with FXOpen. Take advantage of low commissions, deep liquidity, and spreads from 0.0 pips. Open your FXOpen account now or learn more about trading forex with FXOpen.
This article represents the opinion of the Companies operating under the FXOpen brand only. It is not to be construed as an offer, solicitation, or recommendation with respect to products and services provided by the Companies operating under the FXOpen brand, nor is it to be considered financial advice.
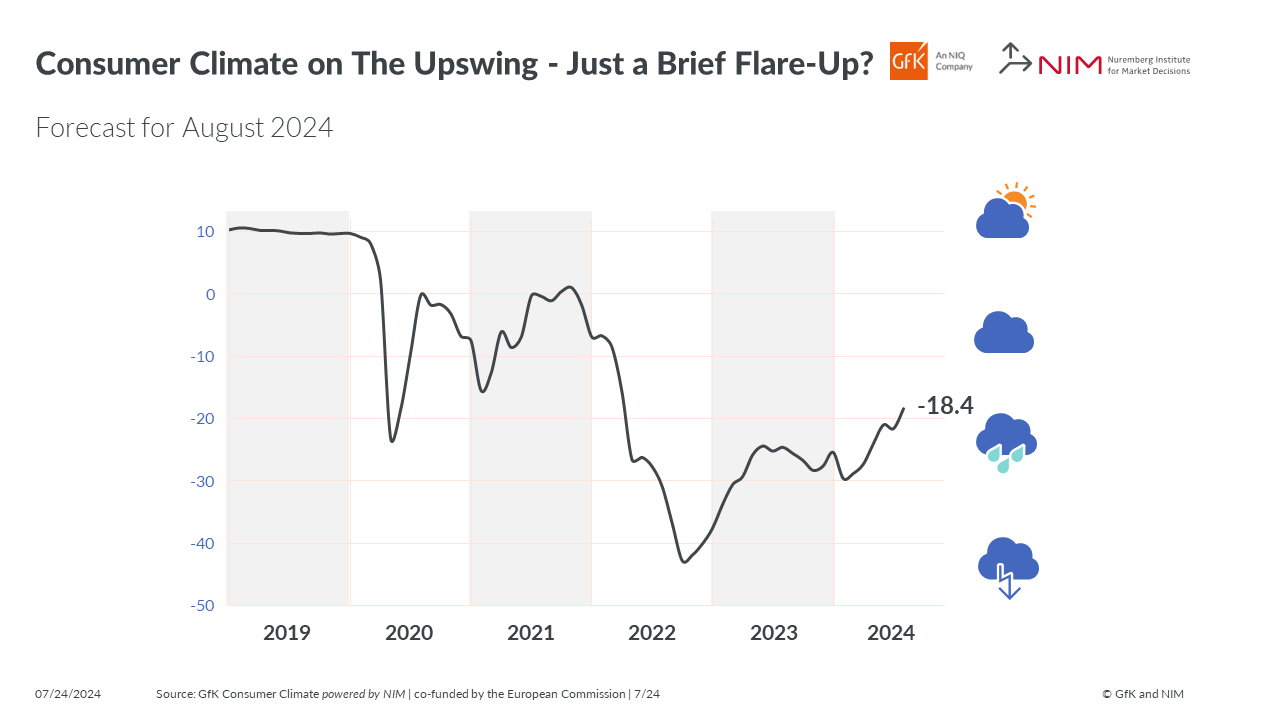
German Gfk consumer sentiment improves to -18.4, driven by income expectations
Germany's Gfk Consumer Sentiment for August rose to -18.4, surpassing expectations of -21.1, and marking an improvement from July's -21.6.
In July, economic expectations jumped from 2.5 to 9.8, and income expectations surged from 8.2 to 19.7, reaching their highest level since October 2021. Willingness to buy also improved, rising from -13.0 to -8.4, while willingness to save slightly decreased from 8.2 to 8.0.
Rolf Buerkl, consumer expert at NIM, attributed this upswing primarily to Germans' increased income expectations. He also noted that the euphoria from the European Football Championship likely contributed to the positive sentiment.
However, Buerkl cautioned that it remains to be seen whether this effect is sustainable or just a "short-term flare-up." He warned that if this good mood fades quickly, the path out of low consumption could be "long and demanding."
Yen Extends Its Comeback Supported by strong Japan Jibun Services PMI
Markets
In a session with few important data core bonds remained well bid, Bunds outperforming Treasuries. German yields declined between -11.6 bps (2-y, benchmark change) and -4.5 bps (30-y) in a bull steepening move. Investors apparently stay confident that the ECB will able to continue its easing cycle as of September even as June EMU inflation data showed disinflation, especially core inflation, proceeds only very gradually (if any). ECB’s de Guindos indicated that inflation might hover at current levels for the remainder of this year, but he sees all measures of underlying inflation coming down which should result in disinflation continuing next year. He also saw signs of moderation in wage increases. He evidently didn’t commit on a rate cut timing, but indicated that new projections available at the September meeting will provide a good opportunity to reassess the monetary policy stance. The US yield curve also steepened slightly with the 2-year declining 2.6 bps and the 30-y gaining 1.2 bps. A $69 bln US 2-y Note auction attracted solid investor buying interest (bid-cover 2.81). US equities struggled to find a clear direction (S&P 500 -0.16%) looking forward to earnings of Alphabet and Tesla. Earnings disappointed markets with futures declining after the close. The dollar extended its comeback against the likes of the euro (EUR/USD close 1.0854 from 1.089) or the Aussie dollar (currently 0.66 area). The yen still outperformed the greenback (close 155.6).
Sentiment in Asia this morning turned further risk-off in the wake of yesterday’s WS tech earnings. US yields decline (marginally). The yen extends its comeback (USD/JPY 154.75) supported by a strong Japan Jibun Services PMI (53.9 from 49.4). Later today, investors will also look out for the July PMI’s in the US, EMU and the UK. Last month, US PMI’s painted a more favourable picture compared to the ISM’s. For July, the US composite PMI is expected at a still strong 54.2 (from 54.8). In current market momentum, we see (interest) markets giving more weight to a downward surprise rather than to a strong figure. The EMU composite PMI is expected unchanged at 50.9. After the ‘France-driven’ decline last month, maybe there is room for a small rebound. We don’t expect that to change markets’ expectations the ECB rate path but if so, it might slow the recent EUR/USD setback. A better UK PMI post the elections (if so, composite expected 52.6) also might trigger a new EUR/GBP test of the 0.84 barrier.
News & Views
Fitch kept Canada’s rating unchanged at AA+ with a stable outlook yesterday. The rating agency hailed the strong governance, high per-capita income and a macroeconomic policy framework that has delivered steady growth and generally low inflation. A high, albeit falling, public debt burden counterbalances these strong credit fundamentals somewhat. The agency expects deficits to rise to 1.5% of GDP this year. While seen narrowing to 1.4% and 1% and the years after, they are still materially higher than the pre-pandemic levels . After peaking at 108.7% in 2020, Fitch forecasts the debt ratio at 84.5% this year and 83.4% in 2026. While significantly above the AA median of 49.4%, it is “somewhat mitigated by substantial assets, including national pension assets equal to 27% of GDP in 2024.” Growth should improve from 1% last year towards 1.5% in 2025 and 2026. Fitch singled out a downturn in the US or new tariff (increases) as downside risks. In terms of monetary policy, Fitch believes the central bank will cut another three times this year to 4% with a terminal rate of 2.5% end 2026. The Bank of Canada has the occasion to do so later today. A 25 bps rate cut to 4.5% is almost fully priced in by markets.
The Hungarian central bank (MNB) cut the policy rate by 25 bps yesterday to 6.75%. The unanimous decision was no major surprise in the wake of softer-than-expected June inflation numbers and deputy governor Virag comments afterwards. CPI came in at 3.7%, within the MNB’s tolerance band (3% +/- 1 ppt) where it is expected to stay in the next several months. Core inflation (4.1%), however, will rise towards 5% by year’s end, warranting a cautious and data-driven approach to monetary policy. Volatility in international investor sentiment, i.e. HUF stability, is an additional important reason. The forint in the run-up to the meeting already gave its blessing for a cut strengthening below EUR/HUF 390 for the first time since early June. The currency did lose some marginal ground in the wake of the decision though (EUR/HUF close at 390.26). Virag in the presser said market bets for one to two more rate cuts this year is realistic.
Graphs
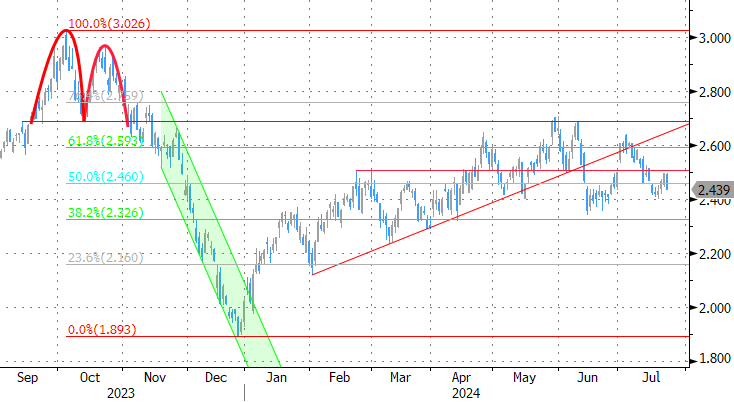
GE 10y yield
The ECB cut its key policy rates by 25 bps at the June policy meeting. A more bumpy inflation path in H2 2024, the EMU economy gradually regaining traction and the Fed’s higher for longer US strategy make follow-up moves difficult. Markets are coming to terms with that. Meanwhile, much of the save haven bids were reversed after the (first round in) the French elections. The 2.34%-2.4% support zone looks solid.
US 10y yield
The Fed indicated that it needs more evidence to lower its policy rate. June dots suggested one move in 2024 and four next year. Disappointing ISM and back-to-back downward CPI surprises put the US money market back on (at least) two rate cuts this year (September/December). The US 10-yr yield tests the recent lows and the downside of the downward trend channel in the 4.2% area.

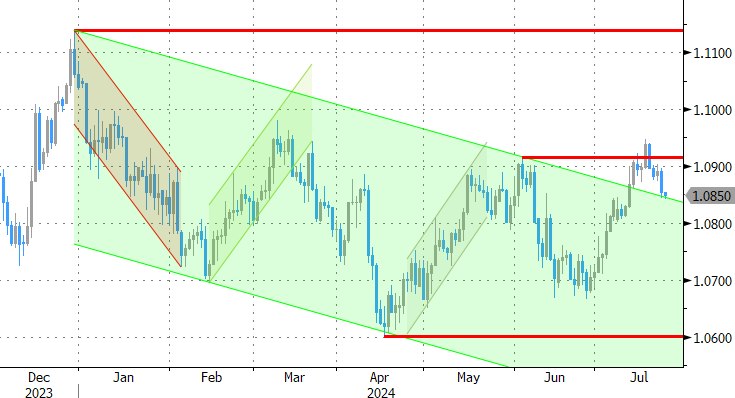
EUR/USD
EUR/USD is testing the topside of the 1.06-1.09 range as the dollar loses interest rate support at stealth pace. Markets consider a September rate cut a done deal and only need confirmation from high-ranked Fed officials. In the meantime, the euro got rid of the (French) political risk premium. Risks of a topside break have increased, bringing the psychologic 1.10 and the December 2023 top at 1.1139 on the radar.
EUR/GBP
Debate at the BOE is focused at the timing of rate cuts. May headline inflation returned to 2%, but core measures weren’t in line with inflation sustainably returning to target any time soon. Still some BoE members at the June meeting appeared moving closer to a rate cut. Labour has yet to reveal its policy plans after securing a landslide election victory. EUR/GBP 0.84 support is being tested.