Sample Category Title
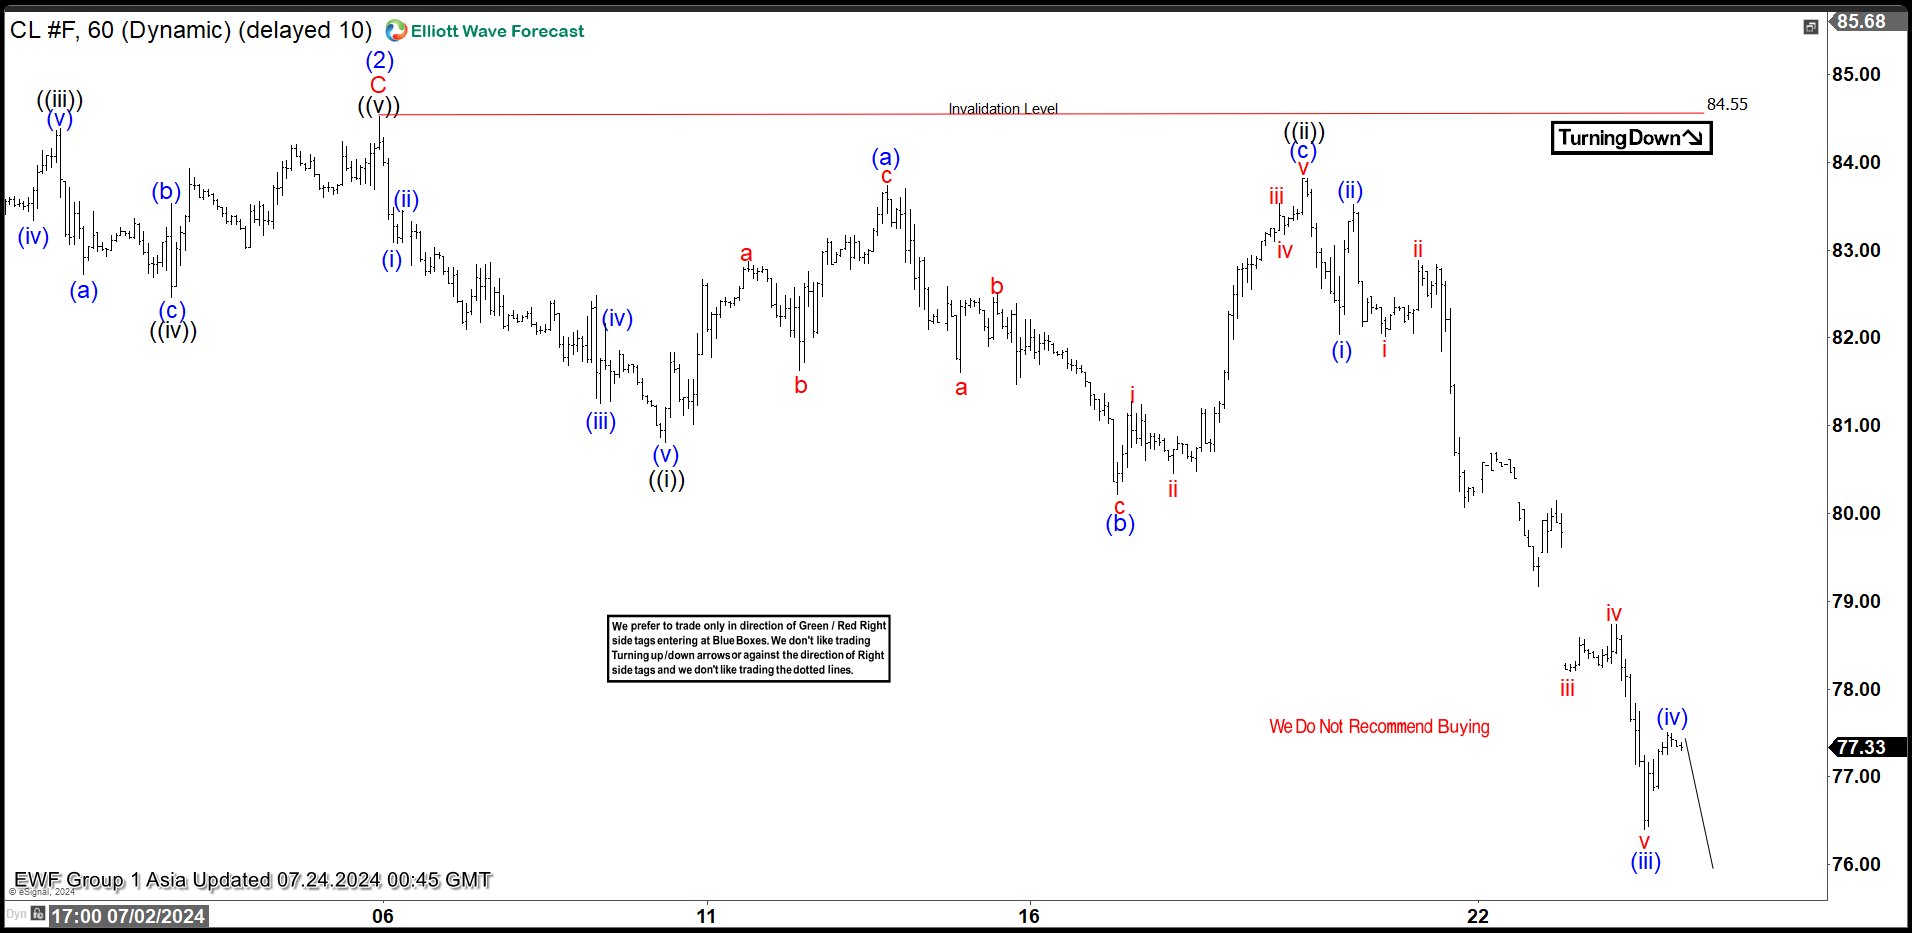
Oil (CL) Turning Lower in Elliott Wave Impulsive Structure
Short Term Elliott Wave View in Oil (CL) suggests that cycle from 4.12.2024 high is in progress as a 5 waves impulse Elliott Wave structure. Down from 4.12.2024 high, wave (1) ended at 72.48 and rally in wave (2) ended at 84.55. The commodity has turned lower in wave (3) with internal subdivision as another impulse in lesser degree. Down from wave (2), wave (i) ended at 83.07 and rally in wave (ii) ended at 83.45. Oil then extended lower in wave (iii) towards 81.25 and wave (iv) ended at 82.16. Final leg wave (v) ended at 80.81 which completed wave ((i)) in higher degree. Wave ((ii)) unfolded in an expanded flat structure where wave (a) ended at 83.74. Wave (b) lower ended at 80.22, and rally in wave (c) ended at 83.82 which completed wave ((ii)).
Oil has turned lower in wave ((iii)). Down from wave ((ii)), wave (i) ended at 82.04 and rally in wave (ii) ended at 83.52. It then resumed lower in wave (iii) towards 76.40 and rally in wave (iv) ended at 77.51. Expect further downside to complete wave (v) of ((iii)), then it should rally in wave ((iv)) before it resumes lower again. Near term, as far as pivot at 84.55 high stays intact, expect rally to fail in 3, 7, or 11 swing for further downside.
Oil (CL) 60 Minutes Elliott Wave Chart
CL Elliott Wave Video
https://www.youtube.com/watch?v=giRRqTRuepc
Bitcoin Perfectly Reacting Higher From Elliott Wave Blue Box Area
In this technical blog, we will look at the past performance of the Daily Elliott Wave Charts of Bitcoin ticker symbol: $BTCUSD. We presented to members at the elliottwave-forecast. In which, the rally from the 21 November 2022 low is unfolding as an impulse structure. Showing a higher high sequence favored more upside extension to take place. Therefore, we advised members not to sell the crypto & buy the dips in 3, 7, or 11 swings at the blue box areas. We will explain the structure & forecast below:
Bitcoin Daily Elliott Wave Chart From 6.30.2024
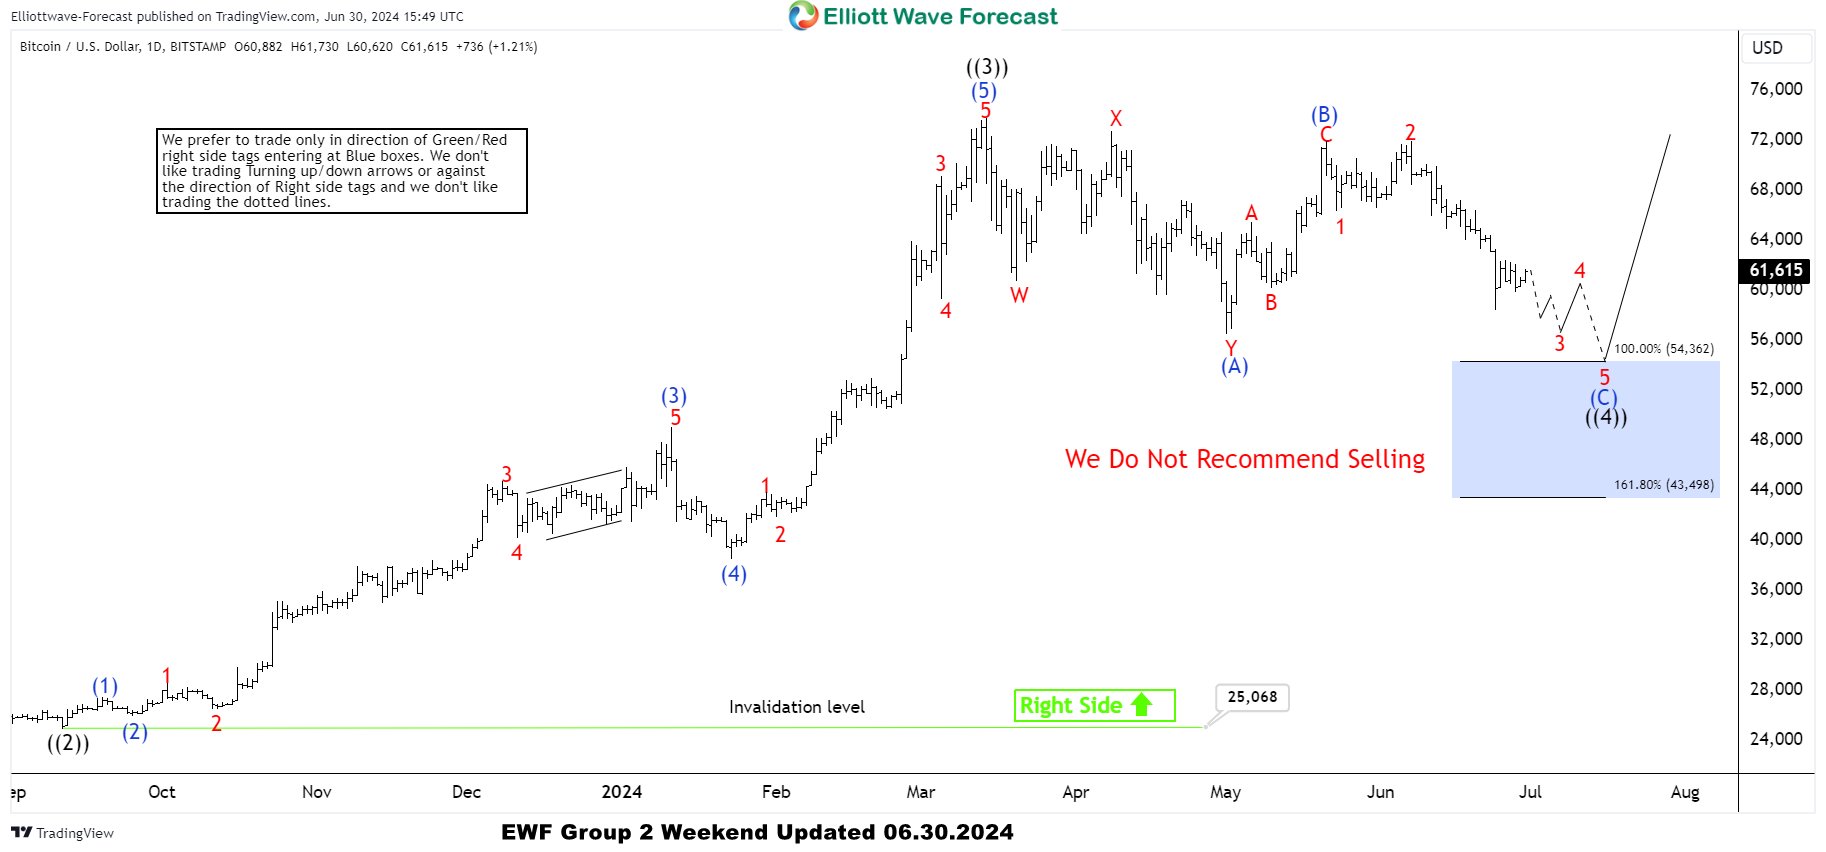
Here’s the Daily Elliott wave chart from the 6.30.2024 weekend update. In which, the cycle from the 9.11.2023 low ended in wave ((3)) at $73794 high. Down from there, the BTCUSD made a pullback in wave ((4)) to correct that cycle. The internals of that pullback unfolded as Elliott wave flat structure where wave (A) ended at $56500 low. Wave (B) bounce ended at $71958 high and wave (C) managed to reach the blue box area at $54362- $43498. From there, buyers were expected to appear looking for the next leg higher or for a 3 wave bounce minimum.
BTCUSD Latest Daily Elliott Wave Chart From 7.21.2024
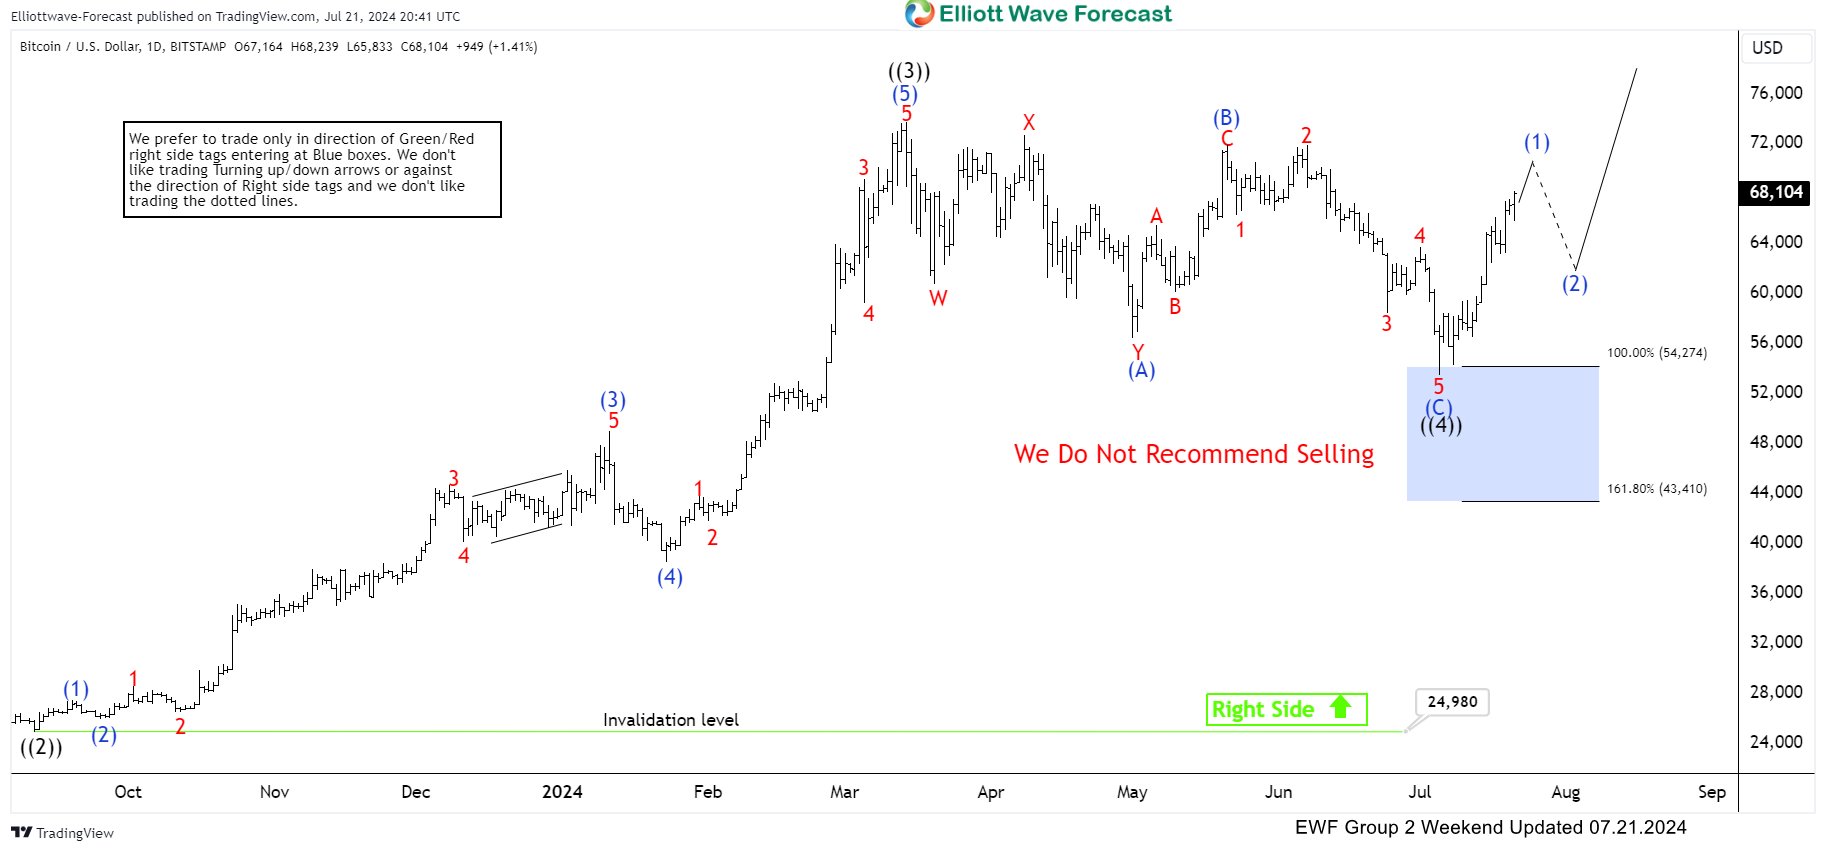
This is the latest Daily Elliott wave Chart from the 7.21.2024 update. In which the Bitcoin is showing a reaction higher taking place, right after ending the flat correction within the blue box area. Allowed members to create a risk-free position shortly after taking the long position at the blue box area. However, a break above $73794 high is still needed to confirm the next extension higher towards $78616- $86338 & avoid a double correction lower.
The First View on Big Tech Earnings Wasn’t Inspiring
The first view on Big Tech earnings wasn’t inspiring. Tesla’s earnings missed estimates for the 4th consecutive quarter as revenue from car sales declined 7%. The company’s energy generation and storage revenue doubled and services revenue rose 21%, but the latter couldn’t make up for the EV sales decline. As a result, Tesla earned $1.48bn in Q2, down from $2.7bn a year earlier, and lower than the $1.69bn income penciled in by analysts. Shares slashed almost 8% in the afterhours trading, and will probably sit right on an important Fibonacci support, the major 38.2% retracement on April to July rebound. A slide below this level will technically send the share price into a bearish consolidation zone and increase the chances of deeper downside pressure, unless Elon Musk comes up with new and exciting ideas/updates about robotaxis, humanoid robots, etc.
Over at Google, the parent Alphabet did well last quarter. The company’s Q2 revenue topped estimates, cloud-computing sales rose by a better-than-expected 29%. But the number looked meagre compared to Amazon Web Services’ 38%. The search engine printed a 14% growth in revenue – believed to be partly due to AI – but it was not enough. Google reported the smallest earnings beat since early 2023 and the share price fell 2% in the afterhours trading.
As such, two of the Magnificent 7 stocks failed to create euphoria when they reported their Q2 results yesterday. The less-than-ideal set of earnings comes at a time when investors are questioning whether the AI rally has gotten ahead of itself. Elsewhere, UPS tanked 12% to the lowest since July 2020 as its earnings missed estimates. Wage inflation and soft package demand weighed on the Q2 results, GM fell more than 6% despite a profit beat and despite raising its profit outlook on truck demand. Another delay in its electric pickup plant didn’t please investors. Spotify was the only bright spot in the earnings crowd, as their shares jumped 12% as the paid subscriptions grew more than expected. But it was not enough. The S&P500 and Nasdaq both closed yesterday’s session with small losses, and the futures are both in the negative this morning. Nasdaq futures are down by almost 1% at the time I am talking here.
In Europe, the news weren’t much better. LVMH saw its ADRs decline almost 5% after announcing that revenue in China-region fell 14% in Q2 – in line with a broad-based weakness in other luxury houses across Europe as well.
The situation in China doesn’t enchant commodity traders either. Copper futures are down by 20% since the May peak, while US crude cleared the 200-DMA without much problem despite a 3.9-mio fall in US oil inventories last week – that could’ve slowed down the selloff, but did not. The next target for the bears stands near $77pb, the last major Fibonacci retracement on June to July rebound – that was tested but not broken yesterday. Trend and momentum indicators are comfortably negative suggesting that the $77pb support could be broken to clear the way for a deeper selloff to the $75pb level.
In the FX, the US dollar index was slightly stronger yesterday even though a weaker-than-expected Richmond manufacturing index, a more than 5% decline in existing home sales and a solid 2-year bond auction suggested a favourable environment for the Fed doves. The US 2-year yield sank to 4.45% and the 10-year yield stabilized near 4.25%. The EURUSD fell below 1.0850 as Cable slipped below 1.29. The rapid rise in speculative net positions warn that the bullish positioning in sterling looks stretched, but big names like Amundi turned bullish in sterling as its FX head said that he expects gains to extend to $1.35. Goldman Sachs also predicts further gains on brighter economic outlook and political stability. And the expectation that the Bank of England (BoE) could cut rates less than major peers also offers support. A minor support is seen near 1.2870, and a major support to the latest rebound stands at 1.2760, the major 38.2% Fibonacci retracement that should distinguish between the actual positive trend and a medium term bearish reversal.
On the flip side of the word, the USDJPY fell below the 155 mark on rising bets that the Bank of Japan (BoJ) could go ahead and hike its policy rate next week. An unexpected decline in the July manufacturing PMI to the contraction zone certainly could’ve spark a certain selloff but it didn’t, meaning that the trend weighs heavier than the data into next week’s BoJ decision. In Canada, the Loonie suffers from a sharp fall in oil prices and dovish Bank of Canada (BoC) expectations. The BoC is expected to announce a 25bp cut when it meets today. A sufficiently week decision could send the USDCAD above the 1.38 level as the Federal Reserve (Fed) cut expectations are mostly priced in by now.
Zooming out, are getting closer to the time for the other central bank doves to catch up with the Fed doves, and that process could slow down the depreciation of the US dollar against most majors. That’s perhaps why yesterday’s weak data from the US failed to encourage a further weakness in the US dollar index and kept the pair above the 200-DMA. But in the medium run, expect the US dollar to reverse the ytd positive trend and give the global monetary policy easing era a healthier outlook.
USD/JPY Daily Outlook
Daily Pivots: (S1) 155.06; (P) 156.08; (R1) 156.60; More...
USD/JPY's fall from 161.94 resumed by breaking through 155.36 today and intraday bias is back on the downside. Further decline should be seen to 38.2% retracement of 140.25 to 161.94 at 153.65. Some support could be seen there to bring rebound, at least on first attempt. Risk will now stay on the downside as long as 157.85 resistance holds, even in case of strong recovery.
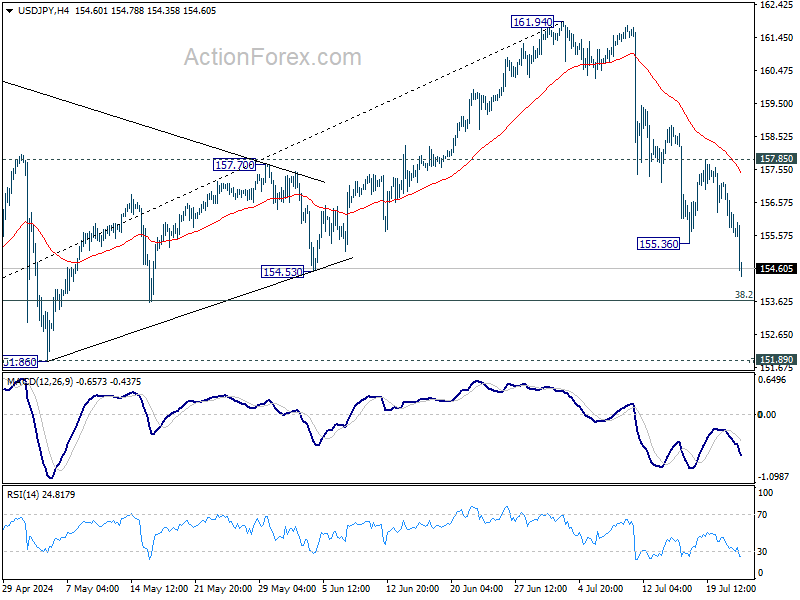
In the bigger picture, as long as 151.89 resistance turned support holds, long term up trend could still continue through 161.94 at a later stage. Next target will depend on the depth of the current correction from 161.94. However, sustained break of 151.89 will argue that larger scale correction or trend reversal is underway.
Yen Jumps as Strong PMI Boosts BoJ Hike Hopes; Canadian Dollar Eyes BoC Cut
Yen's rally accelerates again in Asian session today, driven by stronger-than-expected PMI services data, which bolsters the argument for a BoJ rate hike next week. While opinions vary on the exact timing of the rate move, with some economists forecasting a move in September or October, all would agree that an early hike this month is a distinct possibility. Reports indicate that the BoJ board might delay the decision until the last minute, contingent on retail sales data scheduled on the same day to confirm if this year's substantial wage hikes are boosting consumption.
The broader currency markets reflect a risk-off sentiment. Dollar, following Yen, ranks as the second strongest currency for the week, while Swiss Franc holds the third position. In contrast, Australian Dollar remains the weakest, followed by New Zealand Dollar and Canadian Dollar, which awaits today's BoC rate cut decision. Euro and Sterling are positioned in the middle.
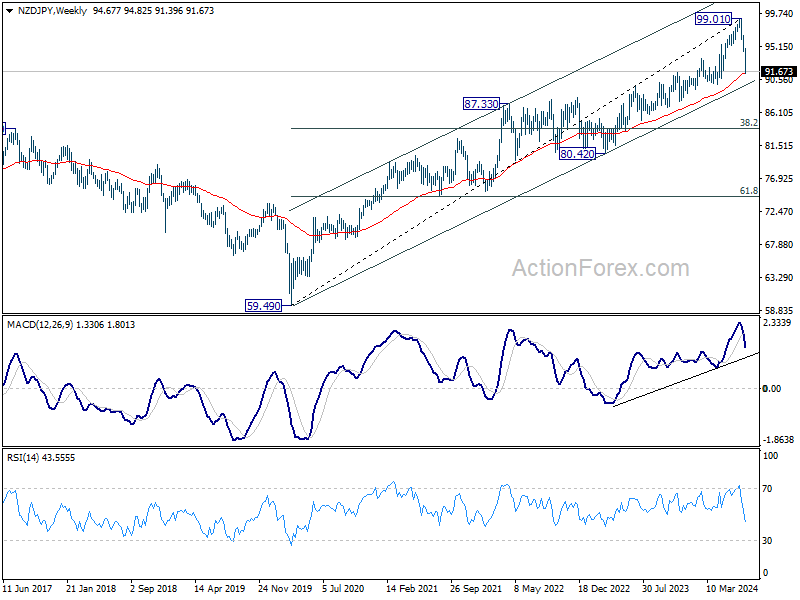
Technically, NZD/JPY is pressing 55 W EMA (now at 91.40) as the fall from 99.01 accelerates this week. Downside potential could be limited as the cross will also approach long term channel support (now at around 89.77). A bounce on oversold condition in daily chart should be due shortly. However, decisive break of 90 psychological level would signal that NZD/JPY is at least correcting whole up trend from 59.49 (2020 low), with risk of bearish reversal. That would set up deeper fall to 38.2% retracement of 59.49 to 99.01 at 83.91 in medium term.
In Asia, at the time of writing, Nikkei is down -0.94%. Hong Kong HSI is down -0.64%. China Shanghai SSE is down -0.17%. Singapore Strait Times is down -0.07%. Japan 10-year JGB yield is up 0.0062 at 1.069. Overnight, DOW fell -0.14%. S&P 500 fell -0.16%. NASDAQ fell -0.06%. 10-year yield fell -0.021 to 4.239.
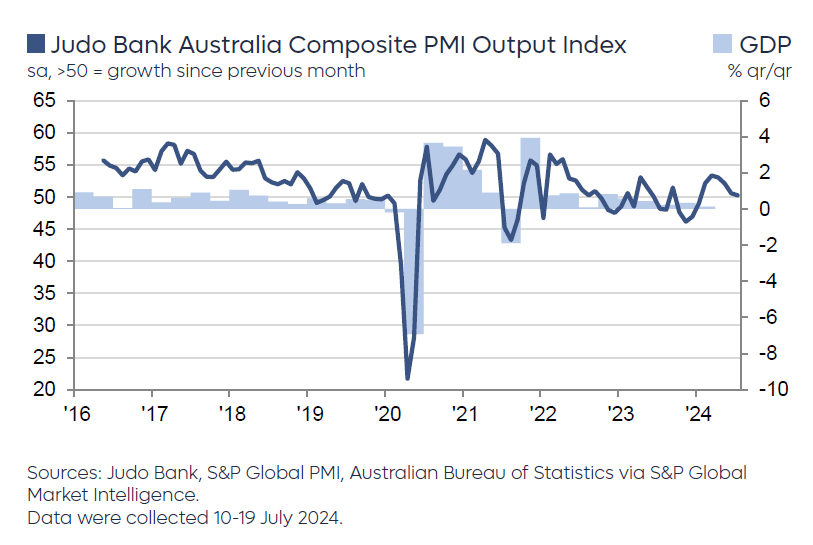
Australia's PMI composite dips to 50.8, no major slowdown with continued inflation pressures
Australia's PMI Manufacturing saw a marginal improvement in July, rising slightly from 47.2 to 47.4. Conversely, PMI Services dropped to a six-month low, moving from 51.2 to 50.8. PMI Composite also decreased from 50.7 to 50.2, the lowest in six months.
Warren Hogan, Chief Economic Advisor at Judo Bank, highlighted that despite a further moderation in the composite output index, "there are no signs of a significant slowdown in Australian business activity in 2024." He noted that while manufacturing continues to struggle, services sector is still experiencing better activity compared to the end of 2023.
Hogan also mentioned that the impact of recent tax cuts and cost-of-living support measures has yet to fully manifest in the business conditions and should positively affect consumer spending in future months. Insights from the upcoming final PMIs for July and the reports for August are expected to provide a clearer picture of these effects.
Despite softer activity levels, inflation pressures have not eased significantly. The services sector saw a notable increase in input costs, which rose four points to 63.3—the highest since November 2023. In contrast, manufacturing input costs rose only slightly and are near their lowest in four years. The composite output price index nudged up to 54.1 in July, indicating a small increase but suggesting that inflation is likely stabilizing around an annualized rate of 4% as of mid-2024.
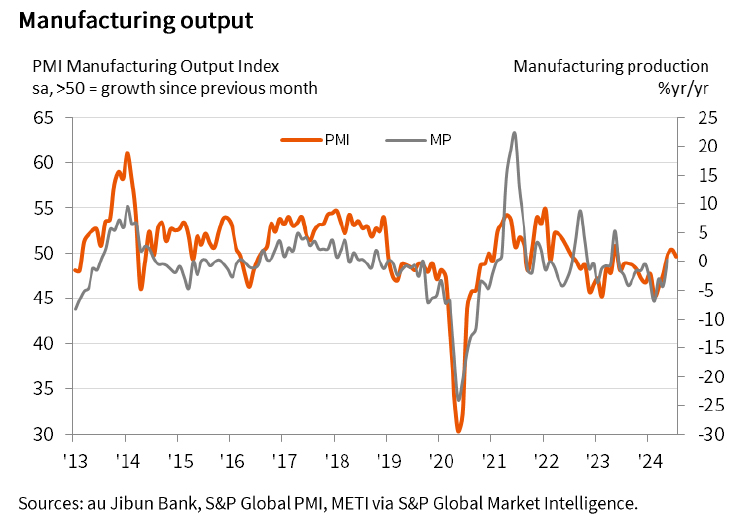
Japan's PMI services surges to 53.9 while manufacturing back in contraction
Japan's PMI Manufacturing declined from 50.0 to 49.2, underperforming against expectations of 50.5, indicating contraction. In contrast, PMI Services experienced a robust increase, rising sharply from 49.4 to 53.9, signaling a strong expansion and the highest activity level in three months. PMI Composite also rose from 49.7 to 52.6.
Usama Bhatti, Economist at S&P Global Market Intelligence, stating the reading was "indicative of solid growth," driven primarily by the services sector. Manufacturing saw a "renewed reduction in output," though the decline was marginal.
Additionally, the PMI report highlighted increasing operational challenges, with a "renewed increase in capacity pressures" across the private sector. For the first time in three months, there was a rise in the level of outstanding business, suggesting that firms are facing more backlog in their operations.
The report also underscored persistent cost pressures, particularly in manufacturing, where input prices rose sharply, marking the steepest increase since April 2023.
BoC to cut rates again; USD/CAD set for further gains
BoC is widely anticipated to cut its interest rate by 25bps to 4.50% today, the second reduction in a row. This expectation is strongly backed by financial markets, which are pricing in nearly a 93% probability. While the decision itself seems almost certain, the market's attention will be on BoC's guidance regarding the pace of future monetary easing.
A recent Reuters survey sheds light on the expected path of rate cuts. Out of 30 economists surveyed, 16 foresee two additional rate cuts this year, likely in October and December, which would bring the rate down to 4.00%. Ten economists predict just one more cut to 4.25%, while four expect a total of three additional cuts, taking the rate to 3.75%.
USD/CAD has been surging this week, driven in part by the broad selloff in commodity currencies, including Loonie. Additionally, there is backdrop of expectations that Fed will cut rates twice this year. Additionally, the potential return of Donald Trump to US presidency raises prospects of slower policy easing next year. In contrast, BoC is anticipated to ease policy more quick and deeper than Fed, while it has already commenced its cycle of rate cuts.
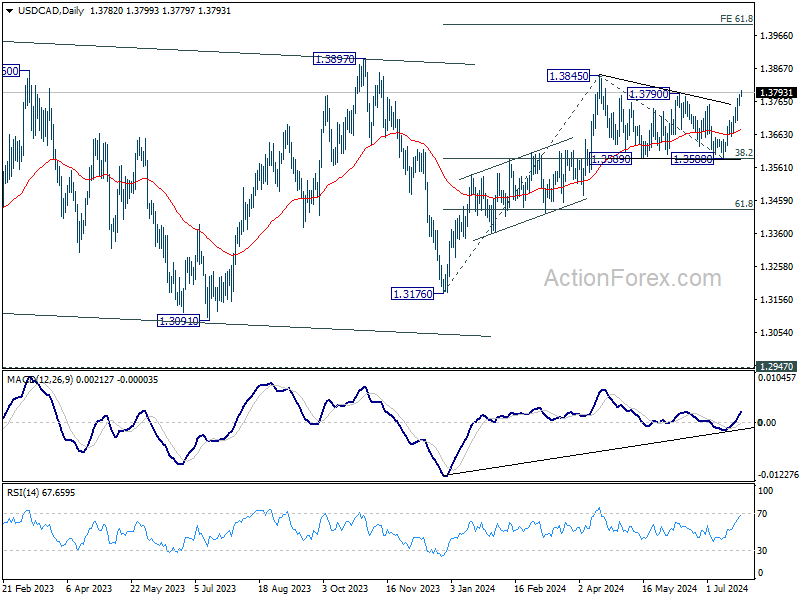
Technically, USD/CAD's break of 1.3790 resistance solidify the case that consolidation from 1.3845 has completed with three waves down to 1.3588. Retest of 1.3845 high should be seen next. Firm break there will resume whole rally from 1.3176 and target 61.8% projection of 1.3176 to 1.3845 from 1.3588 at 1.4025.
Elsewhere
Germany Gfk consumer sentiment, Eurozone PMIs and UK PMIs will be released in European session. Later in the day, US will release goods trade balance, PMIs, and new home sales.
USD/JPY Daily Outlook
Daily Pivots: (S1) 155.06; (P) 156.08; (R1) 156.60; More...
USD/JPY's fall from 161.94 resumed by breaking through 155.36 today and intraday bias is back on the downside. Further decline should be seen to 38.2% retracement of 140.25 to 161.94 at 153.65. Some support could be seen there to bring rebound, at least on first attempt. Risk will now stay on the downside as long as 157.85 resistance holds, even in case of strong recovery.
In the bigger picture, as long as 151.89 resistance turned support holds, long term up trend could still continue through 161.94 at a later stage. Next target will depend on the depth of the current correction from 161.94. However, sustained break of 151.89 will argue that larger scale correction or trend reversal is underway.
Economic Indicators Update
| GMT | Ccy | Events | Actual | Forecast | Previous | Revised |
|---|---|---|---|---|---|---|
| 23:00 | AUD | Manufacturing PMI Jul P | 47.4 | 47.2 | ||
| 23:00 | AUD | Services PMI Jul P | 50.8 | 51.2 | ||
| 00:30 | JPY | Manufacturing PMI Jul P | 49.2 | 50.5 | 50 | |
| 00:30 | JPY | Services PMI Jul P | 53.9 | 49.4 | ||
| 06:00 | EUR | Germany GfK Consumer Confidence Aug | -21.1 | -21.8 | ||
| 07:15 | EUR | France Manufacturing PMI Jul P | 45.9 | 45.4 | ||
| 07:15 | EUR | France Services PMI Jul P | 49.7 | 49.6 | ||
| 07:30 | EUR | Germany Manufacturing PMI Jul P | 44.5 | 43.5 | ||
| 07:30 | EUR | Germany Services PMI Jul P | 53.5 | 53.1 | ||
| 08:00 | EUR | Eurozone Manufacturing PMI Jul P | 46.3 | 45.8 | ||
| 08:00 | EUR | Eurozone Services PMI Jul P | 52.9 | 52.8 | ||
| 08:30 | GBP | Manufacturing PMI Jul P | 51.1 | 50.9 | ||
| 08:30 | GBP | Services PMI Jul P | 52.5 | 52.1 | ||
| 12:30 | CAD | New Housing Price Index M/M Jun | 0.10% | 0.20% | ||
| 12:30 | USD | Goods Trade Balance (USD) Jun P | -98.0B | -99.4B | ||
| 12:30 | USD | Wholesale Inventories Jun P | 0.50% | 0.60% | ||
| 13:45 | CAD | BoC Interest Rate Decision | 4.50% | 4.75% | ||
| 13:45 | USD | Manufacturing PMI Jul P | 51.5 | 51.6 | ||
| 13:45 | USD | Services PMI Jul P | 54.5 | 55.3 | ||
| 14:00 | USD | New Home Sales M/M Jun | 643K | 619K | ||
| 14:30 | CAD | BoC Press Conference | ||||
| 14:30 | USD | Crude Oil Inventories | -2.6M | -4.9M |
BoC to cut rates again; USD/CAD set for further gains
BoC is widely anticipated to cut its interest rate by 25bps to 4.50% today, the second reduction in a row. This expectation is strongly backed by financial markets, which are pricing in nearly a 93% probability. While the decision itself seems almost certain, the market's attention will be on BoC's guidance regarding the pace of future monetary easing.
A recent Reuters survey sheds light on the expected path of rate cuts. Out of 30 economists surveyed, 16 foresee two additional rate cuts this year, likely in October and December, which would bring the rate down to 4.00%. Ten economists predict just one more cut to 4.25%, while four expect a total of three additional cuts, taking the rate to 3.75%.
USD/CAD has been surging this week, driven in part by the broad selloff in commodity currencies, including Loonie. Additionally, there is backdrop of expectations that Fed will cut rates twice this year. Additionally, the potential return of Donald Trump to US presidency raises prospects of slower policy easing next year. In contrast, BoC is anticipated to ease policy more quick and deeper than Fed, while it has already commenced its cycle of rate cuts.
Technically, USD/CAD's break of 1.3790 resistance solidify the case that consolidation from 1.3845 has completed with three waves down to 1.3588. Retest of 1.3845 high should be seen next. Firm break there will resume whole rally from 1.3176 and target 61.8% projection of 1.3176 to 1.3845 from 1.3588 at 1.4025.
Japan’s PMI services surges to 53.9 while manufacturing back in contraction
Japan's PMI Manufacturing declined from 50.0 to 49.2, underperforming against expectations of 50.5, indicating contraction. In contrast, PMI Services experienced a robust increase, rising sharply from 49.4 to 53.9, signaling a strong expansion and the highest activity level in three months. PMI Composite also rose from 49.7 to 52.6.
Usama Bhatti, Economist at S&P Global Market Intelligence, stating the reading was "indicative of solid growth," driven primarily by the services sector. Manufacturing saw a "renewed reduction in output," though the decline was marginal.
Additionally, the PMI report highlighted increasing operational challenges, with a "renewed increase in capacity pressures" across the private sector. For the first time in three months, there was a rise in the level of outstanding business, suggesting that firms are facing more backlog in their operations.
The report also underscored persistent cost pressures, particularly in manufacturing, where input prices rose sharply, marking the steepest increase since April 2023.
Australia’s PMI composite dips to 50.8, no major slowdown with continued inflation pressures
Australia's PMI Manufacturing saw a marginal improvement in July, rising slightly from 47.2 to 47.4. Conversely, PMI Services dropped to a six-month low, moving from 51.2 to 50.8. PMI Composite also decreased from 50.7 to 50.2, the lowest in six months.
Warren Hogan, Chief Economic Advisor at Judo Bank, highlighted that despite a further moderation in the composite output index, "there are no signs of a significant slowdown in Australian business activity in 2024." He noted that while manufacturing continues to struggle, services sector is still experiencing better activity compared to the end of 2023.
Hogan also mentioned that the impact of recent tax cuts and cost-of-living support measures has yet to fully manifest in the business conditions and should positively affect consumer spending in future months. Insights from the upcoming final PMIs for July and the reports for August are expected to provide a clearer picture of these effects.
Despite softer activity levels, inflation pressures have not eased significantly. The services sector saw a notable increase in input costs, which rose four points to 63.3—the highest since November 2023. In contrast, manufacturing input costs rose only slightly and are near their lowest in four years. The composite output price index nudged up to 54.1 in July, indicating a small increase but suggesting that inflation is likely stabilizing around an annualized rate of 4% as of mid-2024.
AUD/USD Declines: Market Insights on the Tumble
Key Highlights
- AUD/USD declined heavily from the 0.6800 resistance zone.
- It traded below a key bullish trend line with support at 0.6725 on the 4-hour chart.
- EUR/USD started a downside correction below the 1.0880 level.
- Oil prices turned red and declined below the $78.50 level.
AUD/USD Technical Analysis
The Aussie Dollar saw a strong bearish reaction from 0.6800 against the US Dollar. AUD/USD started a major decline and traded below the 0.6720 support.
Looking at the 4-hour chart, the pair traded below a key bullish trend line with support at 0.6725. It settled below the 0.6680 pivot level, the 100 simple moving average (red, 4-hour), and the 200 simple moving average (green, 4-hour).
The decline dragged the pair below the last swing low of 0.6619. Immediate support is near the 0.6580 level. The next major support is near the 0.6550 level.
A downside break and close below the 0.6550 support zone could open the doors for more losses. In the stated case, AUD/USD might decline toward the 0.6500 level.
If there is a recovery wave, the pair could face resistance near the 0.6640 level. The next resistance sits at 0.6660. The main hurdle sits at 0.6700. A clear move above the 0.6700 resistance might send it toward the 0.6720 level. Any more gains might open the doors for a test of the 0.6750 zone in the coming days.
Looking at Oil, the bears took control and they were able to push the price below the $78.80 and $78.50 support levels.
Economic Releases
- Euro Zone Manufacturing PMI for July 2024 (Preliminary) – Forecast 46.1, versus 45.8 previous.
- Euro Zone Services PMI for July 2024 (Preliminary) – Forecast 53.0, versus 52.8 previous.
- UK Manufacturing PMI for July 2024 (Preliminary) – Forecast 51.1, versus 50.9 previous.
- UK Services PMI for July 2024 (Preliminary) – Forecast 52.5, versus 52.1 previous.
- US Manufacturing PMI for July 2024 (Preliminary) – Forecast 51.7, versus 51.6 previous.
- US Services PMI for July 2024 (Preliminary) – Forecast 54.4, versus 55.3 previous.
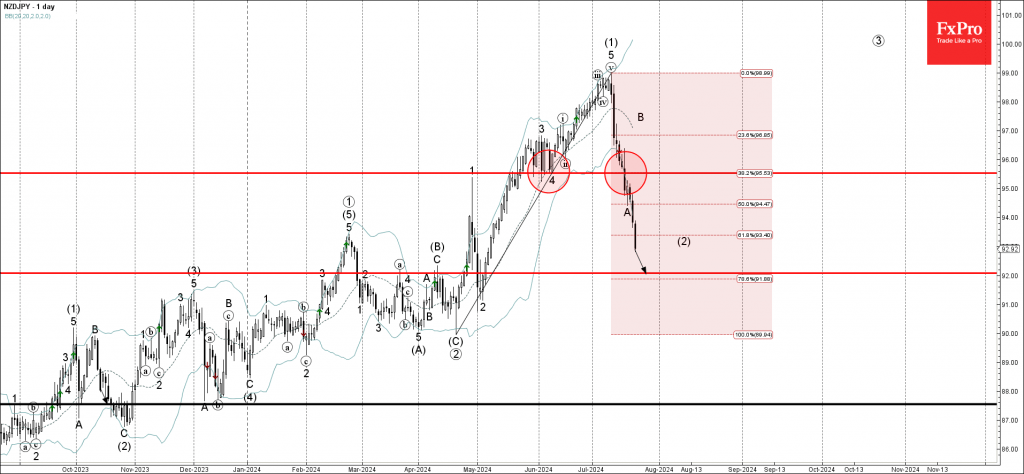
NZDJPY Wave Analysis
- NZDJPY falling inside ABC correction (2)
- Likely to reach support level 92.00
NZDJPY currency pair falling sharply after the price broke the support area located between the support level 95.50 and the 38.2% Fibonacci retracement of the previous impulse (1) wave from April.
The breakout of this support area accelerated the active impulse wave C of the intermediate ABC correction (2) from the start of this month.
NZDJPY currency pair can be expected to fall further to the next support level 92.00 (target price for the completion of the active wave (2)).