
Sample Category Title
Is US 100 Setting Course for New Record Highs?
- US 100 enters recovery mode, stays above uptrend line
- MACD and RSI suggest that momentum may turn positive
- A break above 18,350 will take the index into uncharted territory
- A break below 15,700 may turn the broader outlook bearish
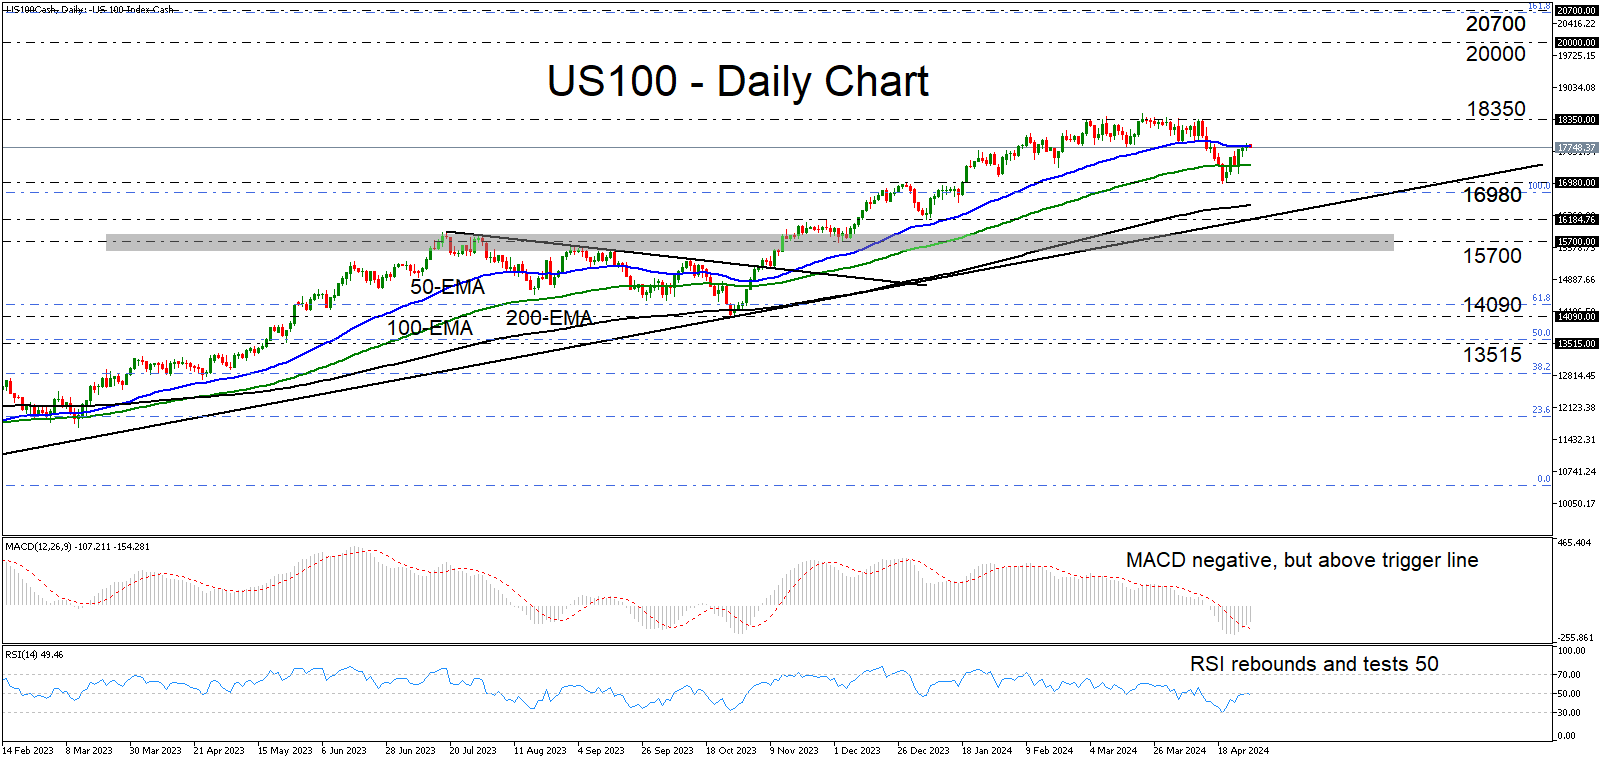
The US 100 cash index entered a recovery mode last week, after hitting support near the 16,980 zone. Overall, the index is trading above a long-term uptrend line drawn from the low of January 6, 2023, as well as above its 200-day exponential moving average (EMA). These technical signs paint a positive broader outlook.
The MACD is rebounding, emerging above its trigger line, and now looks to be headed towards zero, while the RSI has recovered as well after hitting 30 and is now testing its 50 line. Both indicators suggest that the short-term momentum is likely to turn positive again soon, which means further recovery for US 100.
Nonetheless, for the prevailing long-term uptrend to resume, the price may need to clearly break and close above the 18,350 territory, which has been acting as a ceiling since the beginning of March. A move higher would take the index into uncharted territory and perhaps encourage the bulls to aim for the psychological round number of 20,000 or the 161.8% Fibonacci extension level of the November 2021 – October 2022 decline, at around 20,700.
For the bigger picture to darken, a break below the key support area of 15,700 may be needed. The price would be below the aforementioned uptrend line and below all three of the plotted moving averages, which may encourage the bears to dive all the way down to the 14,090 barrier, marked by the low of October 26.
To recap, US 100 has been recovering ground lately, but the move signaling the resumption of its prevailing long-term uptrend may be a decisive break and a daily close above 18,350.
Canada’s Economy Continued to Grow in February, No Growth Expected in March
The Canadian economy grew for a second straight month in February, up 0.2% on a month-on-month (m/m) basis. This print comes in slightly below Statistics Canada's advanced guidance and market expectations for a 0.4% and 0.3% m/m gain, respectively. The flash estimate for March points to flat growth.
February's reading was broad-based, with output expanding in 12 of 20 industries. The gain, similar to January, was services driven (0.2% m/m), while the goods sector remained essentially unchanged.
The services side gain was aided by a 1.4% m/m increase in the transportation and warehousing sector and a continuation of growth in the public sector (0.2% m/m) after January's surge. Wholesale trade and the finance and insurance sector saw modest growth of 0.3% m/m.
On the goods side, oil and gas sector output advanced by a healthy 3.3% m/m, reversing January's decline. Offsetting growth was a 2.6% m/m contraction in the utilities sector and a 0.4% m/m decline in manufacturing.
The advanced reading of flat growth in March is due to gains in utilities and real estate being offset by decreases in manufacturing and trade.
Key Implications
The Canadian economy continued to grow into February, but at a slightly slower speed after January's downwardly revised print and February's downside miss. Still, with today's print and next month's guidance, first quarter GDP is tracking a healthy 2.5% q/q annualized, in line with the Bank of Canada and our estimates.
While today's GDP report reinforces expectations that first quarter growth will post a decent print compared to the meager growth seen over 2023, the deceleration in February and March signal this rebound is unlikely to last. This should encourage the Bank of Canada, which needs to make sure inflation is on a sustainable path back to 2%. At this stage, market pricing is split down the middle between the first interest rate cut occurring in June or July. We lean towards the latter as it will give the Bank slightly more time to ensure that inflationary trends are durable.
EUR/USD Mid-Day Outlook
Daily Pivots: (S1) 1.0695; (P) 1.0714; (R1) 1.0740; More...
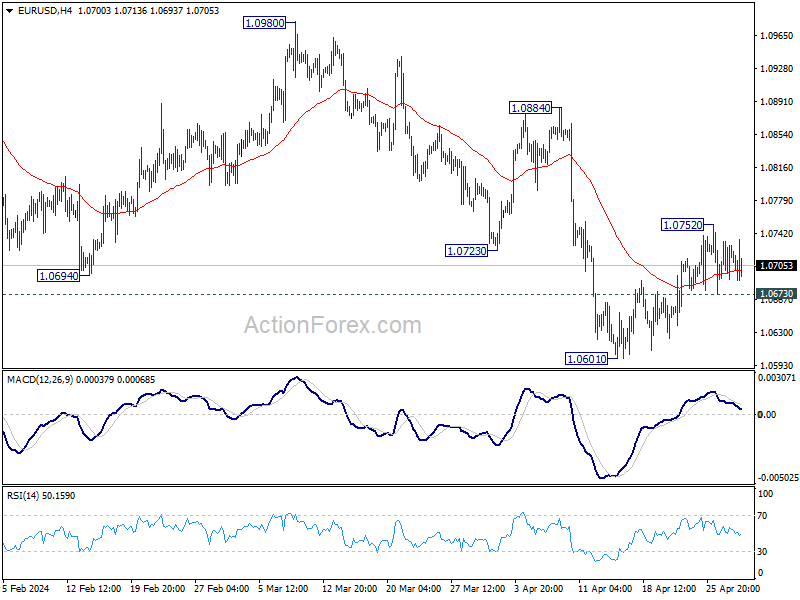
Intraday bias in EUR/USD remains neutral for the moment. On the upside, above 1.0752 will resume the rebound to 55 D EMA (now at 1.0780). On the downside, break of 1.0673 minor support will turn intraday bias to the downside for retesting 1.0601 low.
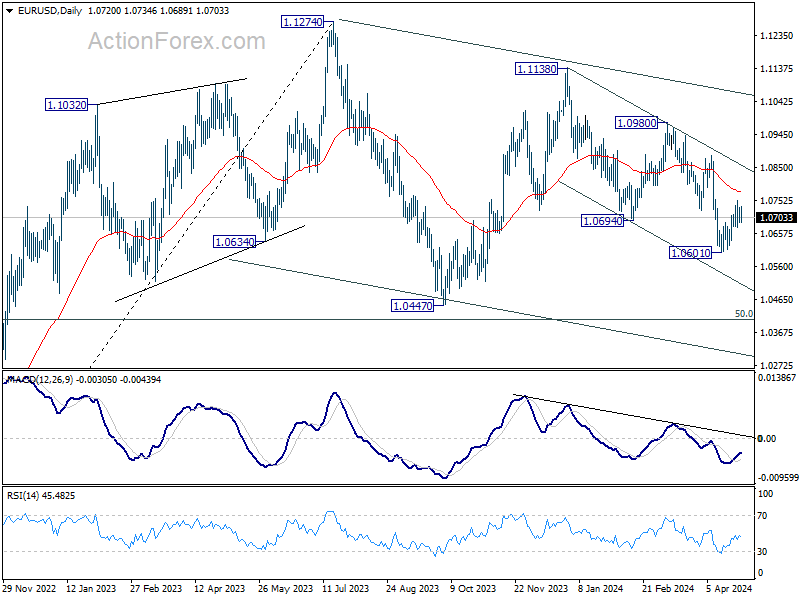
In the bigger picture, price actions from 1.1274 are viewed as a corrective pattern to rise from 0.9534 (2022 low). Current fall from 1.1138 is seen as the third leg. While deeper decline is would be seen to 1.0447 and possibly below, strong support should emerge from 61.8% retracement of 0.9534 to 1.1274 at 1.0199 to complete the correction.
GBP/USD Mid-Day Outlook
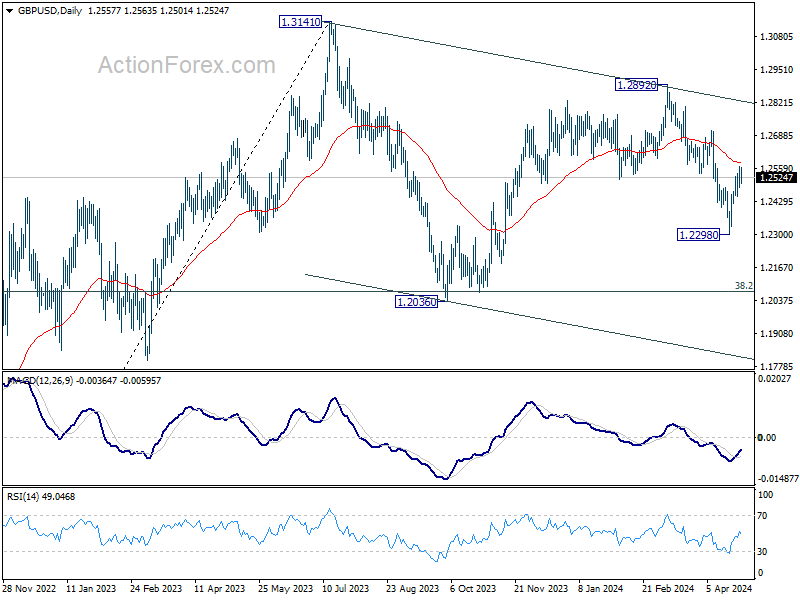
Daily Pivots: (S1) 1.2504; (P) 1.2537; (R1) 1.2595; More...
Intraday bias in GBP/USD is turned neutral with current retreat. On the upside, above 1.2568 will resume the rebound from 1.2298 to 55 D EMA (now at 1.2580). Sustained break there will argue that fall from 1.2892 has completed already, and bring further rise to this resistance. Nevertheless, on the downside, break of 1.2448 minor support will bring retest of 1.2298 low instead.
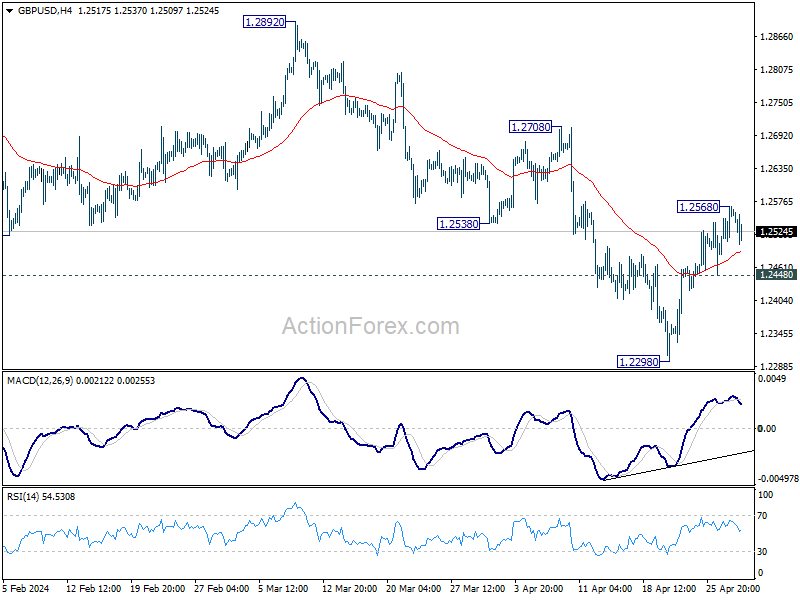
In the bigger picture, price actions from 1.3141 medium term top are seen as a corrective pattern to up trend from 1.0351 (2022 low). Fall from 1.2892 is seen as the third leg. Deeper decline would be seen to 1.2036 support and possibly below. But strong support should emerge from 61.8% retracement of 1.0351 to 1.2452 at 1.1417 to complete the correction.
USD/JPY Mid-Day Outlook
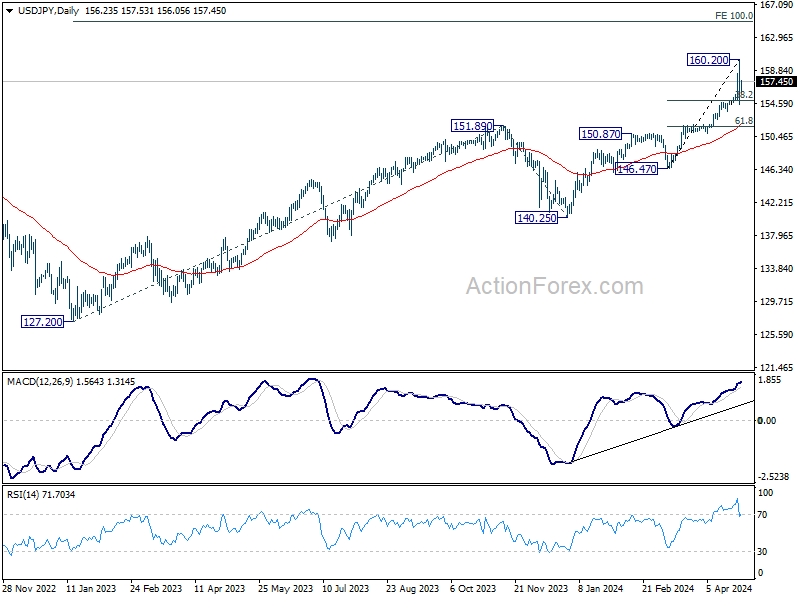
Daily Pivots: (S1) 153.91; (P) 156.95; (R1) 159.37; More...
USD/JPY is extending consolidation from 160.20 and intraday remains neutral. Strong support could be seen from 38.2% retracement of 146.47 to 160.20 at 154.95 to bring recovery. But break of 160.20 is not envisaged for now. However, firm break of 154.95 will turn bias to the downside for deeper correction to 55 D EMA (now at 152.00).
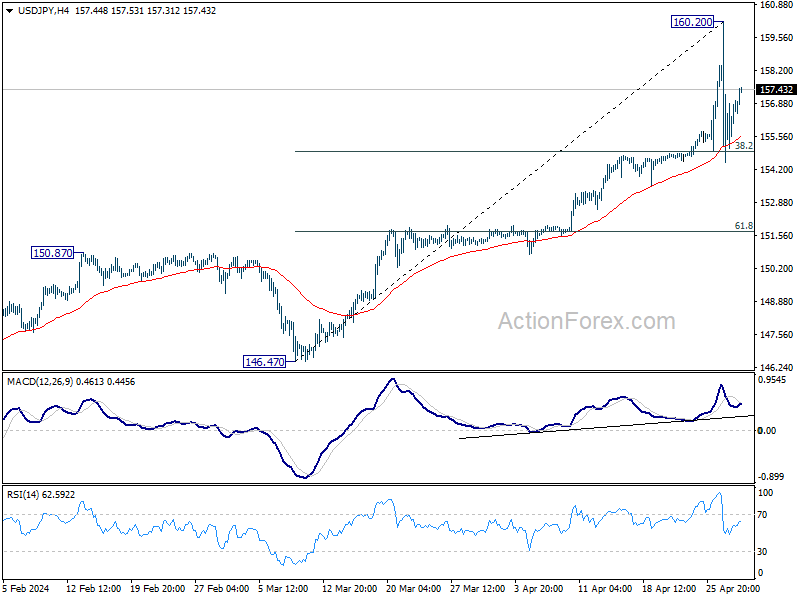
In the bigger picture, current rise from 140.25 is seen as the third leg of the up trend from 127.20 (2023 low). Next target is 100% projection of 127.20 to 151.89 from 140.25 at 164.94. Outlook will remain bullish as long as 150.87 resistance turned support holds, even in case of deep pullback.
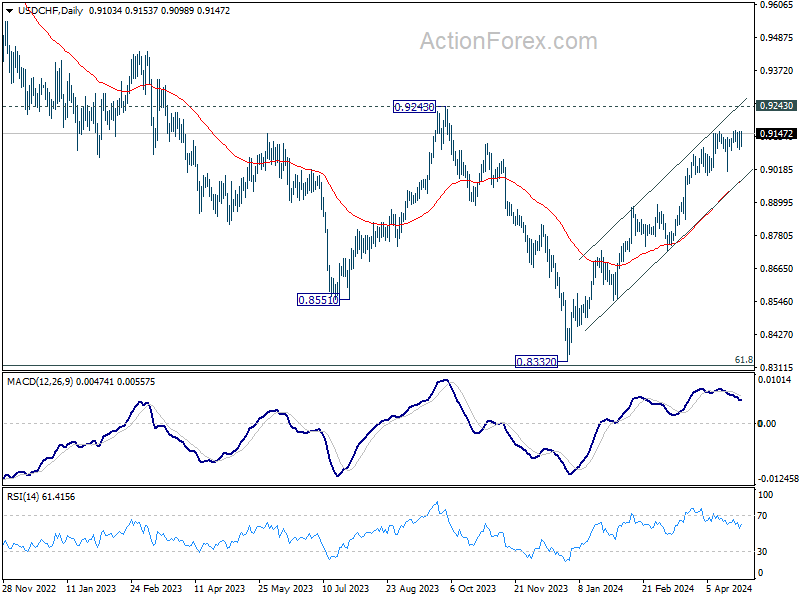
USD/CHF Mid-Day Outlook
Daily Pivots: (S1) 0.9079; (P) 0.9116; (R1) 0.9143; More....
Intraday bias in USD/CHF remains neutral for the moment. On the upside, firm break of 0.9155 will resume the rally from 0.8332 and should target 0.9243 key resistance next. On the downside, break of 0.9085 will turn bias to the downside for deeper pullback.
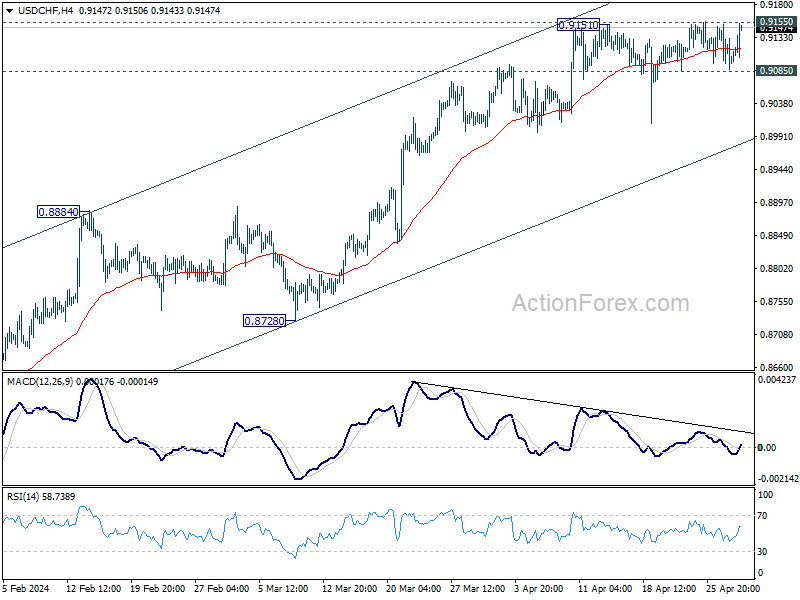
In the bigger picture, price actions from 0.8332 medium term bottom as tentatively seen as developing into a corrective pattern to the down trend from 1.0146 (2022 high). Further rise would be seen as long as 0.8884 resistance turned support holds. But upside should be limited by 0.9243 resistance, at least on first attempt. However, decisive break of 0.9243 will argue that the trend has already reversed and turn medium term outlook bullish.
Dollar Rebounds on Strong Employment Cost Data, Euro Supported by GDP and CPI Core
Dollar's rebound is picking up momentum in early US session, bolstered by latest Employment Cost Index which rose by 1.2% in Q3, marking the fastest pace since Q3 2022. This unexpected acceleration in employment costs adds to a series of economic data that suggests the US economy remains hotter than preferred. Especially, persistently elevated services inflation and tight labor market are holding back Fed's plan for interest rate cuts. With this economic backdrop, Fed Chair Jerome Powell is expected to temper market expectations tomorrow about the feasibility of three rate cuts this year, reinforcing the notion that Fed would maintain a more cautious approach to monetary policy easing.
Meanwhile, Euro also recovers slightly today, spurred by stronger than anticipated Q1 GDP growth combined with slower-than-expected decline in April's CPI core. While these developments are unlikely to disrupt ECB's tentative plans for June rate cut. The scenario of continued economic momentum and slowing disinflation would diminish the urgency for aggressive rate cuts by ECB, supporting a strategy of two rate reductions by the end of Q3 and Q4, respectively.
In the broader currency markets, New Zealand Dollar and Australian Dollar are underperforming today. Yen is also weak, reversing gains from yesterday's rebound. Dollar leads as the strongest, followed by Euro and the Sterling. Swiss Franc and Canadian Dollar are in the middle. Though, Canadian Dollar shows signs of further weakness following disappointing GDP data, and could slide further in the currency rankings.
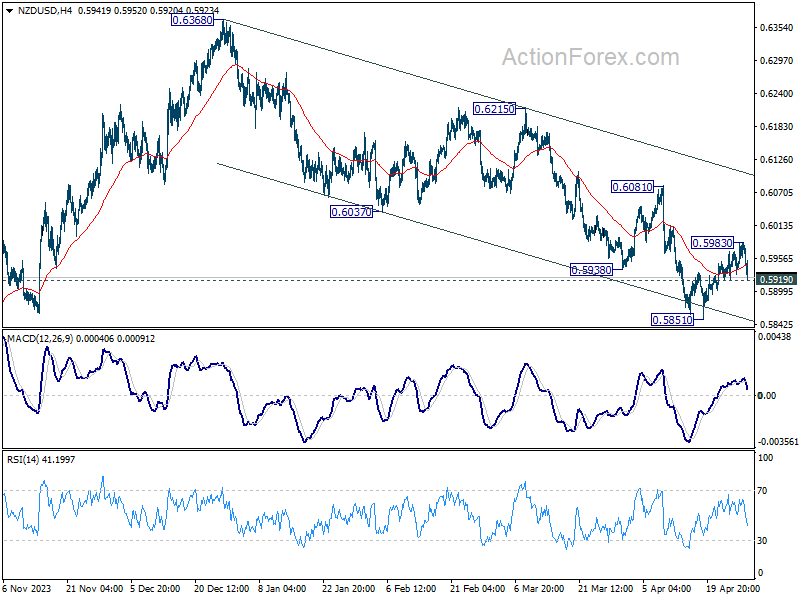
Technically, NZD/USD's recovery from 0.5851 could have completed at 0.5983 already. Break of 0.5919 minor support will affirm this case, and argue that larger fall from 06368 is ready to resume through 0.5851 low. Employment data from New Zealand in the upcoming Asian session could be a key catalyst in determining whether a downward breakout occurs
In Europe, at the time of writing, FTSE is up 0.44%. DAX is down -0.65%. CAC is down -0.34%. UK 10-year yield is up 0.047 at 4.349. Germany 10-year yield is up 0.055 at 2.589. Earlier in Asian, Nikkei rose 1.24%. Hong Kong HSI rose 0.09%. China Shanghai SSE fell -0.26%. Singapore Strait Times rose 0.32%. Japan 10-year JGB yield closed flat at 0.874.
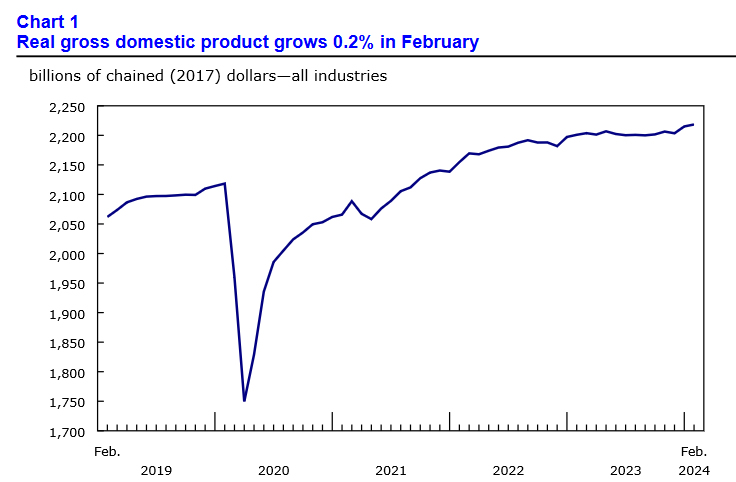
Canada's GDP grows 0.2% mom in Feb, vs exp. 0.3% mom
Canada's GDP grew 0.2% mom in February, below expectation of 0.3% mom. Services-producing industries (+0.2%) led the growth for a second month in a row. Goods-producing industries aggregate was essentially unchanged. Overall, 12 of 20 sectors increased in the month.
Advance information indicates that real GDP was essentially unchanged in March. That suggests the economy expanded 0.6% in the first quarter of 2024.
Eurozone GDP rises 0.3% qoq in Q1, above exp 0.1% qoq
Eurozone GDP grew 0.3% qoq, 0.4% yoy in Q1, better than expectation of 0.1% qoq, 0.2% yoy. EU GDP grew 0.3% qoq, 0.5% yoy.
Among the Member States for which data are available, Ireland (+1.1%) recorded the highest increase compared to the previous quarter, followed by Latvia, Lithuania and Hungary (all +0.8%). Sweden (-0.1%) was the only Member State that recorded a decrease. The year on year growth rates were positive for nine countries and negative for four.
Eurozone CPI unchanged at 2.4% in Apr, core CPI down to 2.7%
Eurozone CPI was unchanged at 2.4% yoy in April, matched expectations. CPI core (energy, food, alcohol & tobacco) slowed from 2.9% yoy to 2.7% yoy, above expectation of 2.6% yoy.
Looking at the main components of euro area inflation, services is expected to have the highest annual rate in April (3.7%, compared with 4.0% in March), followed by food, alcohol & tobacco (2.8%, compared with 2.6% in March), non-energy industrial goods (0.9%, compared with 1.1% in March) and energy (-0.6%, compared with -1.8% in March).
ECB's de Cos: Rate cut appropriate in June if inflation outlook maintained
ECB Governing Council member Pablo Hernandez de Cos highlighted that despite the positive trend in declining inflation rates, outlook is clouded by rising energy costs, persistent high inflation in the services sector, and ongoing geopolitical tensions.
He expected that inflation would continue to decrease in the upcoming quarters, albeit at a slower pace than previously observed due to certain upward base effects.
"The ECB's governing council considers that if this inflation outlook is maintained, it would be appropriate to start reducing the current level of monetary policy tightening in June."
Swiss KOF rises to 101.8, stable economy, no strong boost in sight
Swiss KOF Economic Barometer rose from 100.4 to 101.8 in April, slightly above expectation of 101.7. This rise positions the barometer in a range that is slightly above average, suggesting a stable yet unspectacular outlook for Switzerland's economy.
According to the KOF Economic Institute, "The Swiss economic development is robust, but there is currently no strong boost in sight."
Overall economic outlook appears to be improving across several key sectors including financial and insurance services, manufacturing, and private consumption. Conversely, outlook for construction and hospitality industries presents a less optimistic picture.
Japan's industrial production rises 3.8% mom in Mar, more growth ahead
Japan's industrial sector showed a robust rebound in March, with production rising by 3.8% mom, surpassing expectations of a 3.4% increase. This significant uptick represents a strong recovery from the previous month's -0.6% yoy decline.
Production of machinery, including semiconductor manufacturing equipment, jumped by 11.6% mom, while output in electronic parts and devices saw 9.2% mom increase.
According to manufacturers surveyed by Japan's Ministry of Industry, the up trend in industrial output is expected to continue, with projections of a 4.1% rise in April and a further 4.4% expansion in May.
Contrastingly, the retail sector did not fare as well. Retail sales in March increased by only 1.2% yoy, falling short of 2.2% yoy growth anticipated and marking a deceleration from February's robust 4.7% yoy increase. On a month-on-month basis, retail sales contracted -1.2%, reversing the 1.7% gain observed in February.
Australia's retail sales falls -0.4% mom in Mar amid cost of living pressures
Australia's retail sales fell -0.4% mom in March, well below expectation of 0.2% mom.
Ben Dorber, ABS head of retail statistics, highlighted the impact of cost of living pressures on consumer behavior.
He further noted the stagnation in the sector, stating, "Underlying retail turnover has been flat for the past six months and was up only 0.8 percent compared to March 2023."
This represents one of the weakest growth rates on record for this period, excluding the unique economic circumstances induced by the pandemic and the introduction of GST.
New Zealand ANZ business confidence plunges to 14.9 amid rising costs and weak demand
ANZ Business Confidence dropped notably from 22.9 to 14.9 in April. Own Activity Outlook similarly decreased from 22.5 to 14.3.
The survey highlighted escalating cost pressures as a primary concern for businesses. Cost expectations rose from 74.6 to 76.7, marking the highest level since last September. Conversely, wage expectations decreased from 80.5 to 75.5. Profit expectations also worsened, deepening from -3.8 to -9.8.
Pricing intentions, which indicate how businesses plan to adjust their selling prices, increased slightly from 45.1 to 46.9. Inflation expectations showed a marginal decrease from 3.80% to 3.76%.
ANZ analysts pointed to several factors contributing to this environment of cost-push inflation amidst weak demand. Rising oil prices due to escalating tensions in the Middle East, coupled with recent decline in New Zealand Dollar have increased the cost of imports significantly. Additionally, the recent increase in the minimum wage, effective from April 1, although smaller than previous years, has added another layer of cost for businesses.
China's NBS PMI manufacturing falls to 50.4, Caixin rises to 51.4
China's NBS PMI Manufacturing fell from 50.8 to 50.4 in April, matched expectations. NBS PMI Non-Manufacturing fell from 53.0 to 51.2, below expectation of 52.2. PMI Composite fell from 52.7 to 51.7.
The breakdown of the manufacturing PMI reveals challenges in solidifying demand, as the new orders subindex dropped to 51.1 from 53, and the new export orders fell to 50.6 from 51.3. Conversely, the production subindex showed modest improvement, rising to 52.9 from 52.2.
Senior NBS statistician Zhao Qinghe noted, "Though economic activities continued to expand, more manufacturers are facing higher costs." He highlighted specific industries such as automobiles and electrical machinery, where domestic and foreign market demands are reportedly strengthening.
In contrast, Caixin PMI, which focuses more on smaller, private manufacturing firms, presented a more optimistic view. Caixin Manufacturing PMI rose to 51.4 from 51.1, surpassing expectations of 51.0.
According to Wang Zhe, senior economist at Caixin Insight Group, "the manufacturing sector continued to improve, with accelerated expansion in supply and demand, sweetened by exceptional performance in overseas demand."
USD/CHF Mid-Day Outlook
Daily Pivots: (S1) 0.9079; (P) 0.9116; (R1) 0.9143; More....
Intraday bias in USD/CHF remains neutral for the moment. On the upside, firm break of 0.9155 will resume the rally from 0.8332 and should target 0.9243 key resistance next. On the downside, break of 0.9085 will turn bias to the downside for deeper pullback.
In the bigger picture, price actions from 0.8332 medium term bottom as tentatively seen as developing into a corrective pattern to the down trend from 1.0146 (2022 high). Further rise would be seen as long as 0.8884 resistance turned support holds. But upside should be limited by 0.9243 resistance, at least on first attempt. However, decisive break of 0.9243 will argue that the trend has already reversed and turn medium term outlook bullish.
Economic Indicators Update
| GMT | Ccy | Events | Actual | Forecast | Previous | Revised |
|---|---|---|---|---|---|---|
| 23:50 | JPY | Industrial Production M/M Mar P | 3.80% | 3.40% | -0.60% | |
| 23:50 | JPY | Retail Trade Y/Y Mar | 1.20% | 2.20% | 4.70% | |
| 23:30 | JPY | Unemployment Rate Mar | 2.60% | 2.50% | 2.60% | |
| 01:00 | NZD | ANZ Business Confidence Apr | 14.9 | 22.9 | ||
| 01:30 | AUD | Retail Sales M/M Mar | -0.40% | 0.20% | 0.30% | |
| 01:30 | AUD | Private Sector Credit M/M Mar | 0.30% | 0.40% | 0.50% | |
| 01:30 | CNY | NBS Manufacturing PMI Apr | 50.4 | 50.4 | 50.8 | |
| 01:30 | CNY | NBS Non-Manufacturing PMI Apr | 51.2 | 52.2 | 53 | |
| 01:45 | CNY | Caixin Manufacturing PMI Apr | 51.4 | 51 | 51.1 | |
| 05:00 | JPY | Housing Starts Y/Y Mar | -12.80% | -7.60% | -8.20% | |
| 05:30 | EUR | France Consumer Spending M/M Mar | 0.40% | 0.10% | 0.00% | |
| 05:30 | EUR | France GDP Q/Q Q1 P | 0.20% | 0.20% | 0.10% | |
| 06:00 | EUR | Germany Import Price Index M/M Mar | 0.40% | 0.10% | -0.20% | |
| 06:00 | EUR | Germany Retail Sales M/M Mar | 1.80% | 1.30% | -1.90% | |
| 07:00 | CHF | KOF Leading Indicator Apr | 101.8 | 101.7 | 101.5 | 100.4 |
| 07:55 | EUR | Germany Unemployment Change Apr | 10K | 7K | 4K | |
| 07:55 | EUR | Germany Unemployment Rate Apr | 5.90% | 5.90% | 5.90% | |
| 08:00 | EUR | Italy GDP Q/Q Q1 P | 0.30% | 0.20% | 0.20% | |
| 08:00 | EUR | Germany GDP Q/Q Q1 P | 0.20% | 0.10% | -0.30% | |
| 08:30 | GBP | M4 Money Supply M/M Mar | 0.70% | 0.40% | 0.50% | 0.60% |
| 08:30 | GBP | Mortgage Approvals Mar | 61K | 61K | 60K | |
| 09:00 | EUR | Eurozone GDP Q/Q Q1 P | 0.30% | 0.10% | 0.00% | |
| 09:00 | EUR | Eurozone CPI Y/Y Apr P | 2.40% | 2.40% | 2.40% | |
| 09:00 | EUR | Eurozone CPI CoreY/Y Apr P | 2.70% | 2.60% | 2.90% | |
| 12:30 | CAD | GDP M/M Feb | 0.20% | 0.30% | 0.60% | 0.50% |
| 12:30 | USD | Employment Cost Index Q1 | 1.20% | 1.00% | 0.90% | |
| 13:00 | USD | S&P/CS Composite-20 HPI Y/Y Feb | 7.30% | 6.70% | 6.60% | |
| 13:00 | USD | Housing Price Index M/M Feb | 1.20% | 0.10% | -0.10% | |
| 13:45 | USD | Chicago PMI Apr | 45.2 | 41.4 | ||
| 14:00 | USD | Consumer Confidence Apr | 104 | 104.7 |
Canada’s GDP grows 0.2% mom in Feb, vs exp. 0.3% mom
Canada's GDP grew 0.2% mom in February, below expectation of 0.3% mom. Services-producing industries (+0.2%) led the growth for a second month in a row. Goods-producing industries aggregate was essentially unchanged. Overall, 12 of 20 sectors increased in the month.
Advance information indicates that real GDP was essentially unchanged in March. That suggests the economy expanded 0.6% in the first quarter of 2024.
ECB’s de Cos: Rate cut appropriate in June if inflation outlook maintained
ECB Governing Council member Pablo Hernandez de Cos highlighted that despite the positive trend in declining inflation rates, outlook is clouded by rising energy costs, persistent high inflation in the services sector, and ongoing geopolitical tensions.
He expected that inflation would continue to decrease in the upcoming quarters, albeit at a slower pace than previously observed due to certain upward base effects.
"The ECB's governing council considers that if this inflation outlook is maintained, it would be appropriate to start reducing the current level of monetary policy tightening in June."
EUR/USD: Sideways Within a Medium-Term Downtrend
- Eurozone preliminary core CPI rate for April continued to inch lower at 2.7% y/y, its slowest pace of inflationary pressure since February 2022.
- 2-year and 10-year Eurozone sovereign bonds/US Treasuries yield spread discounts have continued to widen which supports a potential medium to long-term bearish trend on the EUR/USD.
- Watch the 1.0740 key short-term resistance on the EUR/USD ahead of the Fed’s monetary policy decision on 1 May.
Since its December 2023 high of 1.1140, the EUR/USD has traded lower in the past four months with an accumulated decline of -4.8% (-538 pips) and looks set to end this month of April with a negative footing, potentially a lower monthly closing level (traded at 1.0697 at this time of the writing below last month, March monthly closed level of 1.0790).
The key primary fundamental factor that is likely to determine the directional bias of the EUR/USD in the medium to long-term horizons is the path of inflationary trends in the Eurozone and the US which in turn dictates the monetary policy decisions and guidance of the two major developed nations central banks, the European Central Bank, and the US Federal Reserve.
Fundamentals are supporting a weaker EUR/USD in the medium to long-term horizon
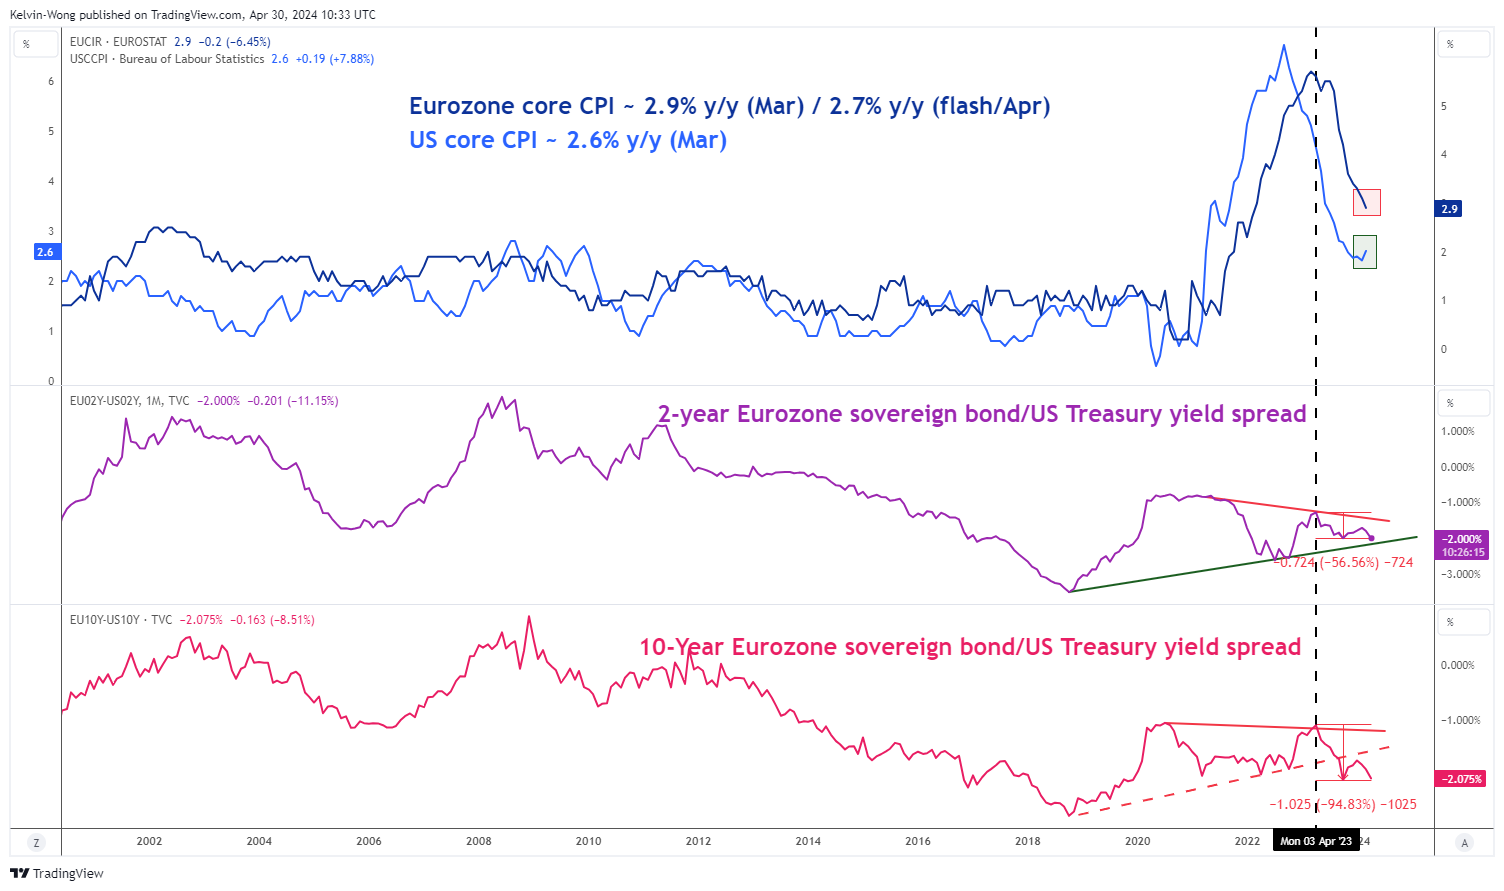
Fig 1: Eurozone, US inflationary trends with yield spreads of Eurozone sovereign bonds /US Treasuries as of 30 Apr 2024 (Source: TradingView, click to enlarge chart)
In comparing inflationary trends, the pace of change is more important than the absolute change levels. In March, the Eurozone core CPI rate (excluding food and energy) stood at 2.9% y/y which is higher in absolute terms versus the US core CPI rate of 2.6% y/y recorded in March.
On closer inspection, the trend of the US core CPI rate has inched higher from its prior month of February from 2.4% y/y to 2.6% y/y. In contrast, the trend of the Eurozone core CPI continued to decelerate in the past three months; January (3.3% y/y), February (3.1% y/y), March (2.9% y/y), and it continued to inch lower in April with a preliminary reading of 2.7% y/y, Eurozone’s slowest pace of inflationary pressure since February 2022.
Therefore, the odds of the first ECB interest rate to come in June or July have been rising whereas else the highly anticipated Fed dovish pivot narrative at the start of the year has evaporated with the expected first Fed funds rate being pushed back continuously from March (at the start of the year) to now September (based in latest data from CME FedWatch tool as of 29 April 2024) due to a sticky and elevated inflationary trend in the US.
A less potentially less dovish Fed over its ECB counterpart can be expressed via the sentiment inferred from market-based transacted financial instruments through the yield spread of the Eurozone sovereign bonds and US Treasuries.
Both the 2-year and 10-year Eurozone sovereign bond/US Treasury yield spread discount has widened over the past year since April 2023; more pronounced on the 10-year where its discount spread has widened more by around 100 bps versus 70 bps seen on the 2-year discount spread.
The further widening trend of the 10-year Eurozone sovereign bond/US Treasury yield spread discount suggests the long-term inflationary and economic growth trends in the Eurozone are likely to be in a softer tone versus the US which in turn supports a weaker EUR over the US dollar.
EUR/USD continued to trade sideways in the short-term
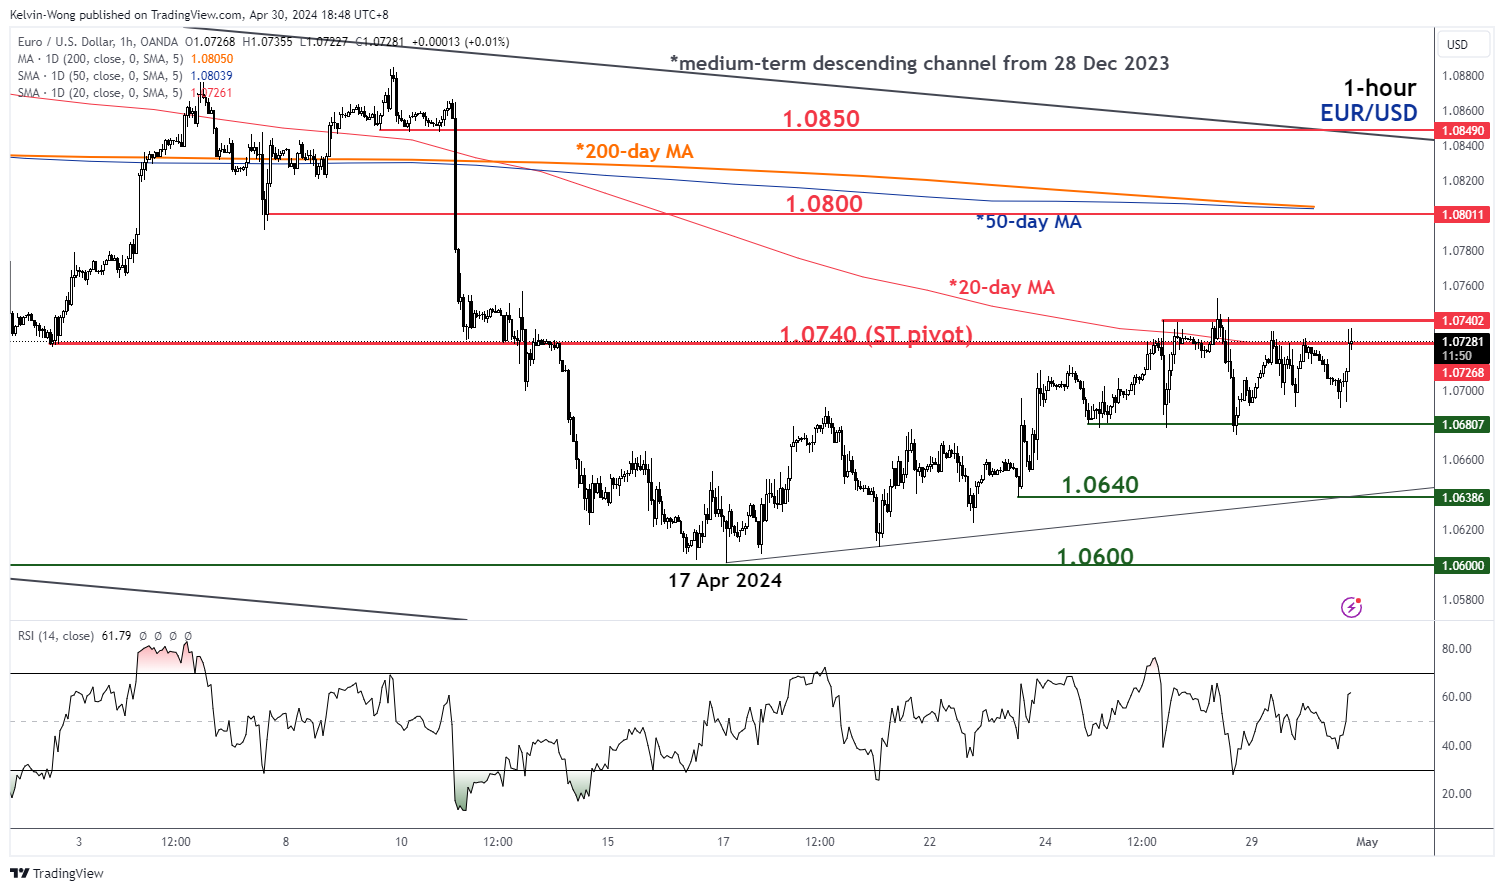
Fig 2: EUR/USD minor trend as of 30 Apr 2024 (Source: TradingView, click to enlarge chart)
Since its recent bounce of +1.4% (152 pips) from its 17 April 2024 low of 1.0601, the EUR/USD has been trading in a minor sideways range configuration near its 20-day moving average acting as a first roadblock against the bulls in the past four sessions as market participants wait for the upcoming US Fed’s monetary policy decision on 1 May with the main focus on Fed Chair Powell’s press conference.
In the lens of technical analysis, watch the key short-term pivotal resistance at 1.0740 (close to the 20-day moving average) and a break below 1.0680 near-term support may trigger renewed weakness on the EUR/USD to expose the next intermediate supports at 1.0640 and 1.0600 in the first step.
On the flip side, a clearance above 1.0740 sees the potential continuation of the short-term corrective countertrend rebound for the next intermediate resistances to come in at 1.0800 (the 50-day & 200-day moving averages) and 1.0850 (also the upper boundary of the medium-term descending channel from 28 December 2023 swing high).