Sample Category Title
EUR/USD: Sideways Within a Medium-Term Downtrend
- Eurozone preliminary core CPI rate for April continued to inch lower at 2.7% y/y, its slowest pace of inflationary pressure since February 2022.
- 2-year and 10-year Eurozone sovereign bonds/US Treasuries yield spread discounts have continued to widen which supports a potential medium to long-term bearish trend on the EUR/USD.
- Watch the 1.0740 key short-term resistance on the EUR/USD ahead of the Fed’s monetary policy decision on 1 May.
Since its December 2023 high of 1.1140, the EUR/USD has traded lower in the past four months with an accumulated decline of -4.8% (-538 pips) and looks set to end this month of April with a negative footing, potentially a lower monthly closing level (traded at 1.0697 at this time of the writing below last month, March monthly closed level of 1.0790).
The key primary fundamental factor that is likely to determine the directional bias of the EUR/USD in the medium to long-term horizons is the path of inflationary trends in the Eurozone and the US which in turn dictates the monetary policy decisions and guidance of the two major developed nations central banks, the European Central Bank, and the US Federal Reserve.
Fundamentals are supporting a weaker EUR/USD in the medium to long-term horizon
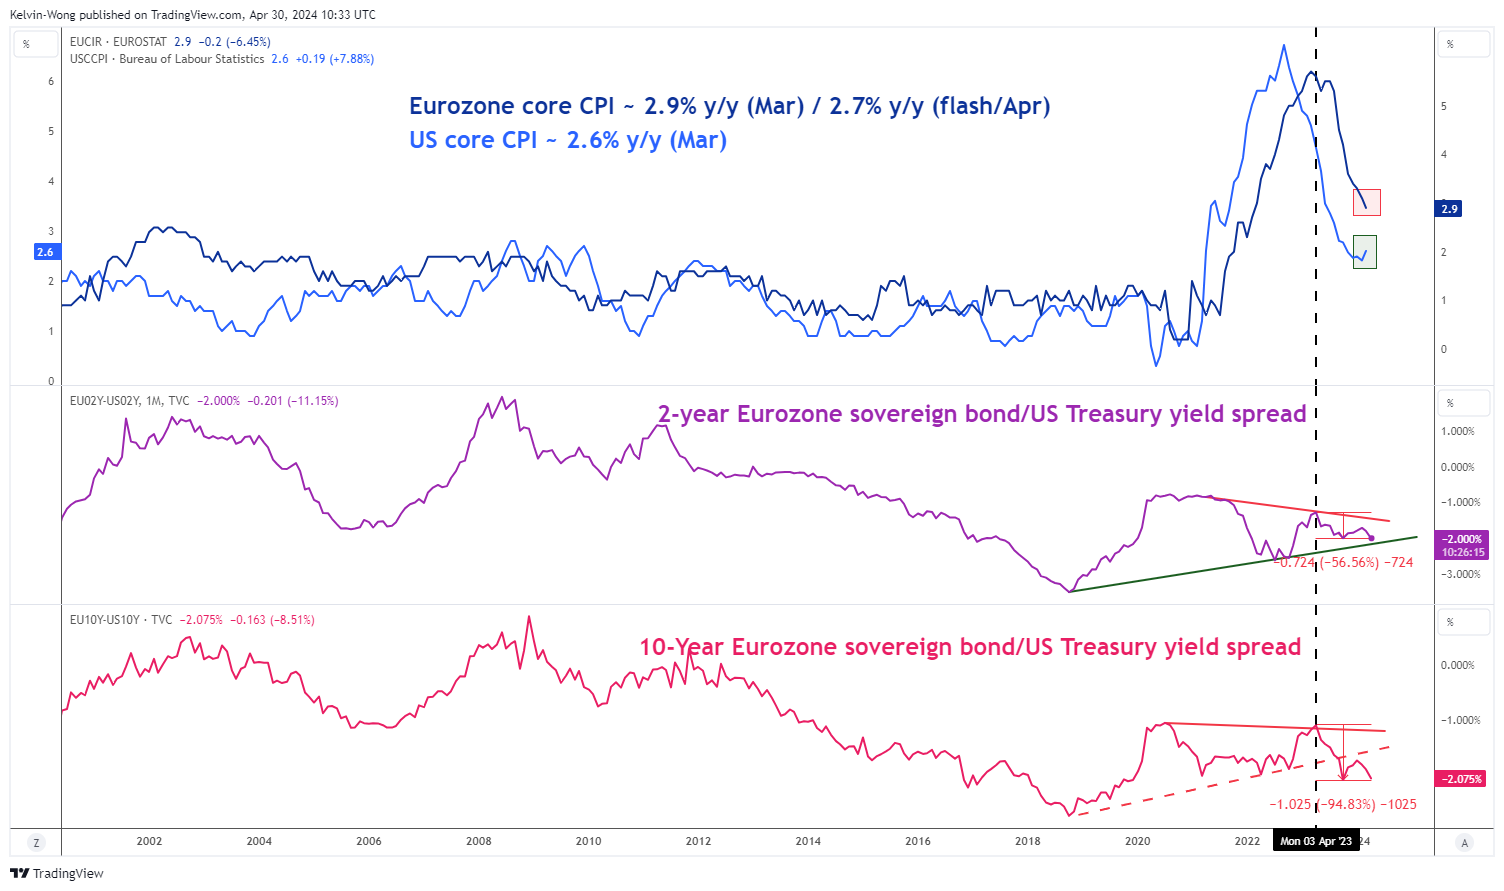
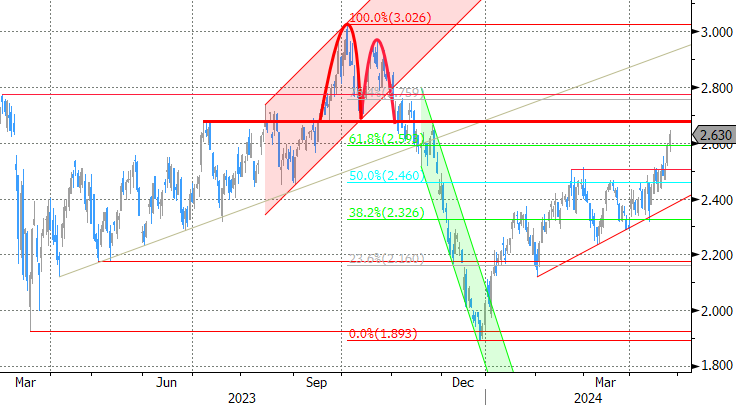
Fig 1: Eurozone, US inflationary trends with yield spreads of Eurozone sovereign bonds /US Treasuries as of 30 Apr 2024 (Source: TradingView, click to enlarge chart)
In comparing inflationary trends, the pace of change is more important than the absolute change levels. In March, the Eurozone core CPI rate (excluding food and energy) stood at 2.9% y/y which is higher in absolute terms versus the US core CPI rate of 2.6% y/y recorded in March.
On closer inspection, the trend of the US core CPI rate has inched higher from its prior month of February from 2.4% y/y to 2.6% y/y. In contrast, the trend of the Eurozone core CPI continued to decelerate in the past three months; January (3.3% y/y), February (3.1% y/y), March (2.9% y/y), and it continued to inch lower in April with a preliminary reading of 2.7% y/y, Eurozone’s slowest pace of inflationary pressure since February 2022.
Therefore, the odds of the first ECB interest rate to come in June or July have been rising whereas else the highly anticipated Fed dovish pivot narrative at the start of the year has evaporated with the expected first Fed funds rate being pushed back continuously from March (at the start of the year) to now September (based in latest data from CME FedWatch tool as of 29 April 2024) due to a sticky and elevated inflationary trend in the US.
A less potentially less dovish Fed over its ECB counterpart can be expressed via the sentiment inferred from market-based transacted financial instruments through the yield spread of the Eurozone sovereign bonds and US Treasuries.
Both the 2-year and 10-year Eurozone sovereign bond/US Treasury yield spread discount has widened over the past year since April 2023; more pronounced on the 10-year where its discount spread has widened more by around 100 bps versus 70 bps seen on the 2-year discount spread.
The further widening trend of the 10-year Eurozone sovereign bond/US Treasury yield spread discount suggests the long-term inflationary and economic growth trends in the Eurozone are likely to be in a softer tone versus the US which in turn supports a weaker EUR over the US dollar.
EUR/USD continued to trade sideways in the short-term
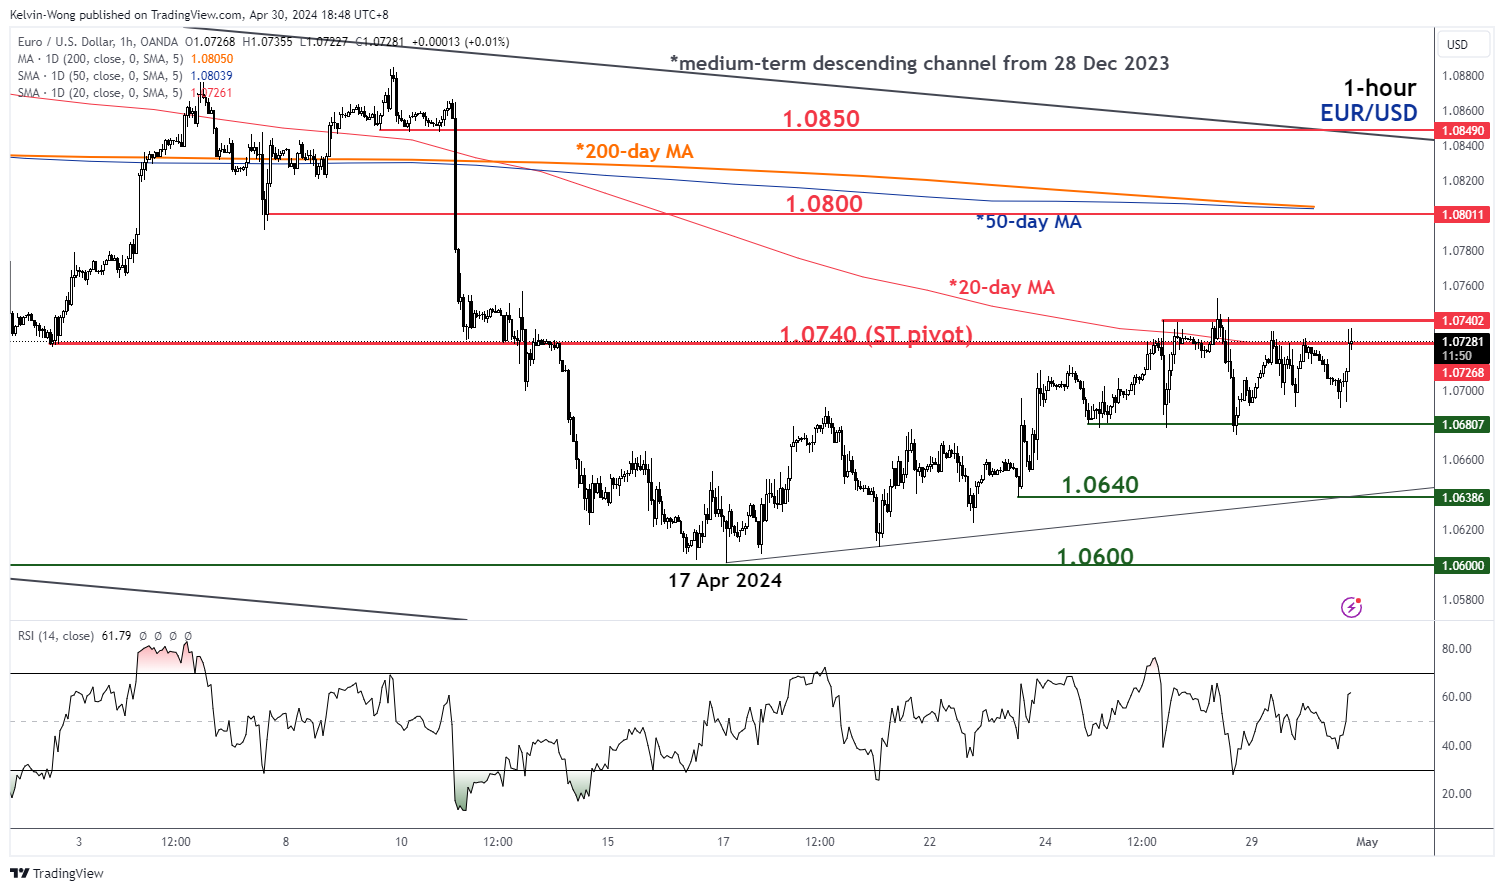
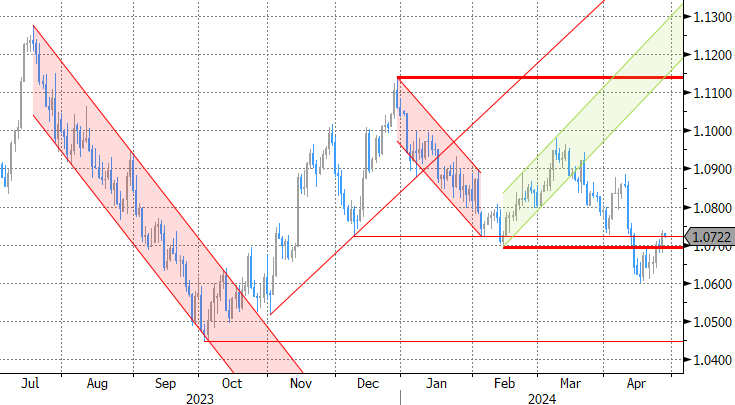
Fig 2: EUR/USD minor trend as of 30 Apr 2024 (Source: TradingView, click to enlarge chart)
Since its recent bounce of +1.4% (152 pips) from its 17 April 2024 low of 1.0601, the EUR/USD has been trading in a minor sideways range configuration near its 20-day moving average acting as a first roadblock against the bulls in the past four sessions as market participants wait for the upcoming US Fed’s monetary policy decision on 1 May with the main focus on Fed Chair Powell’s press conference.
In the lens of technical analysis, watch the key short-term pivotal resistance at 1.0740 (close to the 20-day moving average) and a break below 1.0680 near-term support may trigger renewed weakness on the EUR/USD to expose the next intermediate supports at 1.0640 and 1.0600 in the first step.
On the flip side, a clearance above 1.0740 sees the potential continuation of the short-term corrective countertrend rebound for the next intermediate resistances to come in at 1.0800 (the 50-day & 200-day moving averages) and 1.0850 (also the upper boundary of the medium-term descending channel from 28 December 2023 swing high).
Another Dip in Crypto Capitalization
Market picture
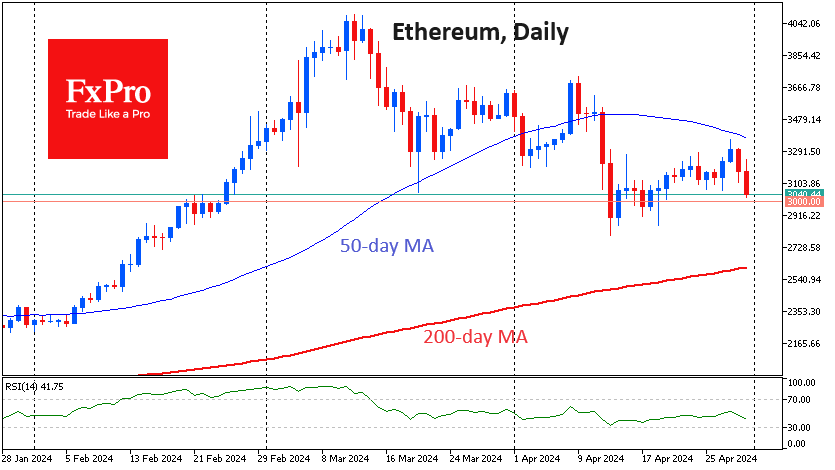
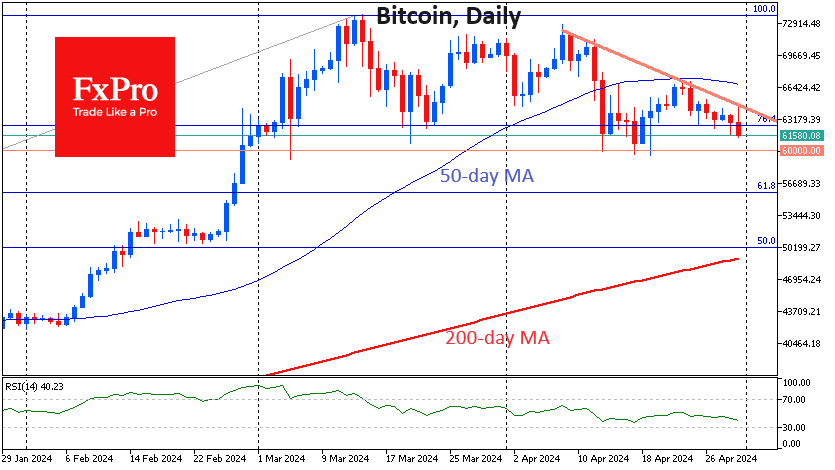
The crypto market capitalisation decreased by another 1.5% to $2.27 trillion, getting closer and closer to the April lows just above $2.22 trillion. Contrary to expectations, after the halving, the pressure on the market increased, in full accordance with the adage “buy the rumour, sell the news”.
It seems that the strongest altcoins started to give up. Ethereum and Solana are both losing about 4% each in the last 24 hours – higher than most of the top altcoins.
Bitcoin is losing 1.5% to $61.6K, reversing sharply to the downside as active Asian trading begins. This reversal also coincides with downside resistance that has been in place since 8 April.
According to CoinShares data, crypto fund investments decreased $435M last week after outflows of $206M the week before; this is the third consecutive week of outflows. Bitcoin investments were down $423M, Ethereum investments were down $38M, and Solana investments were up $4M.
The bulk of the outflows (totalling $440M) came from Grayscale’s Bitcoin fund. At the same time, the inflow of funds to other bitcoin-ETFs fell sharply, while a wide range of altcoins saw an inflow of investments, CoinShares noted.
News background
The slowdown in inflows into bitcoin-ETFs may be short-lived before BTC resumes its rally toward $150,000, Bernstein expects. It’s a short-term pause before ETFs become more integrated with the platforms of private banks, wealth advisers and brokers.
A crypto analyst under the pseudonym TechDev said bitcoin, despite a temporary decline, is poised to repeat the parabolic rally of November 2020 and soar nearly 120 per cent.
Bloomberg reported on the possible approval of a spot bitcoin-ETF in Australia by the end of 2024. Australian pension funds with $2.3 trillion in assets may be interested in the product.
According to Visa, the USDC stablecoin has overtaken the segment leader, Tether’s USDT, in terms of the number of transactions per month. At the same time, USDT capitalisation is more than three times ahead of USDC.
USD/JPY Stabilizes After Roller-Coaster Monday
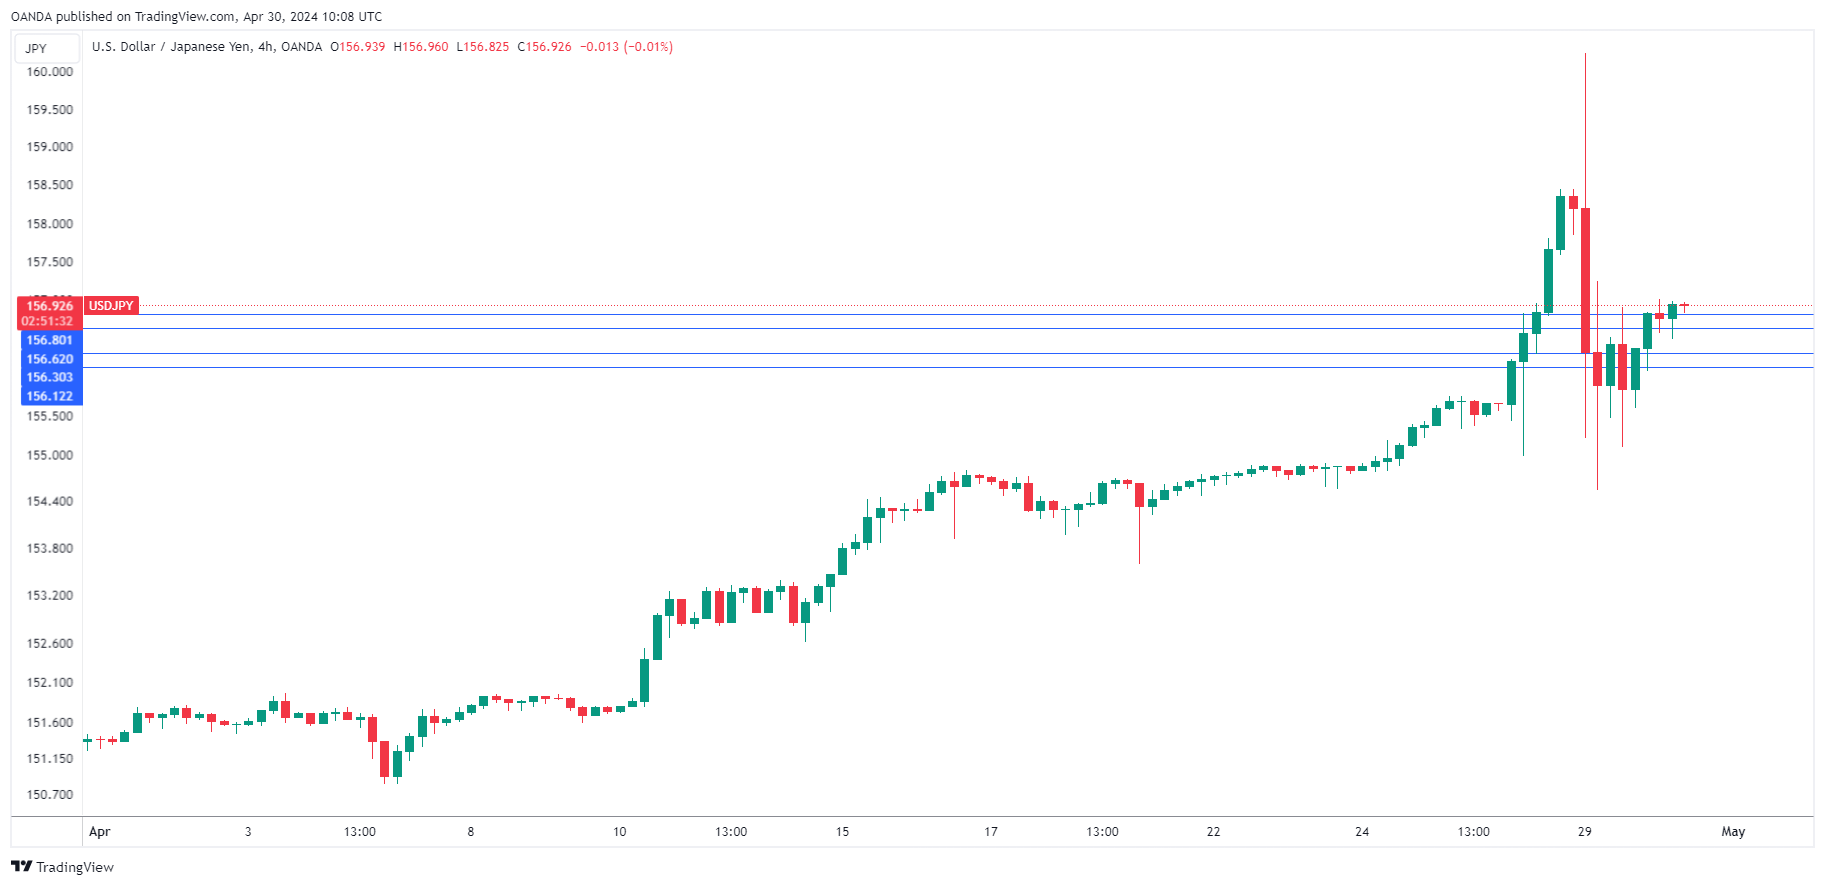
The Japanese yen is lower on Tuesday. In the European session, USD/JPY is trading at 156.88, up 0.34%.
It has been a relatively quiet day for the yen after massive movement over the past two days. On Friday dollar-yen jumped 1.7% and broke above 158, but the real drama unfolded on Monday, when the yen went on a wild ride that saw it swing more than 550 basis points. The yen fell as low as 160.23 but then recovered and closed at 156.30, gaining 1.25% on the day.
Yen slips below 160 – was it invention?
What caused the huge spike? Japanese markets were closed on Monday and trading algorithms in thin liquidity could have accounted for the swing. Still, in the current environment of the yen losing ground fast, intervention by Tokyo was also suspected. Adding to the intrigue was the refusal of the Ministry of Finance (MoF) to comment whether it had intervened in the market. We won’t know for sure if the MoF did step in until next month, when details of any intervention will be released.
The MoF intervened in September and October 2022 in the order to prop up the yen, but the moves didn’t have a long-lasting effect and it’s questionable whether another intervention would be any different. Still, Tokyo doesn’t want to stand idly by as a plunging yen complicates its goal to achieve sustainable inflation.
The US/Japan rate differential remains wide and with the Fed signaling that it will delay rate hikes, the yen is unlikely to show much improvement without intervention. Investors will be on the alert for an intervention if the yen continues to lose ground.
USD/JPY Technical
- USD/JPY has pushed above resistance at 156.62 and 156.80. Above, there is resistance at 157.30
- There is support at 156.30 and 156.12
Will AUDUSD Exit the Range Again?
- AUDUSD comes under selling interest this week
- But stays within sideways range
- A break below 0.6485 may turn the outlook bearish
- For the picture to brighten, a move above 0.6615 may be needed
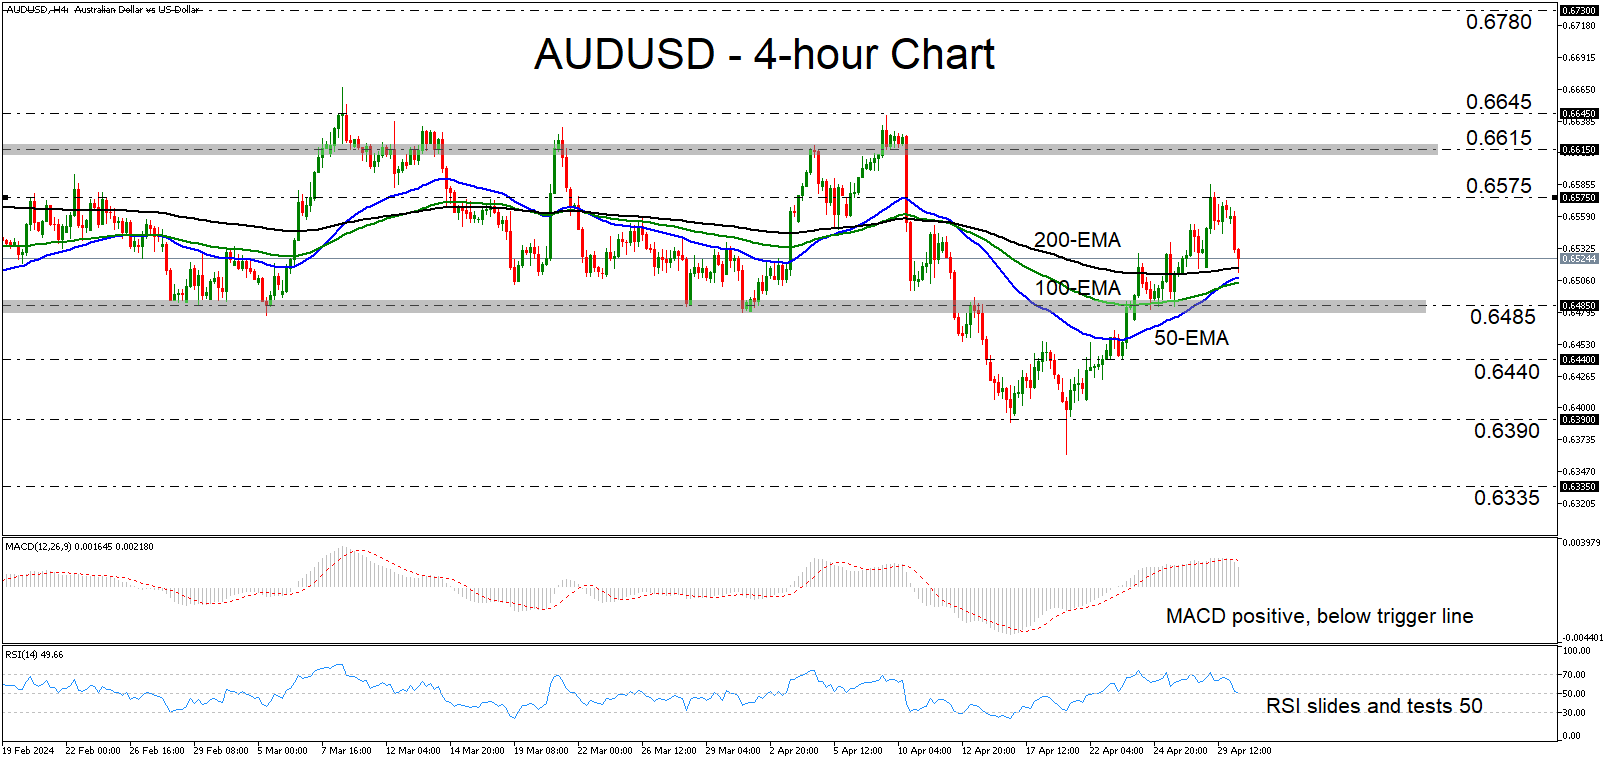
AUDUSD was sold this week, after the bulls struggled to overcome the 0.6575 barrier. In the bigger picture, the pair is trading back within the sideways range that has been containing most of the price action since mid-January and thus, the outlook remains neutral.
The MACD lies well above zero, but it has already crossed below its trigger line and is pointing down, while the RSI has slid and seems ready to challenge its equilibrium barrier of 50. Both indicators detect weakening upside momentum, which means that more bears may jump into the action soon.
That said, for the outlook to turn back bearish, AUDUSD may need to clearly break below 0.6485, the lower boundary of the aforementioned sideways range. Such a dip may initially pave the way towards the 0.6440 zone, marked by the low of April 23, the break of which could carry extensions towards the 0.6390 territory, defined as support by the low of April 16.
On the upside, a break above 0.6615, the upper end of the range, is likely to be needed for the picture to brighten. If the bulls are strong enough to accomplish that, they may find immediate resistance at 0.6645, where another break could open the path towards the 0.6780 zone, which acted as a ceiling between January 4 and 12.
To sum up, AUDUSD came under pressure lately, but it remains within the neutral sideways range between 0.6485 and 0.6615. For the outlook to change, traders may need to take the pair out of that range.
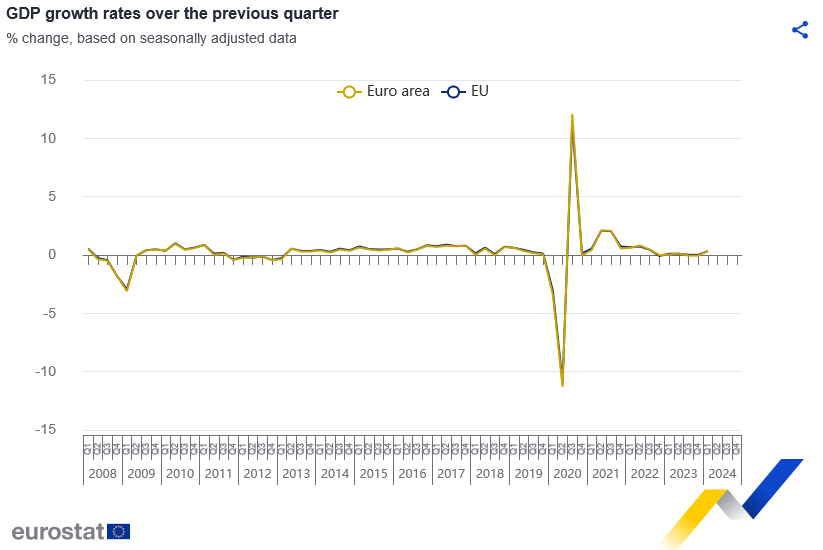
Eurozone GDP rises 0.3% qoq in Q1, above exp 0.1% qoq
Eurozone GDP grew 0.3% qoq, 0.4% yoy in Q1, better than expectation of 0.1% qoq, 0.2% yoy. EU GDP grew 0.3% qoq, 0.5% yoy.
Among the Member States for which data are available, Ireland (+1.1%) recorded the highest increase compared to the previous quarter, followed by Latvia, Lithuania and Hungary (all +0.8%). Sweden (-0.1%) was the only Member State that recorded a decrease. The year on year growth rates were positive for nine countries and negative for four.
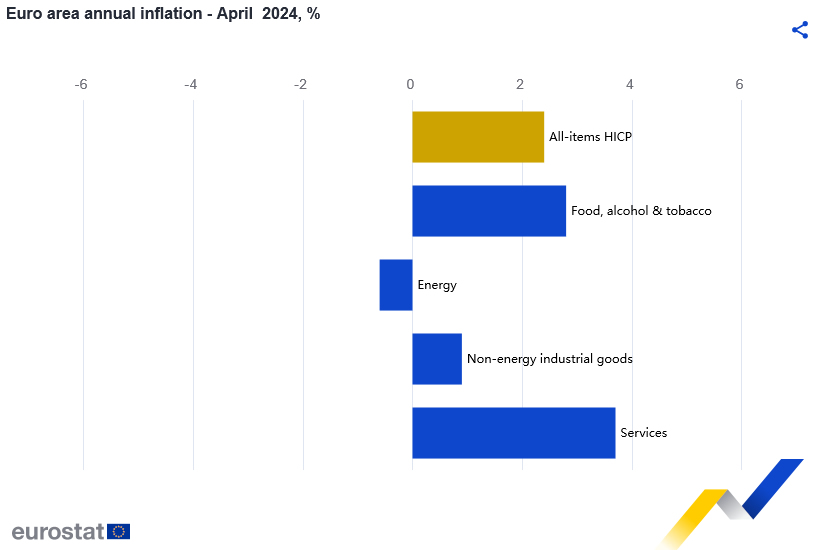
Eurozone CPI unchanged at 2.4% in Apr, core CPI down to 2.7%
Eurozone CPI was unchanged at 2.4% yoy in April, matched expectations. CPI core (energy, food, alcohol & tobacco) slowed from 2.9% yoy to 2.7% yoy, above expectation of 2.6% yoy.
Looking at the main components of euro area inflation, services is expected to have the highest annual rate in April (3.7%, compared with 4.0% in March), followed by food, alcohol & tobacco (2.8%, compared with 2.6% in March), non-energy industrial goods (0.9%, compared with 1.1% in March) and energy (-0.6%, compared with -1.8% in March).
EURJPY Seeks Calmness After Roller Coaster Day
- EURJPY stabilizes after Japan-driven volatile session
- Bears wait for action below the 167.20 support area
- Eurozone’s flash CPI inflation due at 09:00 GMT
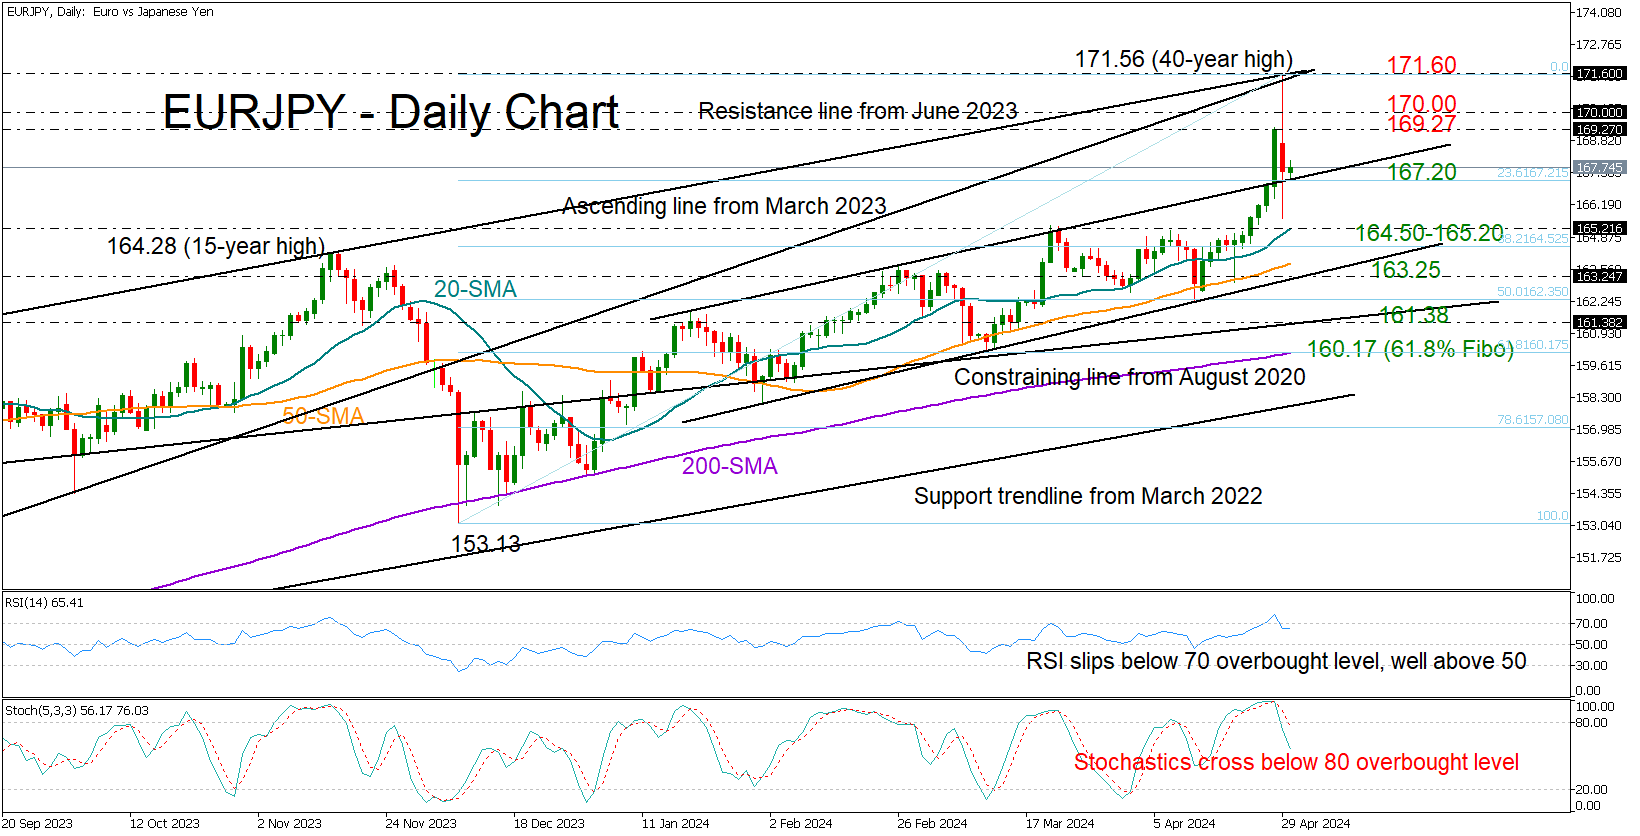
EURJPY rose rapidly to an almost 40-year high of 171.56 on Monday thanks to a suspected intervention from Japanese authorities. But the spike faded immediately, with the price diving to a low of 165.63 before closing the day near 167.54 in the aftermath.
Technically, the resistance line from June 2023, which led to the decline in November 2023, has once again hindered the aggressive bullish movement, increasing the likelihood of a downward reversal as both the RSI and stochastic oscillator have reached their peak in the overbought zone. Recall that the pair has been rising almost every single day since April 15. Hence, some stability would not be very surprising.
The broken January resistance line is assisting the 23.6% Fibonacci retracement of the December-April uptrend in buffering downside pressures near 167.20. If that floor cracks, the pair could slump towards its 20-day simple moving average (SMA) at 165.20 and perhaps test the 38.2% Fibonacci mark of 164.52 too. Then, the spotlight might fall on the 50-day SMA and the support trendline from February at 163.25, a break of which could see an extension towards the constraining ascending line from August 2020 at 161.38.
Alternatively, the bulls might strive to reach Friday’s closing price of 169.27. A successful outcome there could make the 170.00 psychological mark visible again, and if it’s easily broken, the pair could move towards the long-term resistance line at 171.60. The 175.00 round level could be the next target.
The possibility of EURJPY repeating Monday’s impressive rally is uncertain, but there could be ongoing upward pressures if the base at 167.20 holds.
GBPUSD Battles With 200-Day SMA
- GBPUSD rebounds strongly from a 5-month bottom
- But meets strong resistance at 200-day SMA
- Momentum indicators improve but remain neutral-to-negative
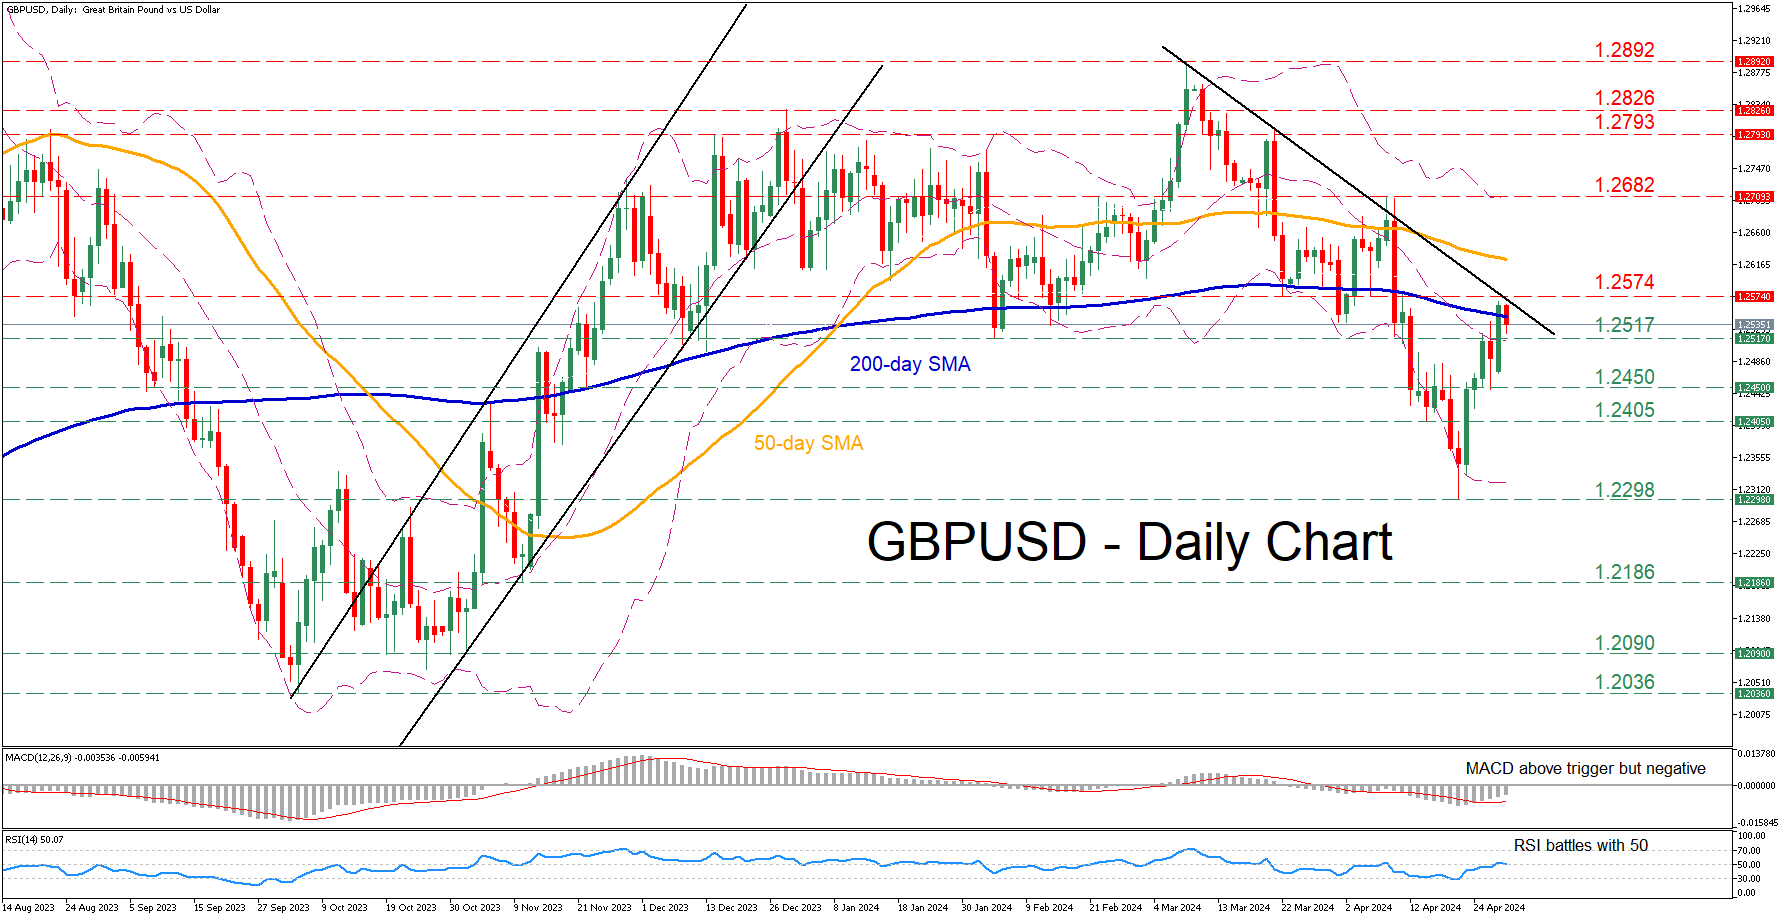
GBPUSD experienced a vast decline after posting a fresh 2024 high of 1.2892, generating a clear structure of lower highs and lower lows. Although the pair has been attempting a recovery in the past few sessions following its bounce off a fresh five-month bottom, the 200-day simple moving average (SMA) appears to be curbing its upside.
Should bullish pressures persist, the pair might test the March-April support of 1.2574, which could now serve as resistance. A break above that zone could pave the way for the April peak of 1.2682. Higher, the December resistance of 1.2793 could prove to be the next barricade for the bulls to overcome.
Alternatively, a downside move could meet initial support at the February bottom of 1.2517. Sliding beneath that region, the price may retreat towards 1.2450 ahead of the April support of 1.2405. Further declines could then cease at the five-month bottom of 1.2298.
In brief, GBPUSD has been attempting to recoup some losses after falling to its lowest level since November 2023. For the rebound to extend though, the pair needs to initially jump above the 200-day SMA.
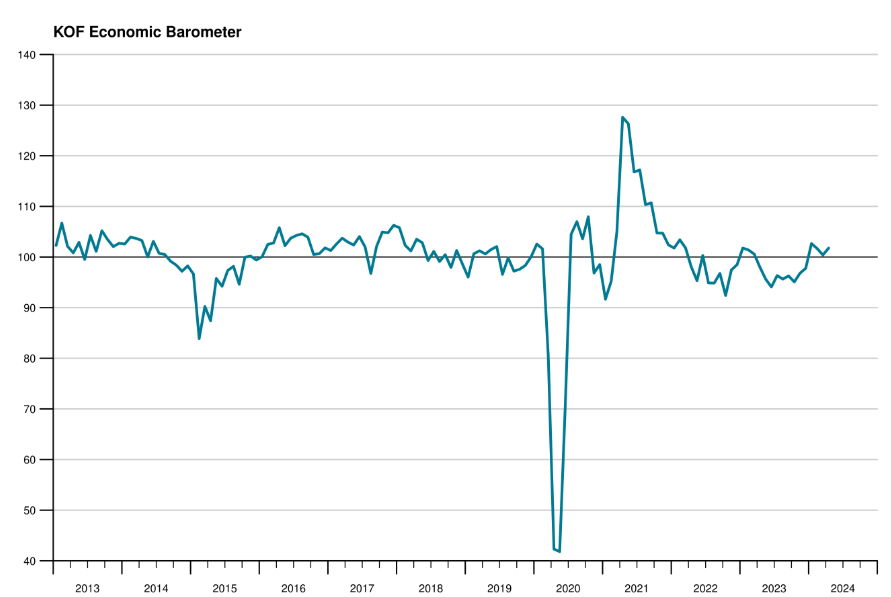
Swiss KOF rises to 101.8, stable economy, no strong boost in sight
Swiss KOF Economic Barometer rose from 100.4 to 101.8 in April, slightly above expectation of 101.7. This rise positions the barometer in a range that is slightly above average, suggesting a stable yet unspectacular outlook for Switzerland's economy.
According to the KOF Economic Institute, "The Swiss economic development is robust, but there is currently no strong boost in sight."
Overall economic outlook appears to be improving across several key sectors including financial and insurance services, manufacturing, and private consumption. Conversely, outlook for construction and hospitality industries presents a less optimistic picture.
Core Bonds Gained Ahead of a Busy Week
Markets
Core bonds gained ahead of a busy week. US yields dropped between 1.9 and 5.3 bps with the long end outperforming. The US Treasury unexpectedly lifted its quarterly borrowing estimate by $41bn compared to its January estimate (cf. infra). While only temporary, the small yield spike it triggered at the long end of the curve does reveal some market sensitivity to the matter. German rate declines were about the same, ranging from 2.6 (2y) to 4.5 bps (30y). Inflation readings from the likes of Spain, Belgium and Germany do not call into question the ECB’s intention to cut rates in June. But the fact that inflation reaccelerated is testament to the bumpy road ahead that limits the central bank’s operating room in the months thereafter. ECB’s Wunsch was the latest to warn against back-to-back rate cuts with his Dutch colleague later referring to the US inflation experience showing the need to be vigilant. Currency investors were of course eyeballing JPY graphs all day. The yen gained more than a percent against the euro and the dollar on what is presumed to have been an intervention but did close well below the highest levels of the day. USD/JPY finished at 156.35 compared to an intraday low of 154.54. EUR/USD appreciated from 1.0693 to 1.0721. Sterling did very well but that had probably more to do with USD and EUR spillover moves in the JPY combination rather than genuine GBP strength. Either way, EUR/GBP slid towards 0.853.
Yesterday’s national inflation readings culminate in the European figure today. Risks are slightly skewed to the upside but the deviation from consensus, if any, should be small. Q1 GDP EMU growth is also being readied for release. French just printed a bigger-than-expected 0.2% q/q outcome, adding to the belief that the European economy as a whole is recovering from a winter recession (Q4 figure was revised downwards to -0.1% q/q). But neither CPI nor GDP is probably going to leave a big stamp on (European) markets ahead of a public holiday tomorrow and the FOMC meeting though. The policy statement and chair Powell are expected to sound a lot less confident about inflation’s return towards 2% after the recent string of data. That would contrast sharply with the previous time around but is more or less priced in by US (money) markets. The latter assume one rate hike this year with split opinions on a second one. It means the bar for yields at the front end to rise further (eg. 2y beyond 5%) is high and probably requires Powell to bring back rate hikes on the table. That’s not our base scenario for the time being. The long end continues to be the most vulnerable part. The US dollar holds the upper hand this morning but trades with technically insignificant gains.
News & Views
The US Treasury yesterday its quarterly borrowing estimates for Q2 and Q3. During the April-June quarter, the Treasury expects to borrow $243bn, assuming an end-of-June cash balance of $750bn. That’s $41bn more than announced in January, largely due to lower cash receipts, partially offset by a higher beginning of quarter cash balance ($775bn instead of $760bn). During the July-September quarter, Treasury expects to borrow $847bn assuming an end-of-September cash balance of $850bn. Additional financing details relating to the Treasury’s quarterly refunding will be released on Wednesday.
UK shop price inflation slowed further in April, from 1.3% Y/Y to 0.8% Y/Y, the slowest pace since December 2021. The British Retail Consortium reported that non-food inflation entered deflation (-0.6% Y/Y from +0.2%) while food inflation slowed to 3.4% Y/Y (from 3.7%). Non-food prices fell especially in clothing and footwear where retailers ramped up promotions to encourage consumer spend. CEO of the BRC, Helen Dickinson, said that "while consumers will welcome the lower shop price inflation, geopolitical tensions and the knock-on impact on commodity prices, like oil, pose a threat to future price stability. Retailers will continue to do all they can to keep prices down, but government has a role to play with pro-growth policies that allow businesses to invest in the customer offer."
Graphs
GE 10y yield
ECB President Lagarde clearly hinted at a summer (June) rate cut and has broad backing. EMU disinflation will continue in April and bring headline CPI (temporarily) at/below the 2% target. Together with weak growth momentum, this gives backing to deliver a first 25 bps rate cut. A more bumpy inflation path in H2 2024 and the Fed’s higher for longer strategy make follow-up moves difficult. Markets come to terms with that, pushing yields up.
US 10y yield
The March dot plot contained several hawkish elements including a symbolically higher neutral rate. In our view they set the stage for a later (September at the earliest, likely December) start of a possibly shallower cutting cycle. Upcoming CPI readings (through base effects) and resilient eco data should confirm this. US yields continue their uptrend across the maturity spectrum, setting fresh YTD highs.
EUR/USD
Economic divergence (US > EMU) and a likely desynchronized rate cut cycle with the ECB exceptionally taking the lead pulled EUR/USD towards the previous YTD low at 1.0695. Stronger-than-expected US March inflation figures forced a technical break. Last year’s low at 1.0494 looks vulnerable.
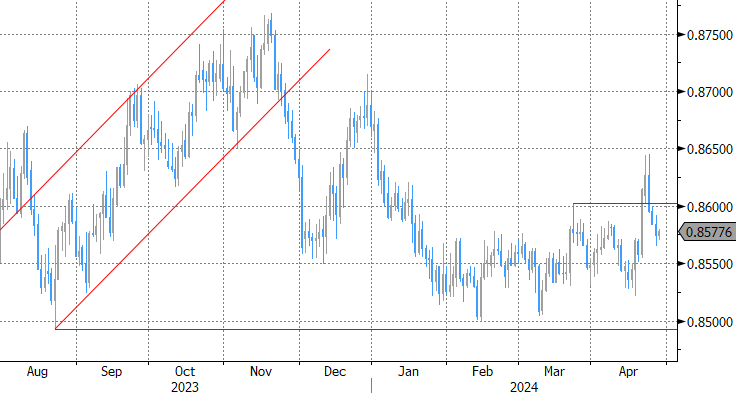
EUR/GBP
Debate at the Bank of England is focused at the timing of rate cuts. Most BoE members align with the ECB rather than with Fed view, suggesting that the disinflation process provides a window of opportunity to make policy less restrictive (in the near term). Sterling’s downside turned more vulnerable with the topside of the sideways EUR/GBP 0.8493 - 0.8768 trading range serving as the first real technical reference.