
Sample Category Title
Crude Oil Price Consolidate Gains Above Key Support
Key Highlights
- Crude oil started a downside correction from the $87.70 level.
- A connecting trend line is forming with support at $84.00 on the 4-hour chart.
- Gold prices might aim for a fresh increase above the $2,400 resistance zone.
- Bitcoin price consolidated below the $65,000 resistance zone.
Crude Oil Price Technical Analysis
After a steady increase above $84.80, Crude oil prices faced hurdles. The price traded as high as $87.70 before there was a downside correction.
Looking at the 4-hour chart of XTI/USD, there was a drop below the $86.50 and $85.50 support levels. However, the bulls were active above the $84.00 zone and the 100 simple moving average (red, 4-hour).
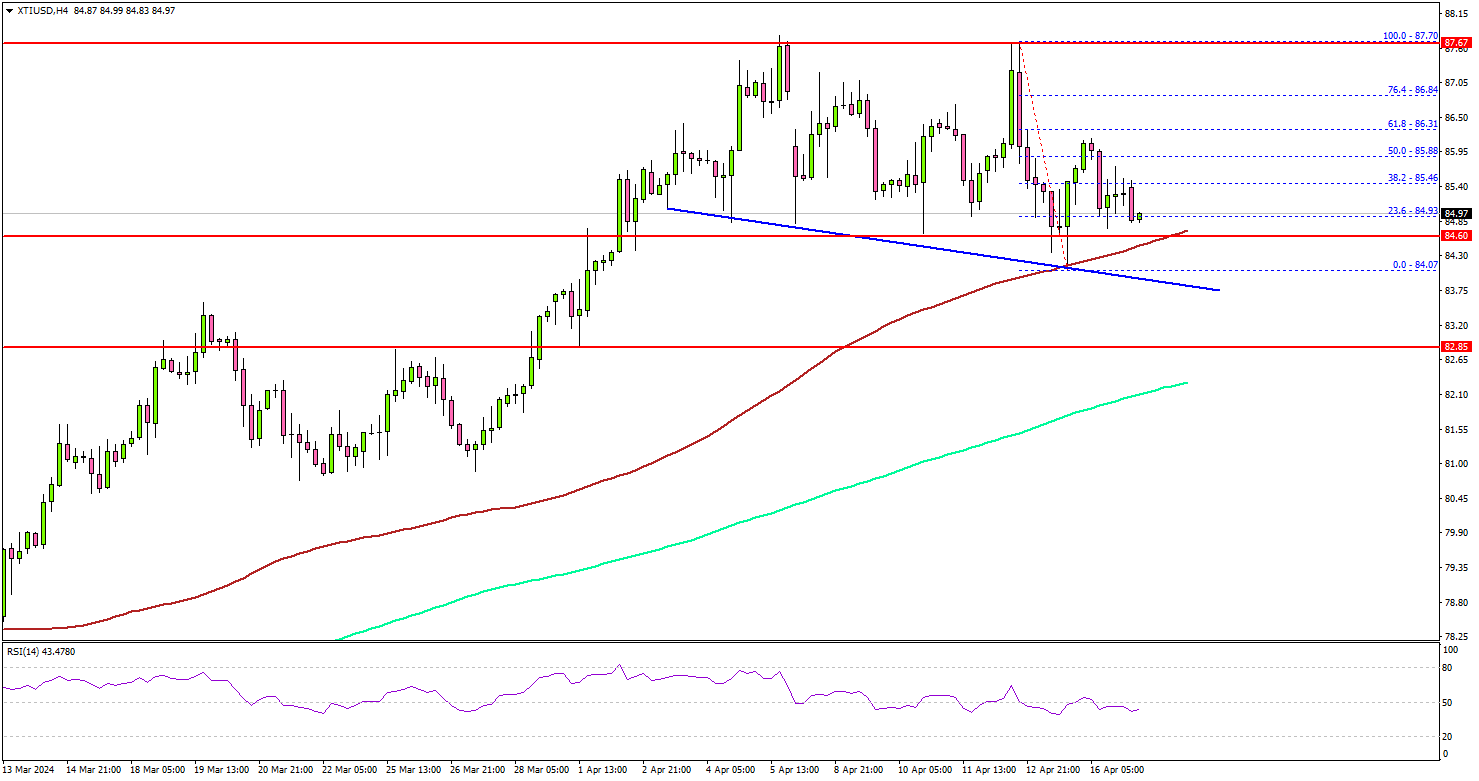
The price is now consolidating above the $84.00 support zone. There is also a connecting trend line forming with support at $84.00 on the same chart. On the upside, the price is facing hurdles near the $86.20 level.
The next major resistance is near the $86.50 zone, above which the price may perhaps accelerate higher. In the stated case, it could even visit the $87.70 resistance.
If not, the price might dip lower and test the $84.50 support. The first major support on the downside is near the $84.00 level and the trend line. The next major support is at $82.00 or the 200 simple moving average (green, 4-hour), below which the price might test $80.50. Any more losses might send oil prices toward $80.00.
Looking at Gold, the price remained stable above the $2,320 level and the bulls could now aim for a fresh increase above $2,400.
Economic Releases to Watch Today
- UK Consumer Price Index for March 2024 (YoY) – Forecast +3.1%, versus +3.4% previous.
- UK Core Consumer Price Index for March 2024 (YoY) – Forecast +4.1%, versus +4.5% previous.
- Euro Zone CPI for March 2024 (YoY) - Forecast +2.4%, versus +2.4% previous.
- Euro Zone CPI for March 2024 (MoM) - Forecast +0.8%, versus +0.8% previous.
Powell asserts Fed will hold rates steady if inflation persists
Fed Chair Jerome Powell acknowledged that recent economic data have not bolstered confidence in disinflation. He signaled the readiness to keep rates elevated for an extended period if inflationary pressure persists.
"Recent data have clearly not given us greater confidence that inflation is coming fully under control. Instead, they indicate that it's likely to take longer than expected to achieve that confidence," Powell said at a conference overnight. .
"Given the strength of the labor market and progress on inflation so far, it is appropriate to allow restrictive policy further time to work," he added.
"If higher inflation does persist, we can maintain the current level of interest rates for as long as needed," Powell noted.
BoE’s Bailey sees strong evidence of disinflation progress in UK
BoE Governor Andrew Bailey pointed to "strong evidence" that disinflation process is "working its way" through the UK economy, suggesting that the previous monetary tightening is having the intended effects.
"Our judgement with interest rates is how much do we need to see now to be confident of the process," Bailey stated at an IMF conference overnight, indicating that BoE is looking for further signs of sustained disinflation before considering any reductions in interest rates.
Bailey also drew distinctions between the inflation dynamics in the UK and those observed in the US. The UK is still navigating the aftermath of "big supply shocks", including those stemming from the global pandemic and geopolitical tensions, notably the war impacts. He contrasted this with the US, where there is a greater element of "demand-led inflation pressure".
NZ First Impressions: Consumers Price Index, Q1 2024
Consumer prices rose by 0.6% in the March quarter, leaving them up 4.0% over the past year. The total was a little below our forecast, but domestically-driven inflation remains surprisingly strong.
Consumers Price Index, March quarter 2024
- Consumer prices rose 0.6% in the March quarter, with prices up 4% over the past year.
- The result was a little below our forecast, but above the RBNZ’s last published projection.
- Imported inflation pressures are easing.
- However, domestic inflation pressures remain strong, and are much stronger than the RBNZ assumed. Non-tradables inflation is lingering at high levels long after the start of the RBNZ’s tightening cycle.
In the numbers
- Quarterly change: +0.6%
- Westpac forecast: +0.8%, RBNZ (Mar MPS): +0.4%
- Market median: +0.6%, range +0.4% to. +0.8%
- Annual change: +4.0%
- Westpac forecast: +4.2%, RBNZ (Nov MPS): +3.8%, Market: +4.0%
Non-tradables
- Quarterly change: +1.6%
- Westpac forecast: +1.4%, RBNZ (Mar MPS): +1.1%
- Annual change: +5.8%
Tradables
- Quarterly change: -0.7%
- Westpac forecast: -0.2%, RBNZ (Mar MPS): -0.8%
- Annual change: +1.6%
Discussion
Consumer prices rose by 0.6% in the March quarter. That saw the annual inflation rate dropping to 4.0%, down from 4.7% at the end of last year.
The result was below our forecast for a 0.8% rise.
The March quarter inflation result was above the RBNZ’s last published forecast for a 0.4% rise. However, the RBNZ’s forecast was finalised back in February (before the release of the monthly price data), and in its April policy review the RBNZ signalled they were already braced for a higher result.
However, the devil was in the detail.
The softness in today’s result was entirely due to lower tradable prices, with falls for items like used cars and apparel. That saw tradable prices falling 0.7% over the quarter, with annual tradables inflation falling from 3.0% at the end of 2023 to 1.6% now.
In contrast, non-tradables inflation was hotter than we or the RBNZ had expected. Non-tradable prices were up 1.6% over the quarter - higher than our own forecast (+1.4%) and much higher than the RBNZ’s forecast for a 1.1% rise. Upside surprises to our forecast were spread across the economy. On an annual basis, non-tradables inflation remains elevated at 5.8%. Notably, non-tradables excluding construction costs remains elevated at 6.3% and has eased only slightly since the RBNZ first raised the OCR back in 2021.
Core inflation measures have been dropping back, but remain elevated at rates of over 4%, consistent with lingering strength in domestic prices. Measures of domestic core inflation continue to hover around 6%.
In the detail
- Underpinning March’s lift in prices was a 6.5% rise in tobacco prices (related to the annual increase in tobacco prices).
- We also saw a solid 1.2% increase in housing rents.
- The cost of purchasing a newly built home was up 0.8% over the quarter. That’s much lower than seen over the past few years, but still a firm rise.
- We also saw firmness in recreational costs, including a large increase in overseas accommodation costs corresponding to the Taylor Swift concerts in Australia (aka. Swiftflation).
- On the downside, we saw sizeable falls in the prices of many imported items including used cars, fuel and apparel.
Implications
The divergence between the domestic and imported components of inflation illustrate the big concerns that the RBNZ is trying to balance. Inflation is coming down, and that will be important for stabilising inflation expectations.
However, domestic inflation is still running at rates that are much higher than the Monetary Policy Committee is comfortable with two years after the hiking cycle began. And it continues to look ‘sticky’. As a result, rate cuts won’t be on the table in the near term.
USDJPY Wave Analysis
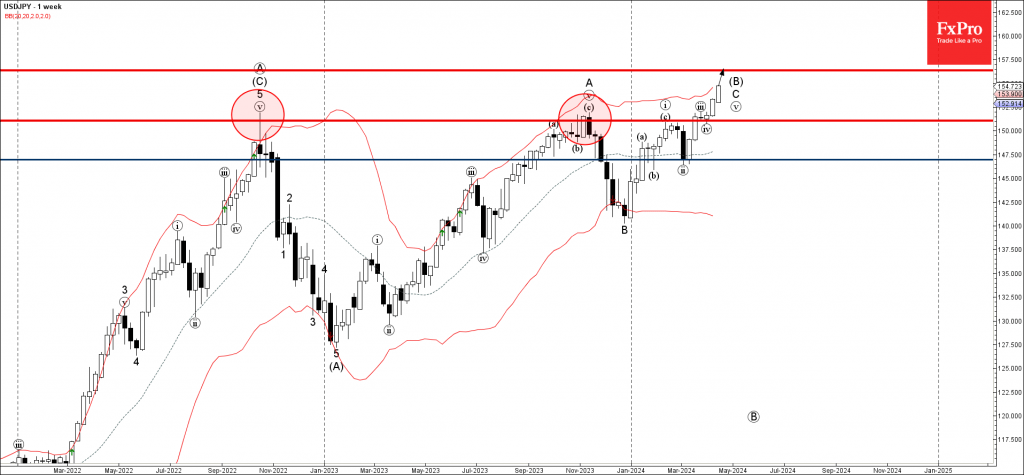
- USDJPY under the bullish pressure
- Likely to rise to resistance level 156.35
USDJPY currency pair under the bullish pressure after the earlier breakout of the major resistance level 151.80, former yearly high from 2022 and 2023.
The breakout of the resistance level 151.80 accelerated the C-wave of the active ABC correction (B) from the start of last year.
Given the clear multi-month uptrend and continued US dollar strength, USDJPY currency pair can be expected to rise further to the resistance level 156.35 (target price for the completion of the active C-wave).
Getting Ready for a Decline in Gold
Gold has been behaving erratically, having had a positive and negative correlation with global risk appetite in recent days.
On Friday, the price set an all-time high above $2430, losing $100 before the end of that day, nullifying the most furious final part of the rally within four hours. The final sell-off was in unison with the markets’ fall. But on Monday, the pressure in the stock markets intensified again, and gold moved higher.
Neither geopolitics nor fear of interest rate moves explain these shifts. Gold seems to be living its own world, in which geopolitics is used as a convenient explanation for the rise, and the rise of the dollar is used as an ex post facto explanation for the decline.
In our view, the price run-up on Thursday and Friday morning was so significant because it occurred in thin air territory after many days of making new highs and caught a wave of stop orders above $2400.
The impressive profit-taking at the end of the day on Friday had every chance of reversing the uptrend, which most often happens. However, the growth at the end of Monday raises doubts about such a straightforward development of events.
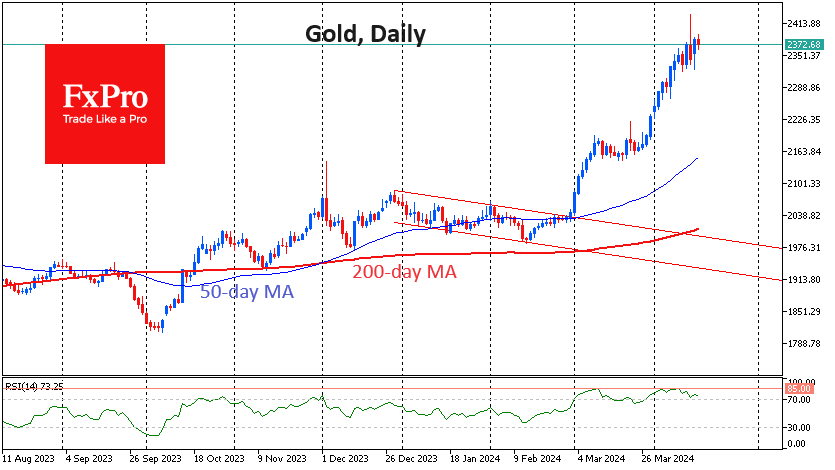
On the daily timeframes, the RSI index rolled back to 73, which is on the border with the overbought area, and recorded two peaks near 85 in March and April. A further pullback to the area below 70 would be a harbinger of a broad correction.
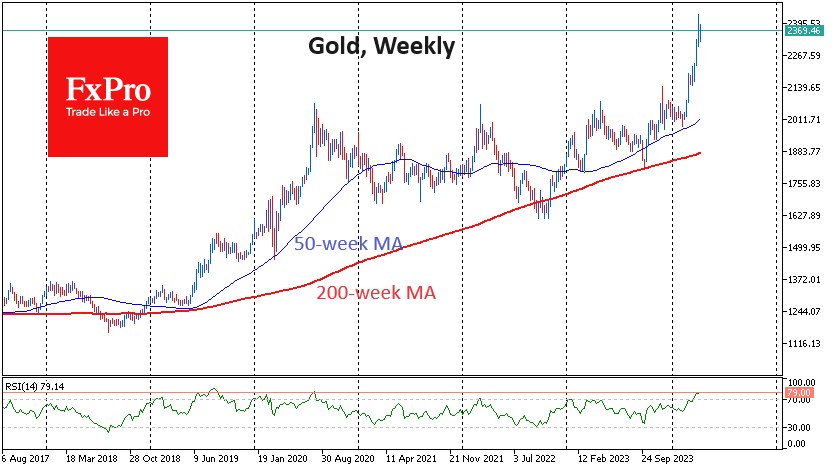
On the weekly timeframes, the RSI is above 79, an overbought area that gold has touched only five times since 1980, and each time, it has been followed by a correction or the start of a bear market within 1-4 weeks. The exception to this was 1979-1980, when the value of the ounce increased, and relatively short-lived consolidations followed growth impulses.
Market tensions in recent days have also worked in favour of the bears in gold. Contrary to popular logic, gold rises against general risk demand only in the first days of the sell-off. If the pressure on equities becomes a trend, gold quickly catches up and overtakes the markets in its decline, only to be stopped by a monetary policy reversal.
ECB’s Lagarde eyes policy moderation barring any major shock
In an interview with CNBC today, ECB President Christine Lagarde expressed cautious optimism about the ongoing disinflationary trends, noting that disinflation is aligning with ECB's forecasts.
Lagarde emphasized the need for ECB to gain "a bit more confidence" in the sustainability of these disinflationary trends before making any significant changes to its policy framework.
Looking ahead, Lagarde pointed out that barring any "major shock" in developments, ECB is poised to "moderate the restrictive monetary policy."
Fed’s Jefferson ready to maintain current interest rate if inflation persists
Fed Vice Chair Philip Jefferson stated in a speech that his "baseline outlook" anticipates further decline in inflation while maintaining the current policy rate. He expects the labor market to stay robust and labor demand and supply continue to rebalance.
However, Jefferson also cautioned that the economic outlook is "still quite uncertain" and highlighted the potential challenges if inflation proves to be more persistent than anticipated.
"If incoming data suggest that inflation is more persistent than I currently expect it to be, it will be appropriate to hold in place the current restrictive stance of policy for longer," Jefferson said.
Higher Energy Prices Masked Another Downside Canadian Inflation Surprise in March
Canadian CPI growth ticked up to 2.9% year-over-year in March from 2.8% in the prior month, thanks to higher energy prices. Despite the rise, details in the report continue to point to price pressures broadly unwinding.
Trends in food and energy inflation continue to diverge. Food CPI growth slowed further to 3% with grocery inflation dropping to 1.9% year-over-year. Price growth for dining out in the meantime was higher at 5.1% and was unchanged for a second month in a row.
Energy inflation jumped to 2.8% year-over-year in March led by higher gasoline prices in the month. That was a result of rising oil prices that are tied to heightened supply concerns with ongoing geopolitical tensions.
The Bank of Canada’s preferred ‘core’ measures that are designed to gauge broader underlying price growth all showed further improvement. CPI trim and median both eased and averaged below the top end of the 1% - 3% inflation target for the first time since inflation started to rise more substantially, around the summer of 2021.
Excluding energy and shelter related components from services CPI, another preferred core inflation measure that is the Bank of Canada’s “supercore” dropped to 2.8% in March on a three-month annualized basis from 3.4% in February.
Shelter prices continued to account for a disproportionate share of overall price growth, especially in rent costs that saw inflation rise to 8.3% in March, highest since 1983.
Also in shelter, inflation for mortgage interest costs (a direct lagged result of earlier interest rate increases) continued to moderate but was still elevated at +25.4% year-over-year. That washed out a small increase in other owned accommodation costs, and left CPI for overall home owning related expenses slightly higher still, at 6.8% in March.
Bottom Line: Building on two prior months of CPI reports that were both downside surprises, March’s reading today confirmed that broad-based easing in price pressures in Canada are indeed underway. Different measures of core inflation all continued to decelerate and the diffusion index that measures the scope of inflation pressures also improved again and now tracks a breadth of price pressure that’s similar to pre-pandemic. The BoC in its last meeting agreed with those developments, highlighting increased confidence that “that inflation will continue to come down gradually even as economic activity strengthens”. We continue to look for slowing inflation will allow for a first rate cut from the BoC in June.