Sample Category Title
Sunset Market Commentary
Markets
European stock opened around 1.5% weaker this morning, catching up with losses inflicted on WS’s benchmark indices last night and Asian bourses this morning by Israel’s lingering treat to strike back against Iran. The EuroStoxx 50 tested the 50d moving average at the start (4910), but avoided a technical drop at first. Going into US dealings, risk sentiment is again deteriorating. Losses currently amount to maximum 2%. US equities are off to a mixed start. First support in Nasdaq at 15862 narrowly survives for now. We err on the side of a larger correction though on a combination of higher real rates, geopolitical risk and the Q1 earnings season. Core bonds extend their slide as markets continue to push back against rate cut bets. In Europe, a new consensus is gradually building around a quarterly 25 bps rate cut pace, bringing the deposit rate at 3.25% by year-end. We warned before that a bumpy H2 2024 inflation path, economic green shoots and the Fed delay will make it hard for the ECB to make monetary policy less restrictive after an inaugural move at the June meeting. ECB Rehn and Makhlouf both warned that geopolitics are the biggest treat to this scenario eg via a complete closure of the Res Sea. In the US, money markets are now even doubting whether the Fed will be able to implement two rate cuts this year, with markets rallying around September to pull the trigger. Fed vice-chair Jefferson added to the sell-off by warning to hold rates high for longer if inflation persists. He still thinks that inflation will decline given a steady policy rate, shutting the door on Fed rate hike talk. Q1 GDP growth will slow from Q4 but remain solid and the labor market stays strong. Disappointing US housing data only temporary came to US Treasuries’ rescue intraday. US housing starts fell by 14.7% M/M after a 12.7% surge in February with both single family and multifamily starts being affected. Building permits were 4.3% lower on the month, especially for single family permits. US yields currently add 4.5 bps (2-yr) to 7.4 bps (30-yr). The US 10-yr yield set a new YTD high at 4.68% and the 30-yr tenor did the same at 4.80%. Daily changes on the German yield curve range between +0.1 bp (2-yr) and +3 bps (30-yr). King dollar ran out of steam after an impressive >2% gain over the past 4 trading sessions. EUR/USD moves away from the 1.06 big figure to currently change hands around 1.0630. Several emerging market currencies remain extremely vulnerable though with USD/BRL today extending its surge to its highest level in over a year. USD/KRW is another point in case with the pair testing the 1400 mark which in the recent past was only broken during the GFC and the pandemic. EUR/GBP (0.8540) wasn’t bothered by this morning’s weak labour market data with accelerating wages making the picture somewhat diffuse.
News & Views
Canadian March inflation printed slightly softer than expected. Headline inflation rose 0.6% M/M (vs. 0.7% consensus) and 2.9% Y/Y from 2.8%. Core inflation measures slowed more than expected, printing at 2.8% from 3% for core median and 3.1% from 3.2% for core mean. In a monthly perspective, price rises were driven by shelter (0.4%), clothing and footwear (2.9%), gasoline (4.9%) and recreation and education (0.5%). Prices for health and personal care (-0.1%) and household operations contributed negatively to inflation. At its policy meeting last week, the BoC expected inflation to be close to 3% in H1 this year, before easing to 2.5.% in H2 and retuning to 2% next year. Markets see a 65% chance of a first BoC rate cut at the next meeting (June 05) with a 25 bps step (more than) fully discounted for July. The loonie traded in the defensive against a broadly strong dollar of late and lost further after the softer than expected March CPI .USD/CAD touched a new YtD top near 1.382 today.
The National Bank of Poland published its monthly calculations for core inflation. March headline inflation was published by the statistical office yesterday at 0.2% M/M and 2% Y/Y. All core measures slowed substantially. CPI excluding food and energy eased from 5.4% Y/Y to 4.5%. The index net of volatile components amount to 3.4% from 4.5%. Inflation excluding administered prices slowed to 1.8% from 2.8%. Most MPC members including governor Glapinski indicated little room to cut the policy rate this year despite inflation printing below the 2.5% NBP target. Prices might reaccelerate later on higher VAT and the government scaling back (some of) the anti-inflation measures (caps on energy prices). After trading near the strongest levels since early 2020, less favourable global sentiment triggered a correction with EUR/PLN now trading near 4.343 compared to a low near EUR/PLN 4.253 last week.
USD/CAD Mid-Day Outlook
Daily Pivots: (S1) 1.3744; (P) 1.3769; (R1) 1.3814; More...
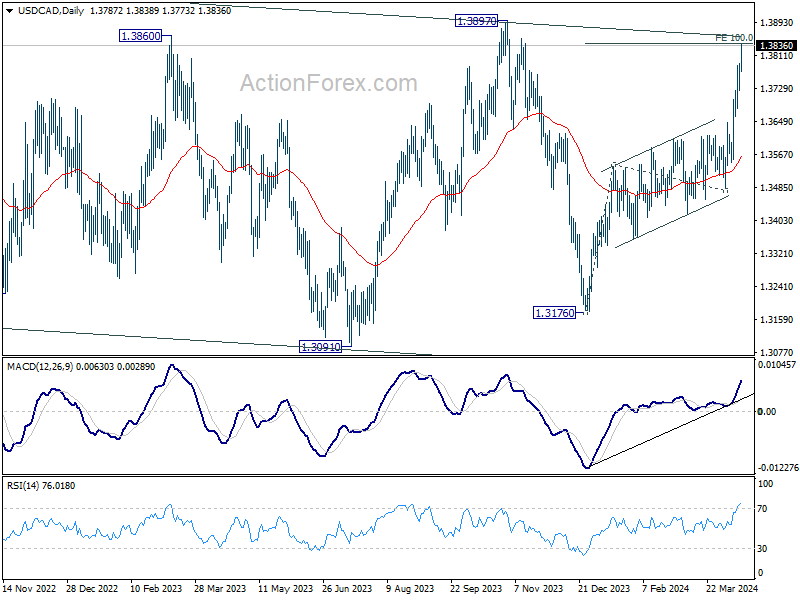
USD/CAD's rally from 1.3176 is in progress and intraday bias remains on the upside. Decisive break of 100% projection of 1.3176 to 1.3540 from 1.3477 at 1.3841 will pave the way to 138.2% projection at 1.3980. On the downside, below 1.3773 minor support will turn intraday bias neutral and bring consolidations first, before staging another rise.
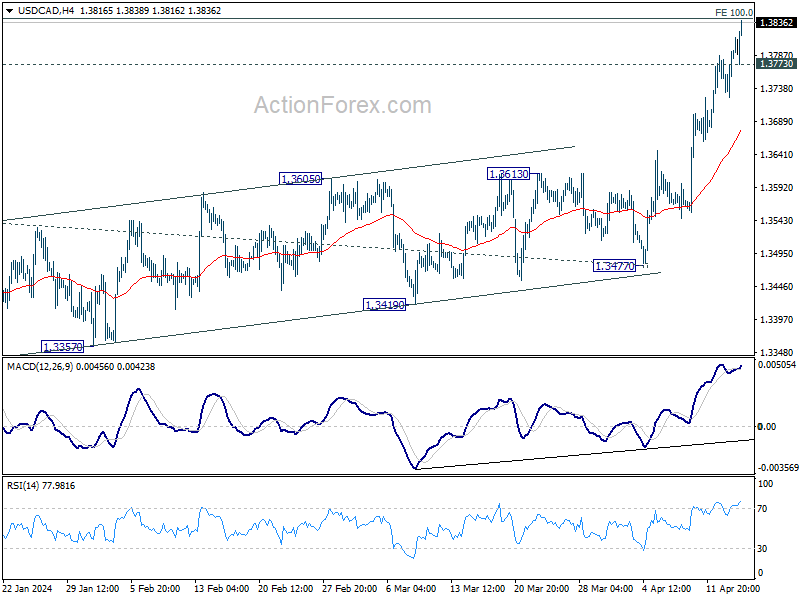
In the bigger picture, price actions from 1.3976 (2022 high) are viewed as a corrective pattern only. In case of another fall, strong support should emerge above 1.2947 resistance turned support to bring rebound. Firm break of 1.3976 will confirm up resumption of whole up trend from 1.2005 (2021 low). Next target is 61.8% projection of 1.2401 to 1.3976 from 1.3176 at 1.4149.
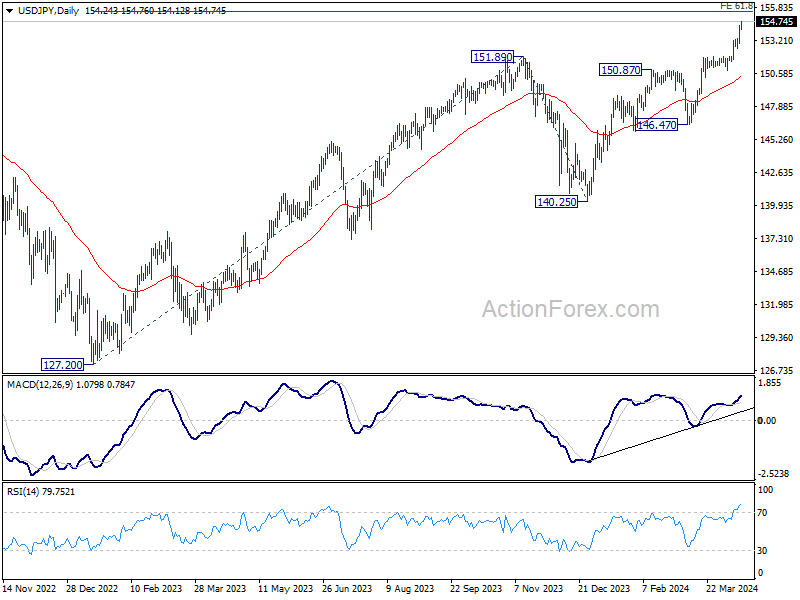
USD/JPY Daily Outlook
Daily Pivots: (S1) 153.34; (P) 153.89; (R1) 154.83; More...
USD/JPY's rally is still in progress and intraday bias stays on the upside. Current up trend should target 155.20 fibonacci projection level next. On the downside, below 154.12 minor support will turn intraday bias neutral and bring consolidations again, before staging another rally.
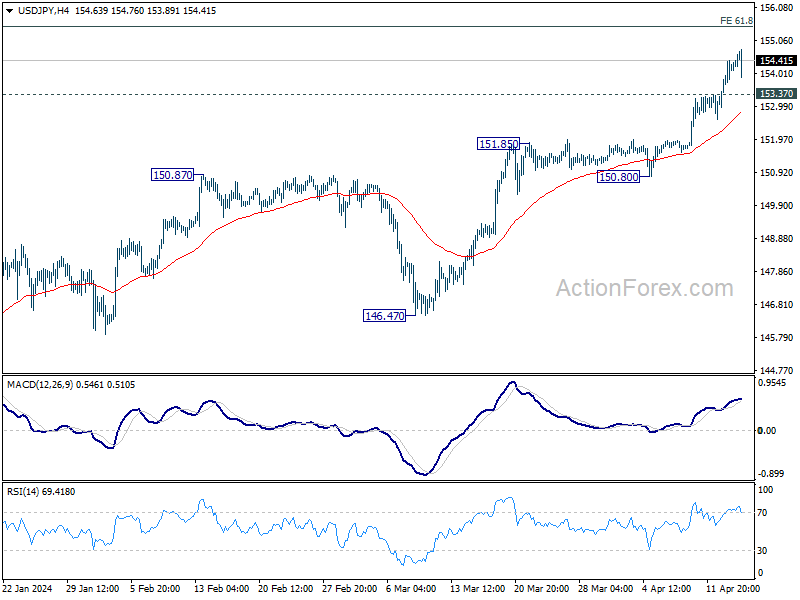
In the bigger picture, current rise from 140.25 is seen as the third leg of the up trend from 127.20 (2023 low). Next target is 61.8% projection of 127.20 to 151.89 from 140.25 at 155.20. Outlook will now remain bullish as long as 146.47 support holds, even in case of deep pullback.
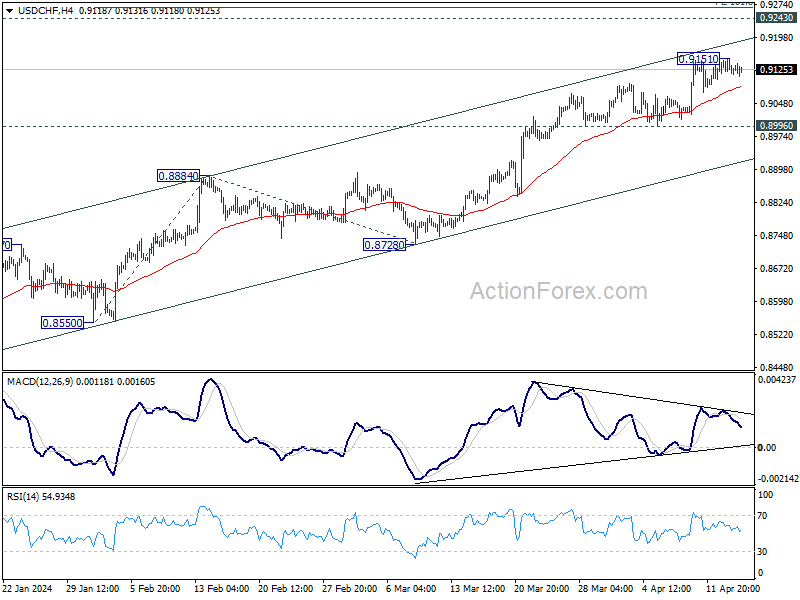
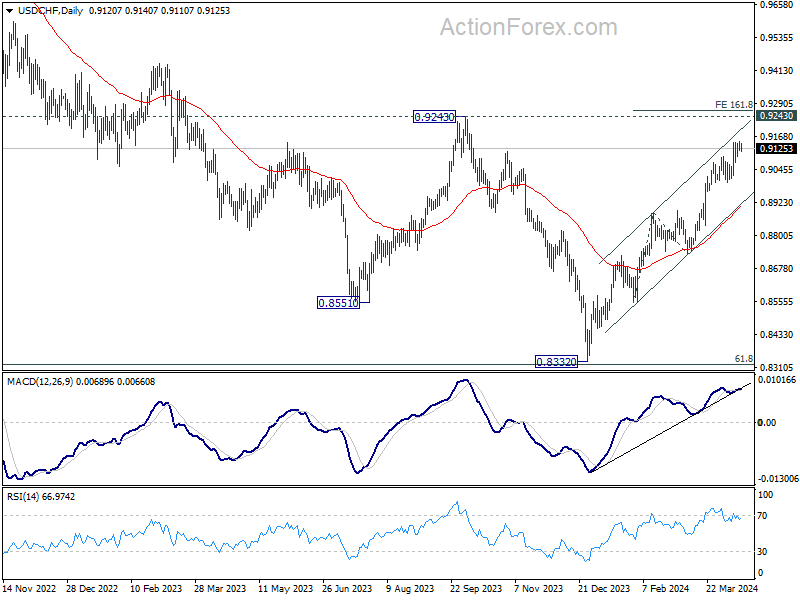
USD/CHF Mid-Day Outlook
Daily Pivots: (S1) 0.9101; (P) 0.9126; (R1) 0.9141; More....
Intraday bias in USD/CHF remains neutral as consolidation continues below 0.9151. But further rally is expected as long as 0.8996 support holds. Firm break of 0.9151 will target 161.8% projection of 0.8550 to 0.8884 from 0.8728 at 0.9268.
In the bigger picture, price actions from 0.8332 medium term bottom as tentatively seen as developing into a corrective pattern to the down trend from 1.0146 (2022 high). Further rise would be seen as long as 0.8728 support holds. But upside should be limited by 0.9243 resistance, at least on first attempt. However, decisive break of 0.9243 will argue that the trend has already reversed and turn medium term outlook bullish.
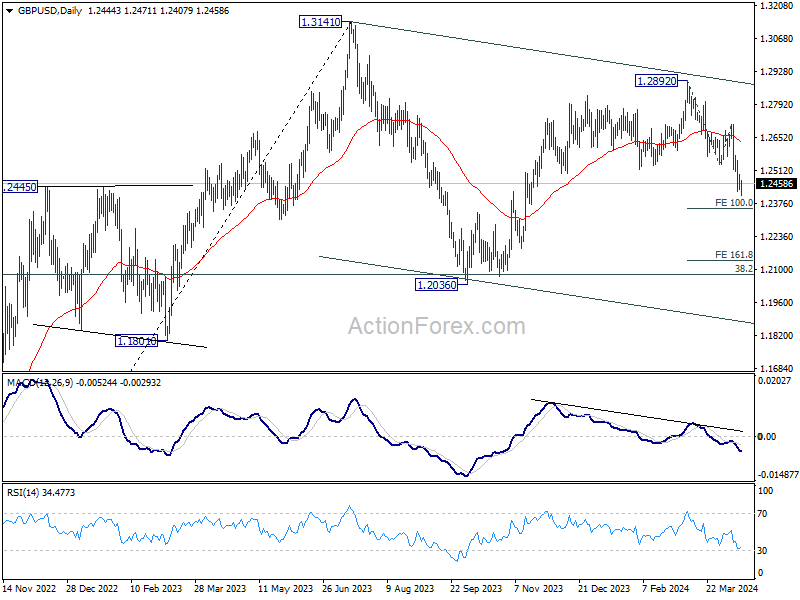
GBP/USD Mid-Day Outlook
Daily Pivots: (S1) 1.2421; (P) 1.2460; (R1) 1.2484; More...
Intraday bias in GBP/USD remains neutral at this point and more consolidations could be seen. Recovery should be limited by 1.2577 minor resistance to bring another fall. On the downside, firm break of 1.2407 will resume the decline from 1.2892 to 100% projection of 1.2892 to 1.2538 from 1.2708 at 1.2354. Firm break there will target 161.8% projection at 1.2207 next.
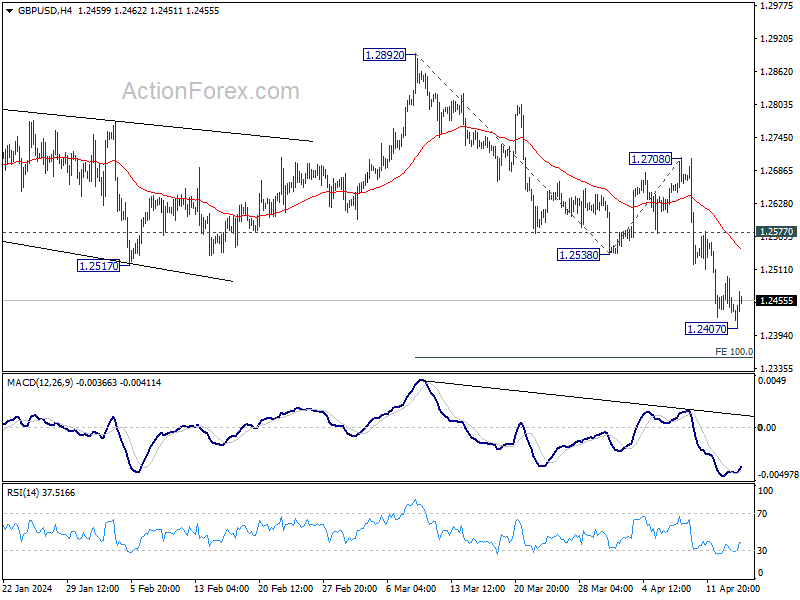
In the bigger picture, price actions from 1.3141 medium term top are seen as a corrective pattern to up trend from 1.0351 (2022 low). Fall from 1.2892 is seen as the third leg. Deeper decline would be seen to 1.2036 support and possibly below. But strong support should emerge from 61.8% retracement of 1.0351 to 1.2452 at 1.1417 to complete the correction.
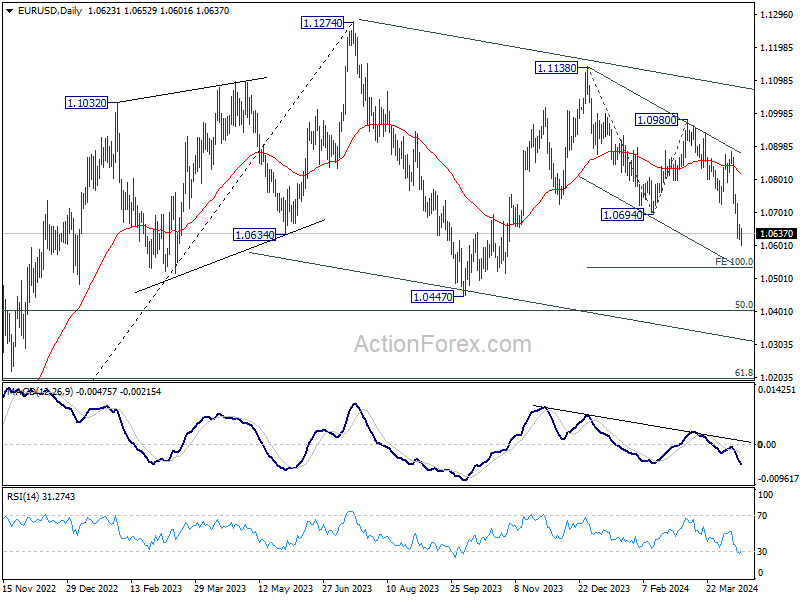
EUR/USD Mid-Day Outlook
Daily Pivots: (S1) 1.0608; (P) 1.0636; (R1) 1.0653; More...
A temporary low is in place at 1.0601 in EUR/USD with 4H MACD crossed above signal line. Intraday bias is turned neutral for consolidations first. While stronger recovery cannot be ruled out, upside should be limited by 1.0723 support turned resistance. On the downside, break of 1.0601 will resume the decline from 1.1138 to 100% projection of 1.1138 to 1.0694 from 1.0980 at 1.0536 next.
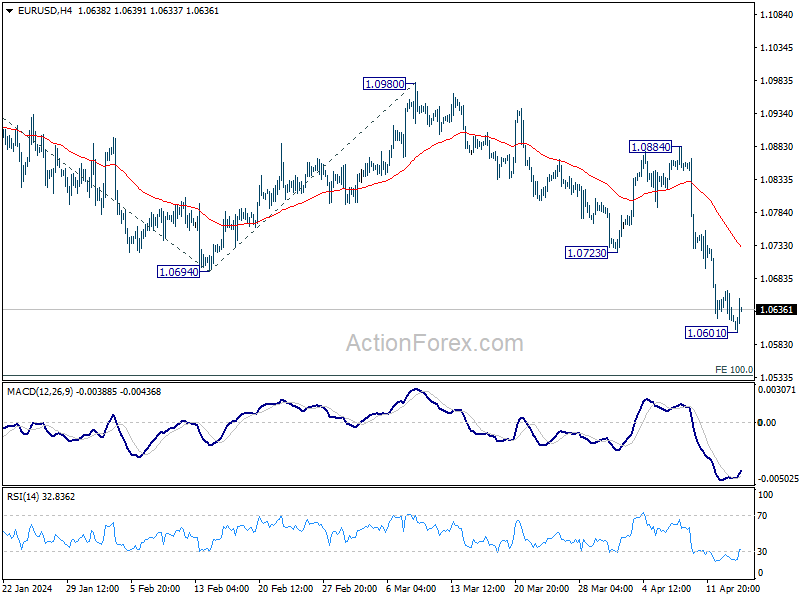
In the bigger picture, price actions from 1.1274 are viewed as a corrective pattern to rise from 0.9534 (2022 low). Current fall from 1.1138 is seen as the third leg. While deeper decline is would be seen to 1.0447 and possibly below. Strong support should emerge from 61.8% retracement of 0.9534 to 1.1274 at 1.0199 to complete the correction.
Euro Sees Modest Recovery Amid Improved Economic Sentiment, Canadian Down after CPI
Euro rises broadly today, lifted by significant improvement in economic sentiment indicators from Germany and the broader Eurozone. Despite these positive signals, current situation assessment remains subdued. While the worst may be over for Germany's economy, in particular the manufacturing sector, recovery is still in its nascent stages and further nurturing is required. The uptick in Euro is more likely a corrective move rather than a definitive trend reversal, given the overall weak momentum of the common currency.
Sterling is ranking as the second strongest performer for the day, next to Euro. The Pound largely overlooks the uptick in UK unemployment rate. Market focus remains on the persistently high wage inflation. Current conditions suggest it is still premature for BoE to consider interest rate cuts, as wage pressures do not yet show signs of significant easing.
On the other hand, commodity currencies are trading lower across the board, with Canadian Dollar facing renewed selling pressure following reports of continued slowdown in core inflation measures. Meanwhile, Dollar, while maintaining strength against commodity currencies and Yen, is showing signs of fatigue against Europeans. Yen finds itself in a middling position, largely uninspired by Japan's tepid verbal intervention.
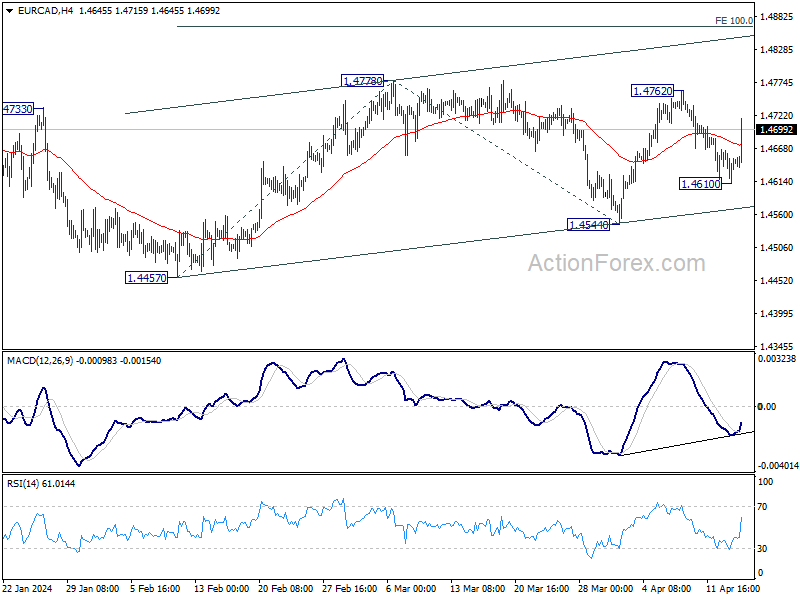
From a technical standpoint, EUR/CAD's strong rebound today suggests that pull back from 1.4762 has completed at 1.4610 already. More importantly, rise from 1.4457 low is likely still in progress. Further rally should be seen to 1.4762/4778 resistance zone first. Decisive break there will target 100% projection of 1.4457 to 1.4778 from 1.4544 at 1.4865 next.
In Europe, at the time of writing, FTSE is down -1.33%. DAX is down -0.95%. CAC is down -0.96%. UK 10-year yield is up 0.0056 at 4.299. Germany 10-year yield is up 0.022 at 2.469. Earlier in Asia, Nikkei fell -1.94%. Hong Kong HSI fell -2.12%. China Shanghai SSE fell -1.65%. Singapore Strait Times fell -1.22%. Japan 10-year JGB yield rose 0.0064 to 0.872.
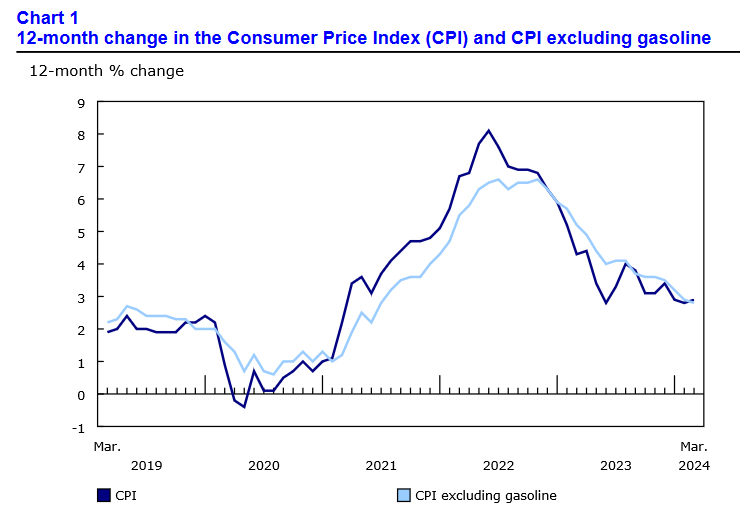
Canada's CPI edges up to 2.9%, but core measures slow
In March, Canada's CPI saw a slight increase, rising from 2.8% yoy to 2.9% yoy. However, when excluding gasoline, CPI actually slowed from 2.9% yoy to 2.8% yoy.
A closer look at the components reveals that services prices experienced a sharper increase, rising from 4.2% yoy to 4.5% yoy. This outpaced the change in goods prices, which decelerated slightly from 1.2% yoy to 1.1% .
Further dissecting the inflation data, the core inflation measures indicated a cooling trend. Median CPI decreased from 3.0% yoy to 2.8% yoy, while Trimmed CPI reduced slightly from 3.2% yoy to 3.1% yoy. Additionally, Common CPI, which tracks common price changes across categories, also slowed from 3.1% yoy to 2.9% yoy.
German ZEW jumps to 42.9, euro's depreciation helps
German ZEW Economic Sentiment jumped from 31.7 to 42.9 in April, well above expectation of 35.1, and marks the highest level since March 2022. But Current Situation Index improved just slightly from -80.5 to -79.2.
Eurozone ZEW Economic Sentiment also surged from 33.5 to 43.9, above expectation of 37.2. Current Situation Index climbed 6.0 pts to -48.8.
ZEW President Achim Wambach noted, "A recovering global economy is boosting expectations for Germany, with half of the respondents anticipating the country's economy to pick up over the next six months."
This optimism is largely driven by improved assessments of the economic situations in Germany's major export destinations. The positive outlook is further buoyed by the expected "appreciation of the US dollar against the euro", which could benefit Eurozone exporters by making their goods more competitive in international markets.
ECB's Rehn points to June rate cuts, but warns of geopolitical risks
ECB Governing Council member Olli Rehn highlighted in a statement that reduction in policy restrictions could commence in June as long as "inflation continues to fall as projected."
But he also addressed the predominant risks, identifying "geopolitics" as the primary source of uncertainty. He specifically pointed to the "deteriorating situation in Ukraine" and the "possible escalation of the Middle East conflict" as critical factors with potential ramifications on the European economy, especially concerning energy prices and overall economic stability.
Looking ahead to ECB's June meeting, the council will review an "updated assessment of the inflation outlook, the dynamics of underlying inflation, and the strength of monetary policy transmission."
This upcoming analysis will be crucial in determining whether ECB has sufficient confidence that inflation is sustainably converging towards its target, leading to a decision to "start to ease the stance of monetary policy and cut interest rates."
However, Rehn cautioned that this prospective easing is conditional on the absence of "further setbacks, for instance in the geopolitical situation and therefore in energy prices."
UK payrolled employment falls -67k in Mar, unemployment rate rises to 4.2% in Feb
UK payrolled employment fell -67k or -0.2% mom in March. Median monthly pay rose 5.6% yoy, slowed from prior month's 6.2% yoy. Claimant count rose 10.9k, below expectation of 17.2k.
In the three months to February, unemployment rate rose from 4.0% to 4.2%, above expectation of 4.0%. Average earnings including bonus rose 5.6% yoy, unchanged from prior month's rate. Average earnings excluding bonus rose 6.0%, down slightly from January's 6.1% yoy.
China's GDP grows 5.3% yoy in Q1, but March data weak
China's GDP grew 5.3% yoy in Q1, above expectation of 5.0% yoy. Comparing to Q4, GDP grew 1.6% yoy. By sector, primary industry was up 3.3% yoy, secondary industry rose 6.0% yoy, tertiary industry rose 5.0% yoy.
In March, retail sales rose 3.1% yoy, below expectation of 5.1% yoy. Industrial production rose 4.5% yoy, below expectation of 6.0% yoy. Fixed asset investment rose 4.5% ytd yoy, above expectation of 4.3%.
USD/CNH is steady after the release with focus on 7.2815 resistance. firm break there will resume whole rebound from 7.0870 and target 100% projection of 7.0870 to 7.2318 from 7.1715 at 7.3163. For now, outlook will stay bullish as long as 7.2354 support holds, in case of retreat.
EUR/USD Mid-Day Outlook
Daily Pivots: (S1) 1.0608; (P) 1.0636; (R1) 1.0653; More...
A temporary low is in place at 1.0601 in EUR/USD with 4H MACD crossed above signal line. Intraday bias is turned neutral for consolidations first. While stronger recovery cannot be ruled out, upside should be limited by 1.0723 support turned resistance. On the downside, break of 1.0601 will resume the decline from 1.1138 to 100% projection of 1.1138 to 1.0694 from 1.0980 at 1.0536 next.
In the bigger picture, price actions from 1.1274 are viewed as a corrective pattern to rise from 0.9534 (2022 low). Current fall from 1.1138 is seen as the third leg. While deeper decline is would be seen to 1.0447 and possibly below. Strong support should emerge from 61.8% retracement of 0.9534 to 1.1274 at 1.0199 to complete the correction.
Economic Indicators Update
| GMT | Ccy | Events | Actual | Forecast | Previous | Revised |
|---|---|---|---|---|---|---|
| 02:00 | CNY | GDP Y/Y Q1 | 5.30% | 5.00% | 5.20% | |
| 02:00 | CNY | Retail Sales Y/Y Mar | 3.10% | 5.10% | 5.50% | |
| 02:00 | CNY | Industrial Production Y/Y Mar | 4.50% | 6.00% | 7.00% | |
| 02:00 | CNY | Fixed Asset Investment YTD Y/Y Mar | 4.50% | 4.30% | 4.20% | |
| 06:00 | GBP | Claimant Count Change Mar | 10.9K | 17.2K | 16.8K | 4.1K |
| 06:00 | GBP | ILO Unemployment Rate (3M) Feb | 4.20% | 4.00% | 3.90% | 4.00% |
| 06:00 | GBP | Average Earnings Including Bonus 3M/Y Feb | 5.60% | 5.50% | 5.60% | |
| 06:00 | GBP | Average Earnings Excluding Bonus 3M/Y Feb | 6.00% | 6.10% | ||
| 09:00 | EUR | Eurozone Trade Balance (EUR) Feb | 17.9B | 27.3B | 28.1B | 27.1B |
| 09:00 | EUR | Germany ZEW Economic Sentiment Apr | 42.9 | 35.1 | 31.7 | |
| 09:00 | EUR | Germany ZEW Current Situation Apr | -79.2 | -80.5 | ||
| 09:00 | EUR | Eurozone ZEW Economic Sentiment Apr | 43.9 | 37.2 | 33.5 | |
| 12:30 | CAD | CPI M/M Mar | 0.60% | 0.70% | 0.30% | |
| 12:30 | CAD | CPI Y/Y Mar | 2.90% | 2.80% | ||
| 12:30 | CAD | CPI Median Y/Y Mar | 2.80% | 3.00% | 3.10% | 3.00% |
| 12:30 | CAD | CPI Trimmed Y/Y Mar | 3.10% | 3.20% | 3.20% | |
| 12:30 | CAD | CPI Common Y/Y Mar | 2.90% | 3.10% | 3.10% | |
| 12:30 | USD | Building Permits Mar | 1.32M | 1.51M | 1.52M | 1.55M |
| 12:30 | USD | Housing Starts Mar | 1.46M | 1.48M | 1.52M | |
| 13:15 | USD | Industrial Production M/M Mar | 0.40% | 0.10% | ||
| 13:15 | USD | Capacity Utilization Mar | 78.50% | 78.30% |
Canada’s CPI edges up to 2.9%, but core measures slow
In March, Canada's CPI saw a slight increase, rising from 2.8% yoy to 2.9% yoy. However, when excluding gasoline, CPI actually slowed from 2.9% yoy to 2.8% yoy.
A closer look at the components reveals that services prices experienced a sharper increase, rising from 4.2% yoy to 4.5% yoy. This outpaced the change in goods prices, which decelerated slightly from 1.2% yoy to 1.1% .
Further dissecting the inflation data, the core inflation measures indicated a cooling trend. Median CPI decreased from 3.0% yoy to 2.8% yoy, while Trimmed CPI reduced slightly from 3.2% yoy to 3.1% yoy. Additionally, Common CPI, which tracks common price changes across categories, also slowed from 3.1% yoy to 2.9% yoy.
Currency War and Geopolitical Risk are Deadly Concoctions for Risk Assets
- The odds have inched higher for a currency war scenario where the Chinese yuan may be weakened further to drive export growth due to its latest decelerating growth trend in China’s retail sales and persistent weak housing prices.
- Export-oriented countries may be forced to enact “beggar-thy-neighbour” typed monetary policies to deliberately weaken their respective currencies.
- A heightened currency war-liked scenario is likely to trigger another layer of US dollar strength.
- A persistent US dollar strength may not bode well for global stock markets in the medium term.
China’s domestic economy has continued to be in the doldrums as growth in retail sales for March decelerated significantly to 3.1% y/y from 5.5% y/y in February, its softest pace of gain since July 2023 and below consensus expectations of 4.5% which suggests that China’s consumer confidence has remained lackluster due to the year-long plus of deflationary risk spiral.
A persistently weak housing market supports the ongoing presence of deflationary pressures in China as the latest data of new home prices for March continued to tumble by 2.2% y/y, faster than a 1.4% y/y drop recorded in February. So far, it has been nine consecutive months of decline in home prices and its steepest pace since August 2015.
Home properties form a significant store of wealth for China’s citizens, triggering an adverse wealth effect on consumer confidence and spending in the past two years.
A weaker Chinese yuan is likely the solution to offset weak domestic demand
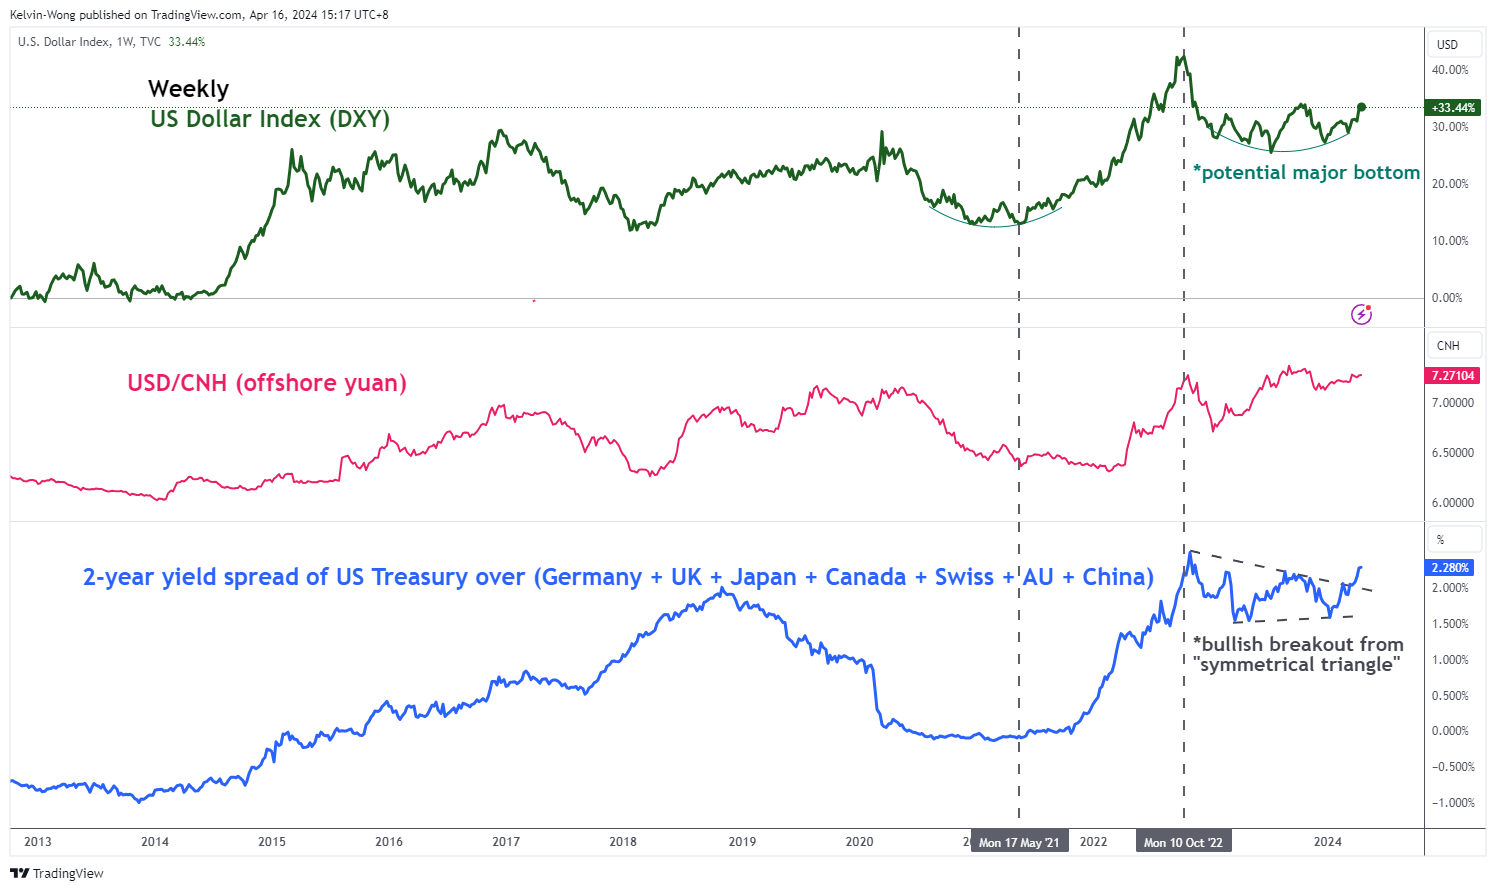
Fig 1: Major trends of US Dollar Index, USD/CNH & 2-YR US Treasury yield spread over rest of the world as of 16 Apr 2024 (Source: TradingView, click to enlarge chart)
China’s top policymakers have set a lofty GDP growth target of around 5% for this year and with the reluctance to deploy significant fiscal and monetary stimulus measures to jump-start internal demand; the other avenue to achieve such an economic growth trajectory is via the external sector from exports growth through a devaluation of the yuan.
A persistent bout of yuan weakness coupled with the US Federal Reserve’s current less dovish stance versus other major developed nations’ central banks is likely to create another layer of US dollar strength via an increase in yield premiums of US Treasuries over the rest of the world sovereign bonds (see Fig 1).
Asian stock indices are likely to continue to face downside pressure in a weak yuan environment
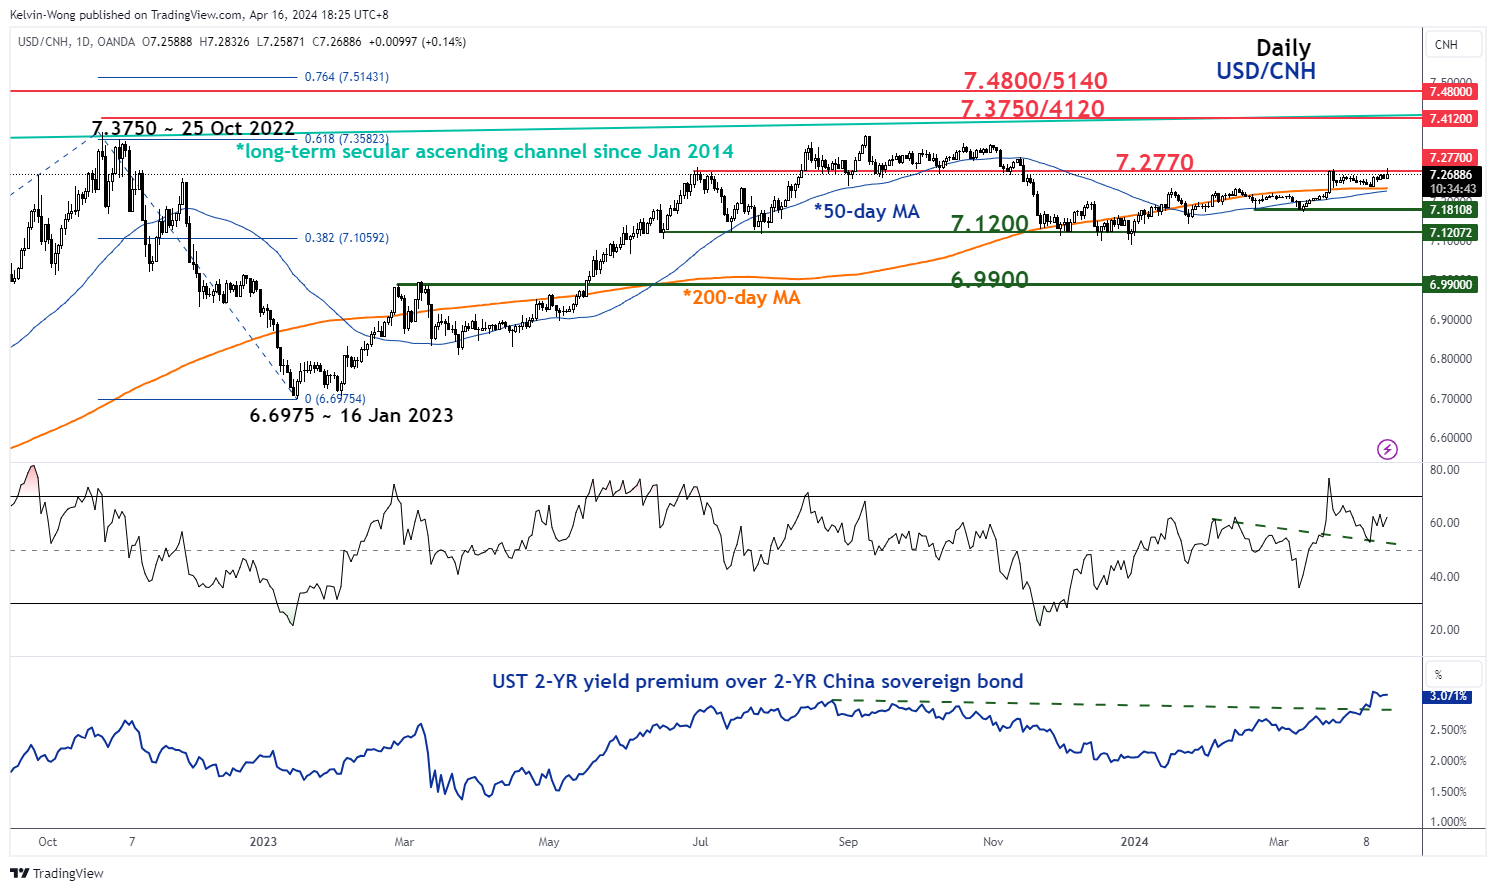
Fig 2: USD/CNH major & medium-term trends as of 16 Apr 2024 (Source: TradingView, click to enlarge chart)
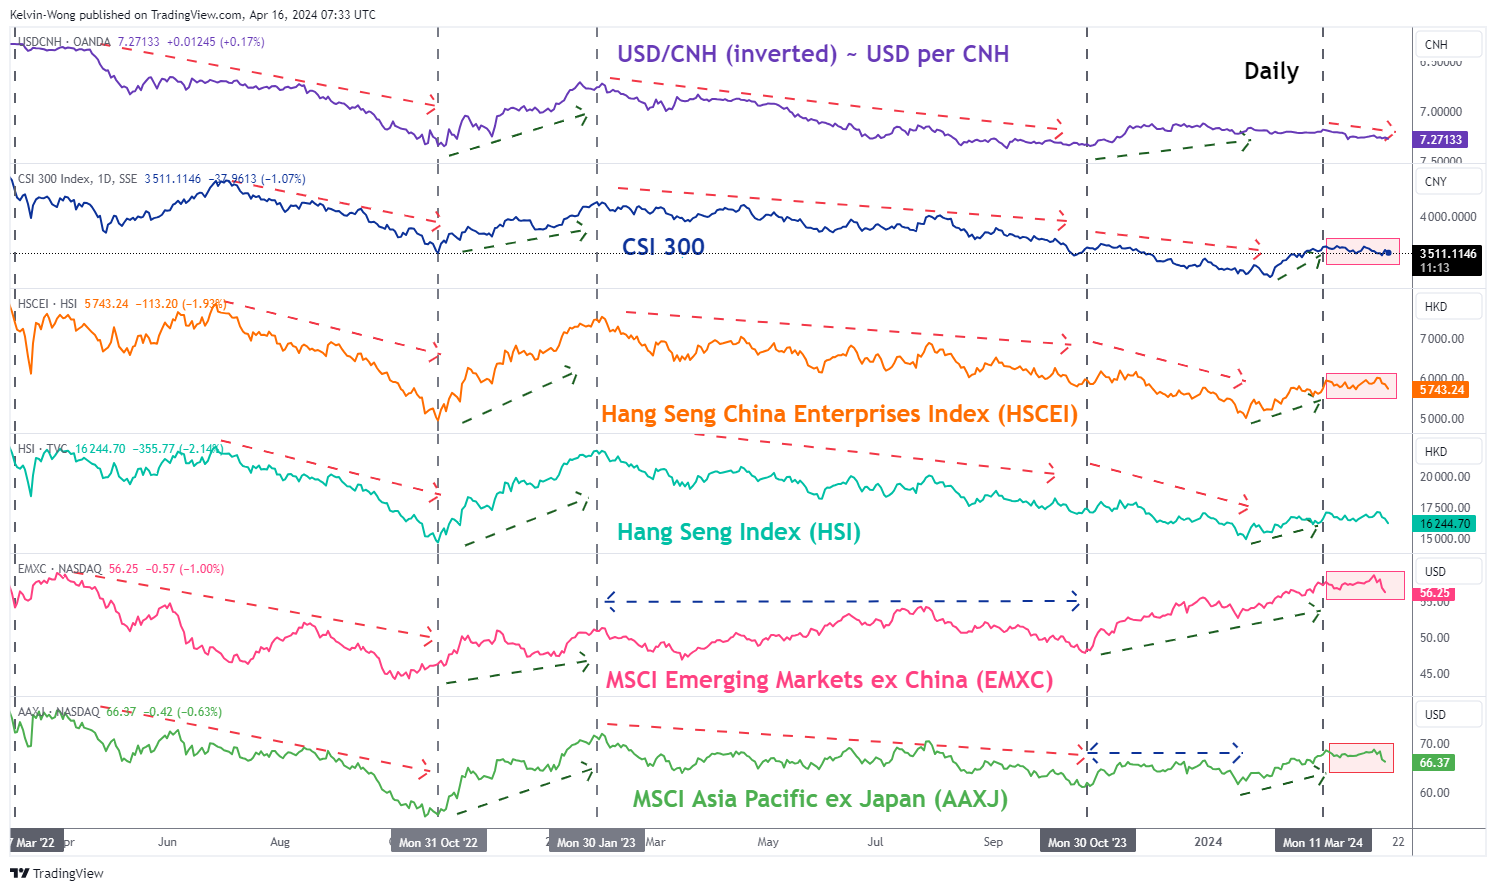
Fig 3: CNH/USD direct correlation with CSI 300, HSCEI, HSI, EMXC & AAXJ as of 15 Apr 2024 (Source: TradingView, click to enlarge chart)
In our previous article dated 25 March 2024, we wrote about the potential bearish implications on the Hang Seng stock indices and China’s CSI 300 triggered by a weakening offshore yuan (CNH) trend. Click here for a recap.
In the past week, the USD/CNH has traded firmly above its upward-slopping 50-day and 200-day moving averages, and in today’s Asian session, it probed again the key near-term resistance of 7.2770. A clear break above 7.2770 is likely to revive a potential bullish impulsive upmove sequence of the USD/CNH within its major uptrend phase (yuan weakness) (see Fig 2).
Hence, an adverse feedback loop is likely to take form as major exporting countries such as South Korea, Taiwan, Malaysia, and Singapore may face the pressure to engage in “beggar-thy-neighbour” currency war-liked monetary policies (deliberately weaken their respective domestic currencies) to maintain export competitiveness.
All in all, a persistent trend of Chinese yuan (CNH) weakness is likely to increase the odds of an impending medium-term bearish trend in Asian stock indices as indicated by the recent movements of the MSCI Asia Pacific ex Japan exchange-traded fund (AAXJ) since 11 March 2024 (see Fig 3).
The US stock market is unlikely to be immune from a persistent strong US dollar trend
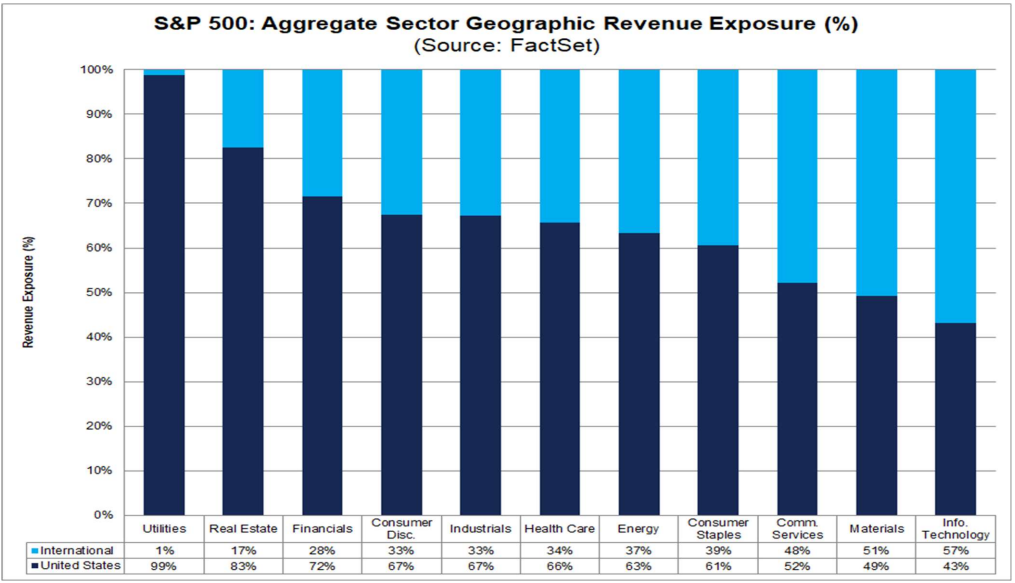
Fig 4: S&P 500 11 industry sectors’ geographical revenue weightage (Source: FactSet as of 12 Apr 2024, click to enlarge chart)
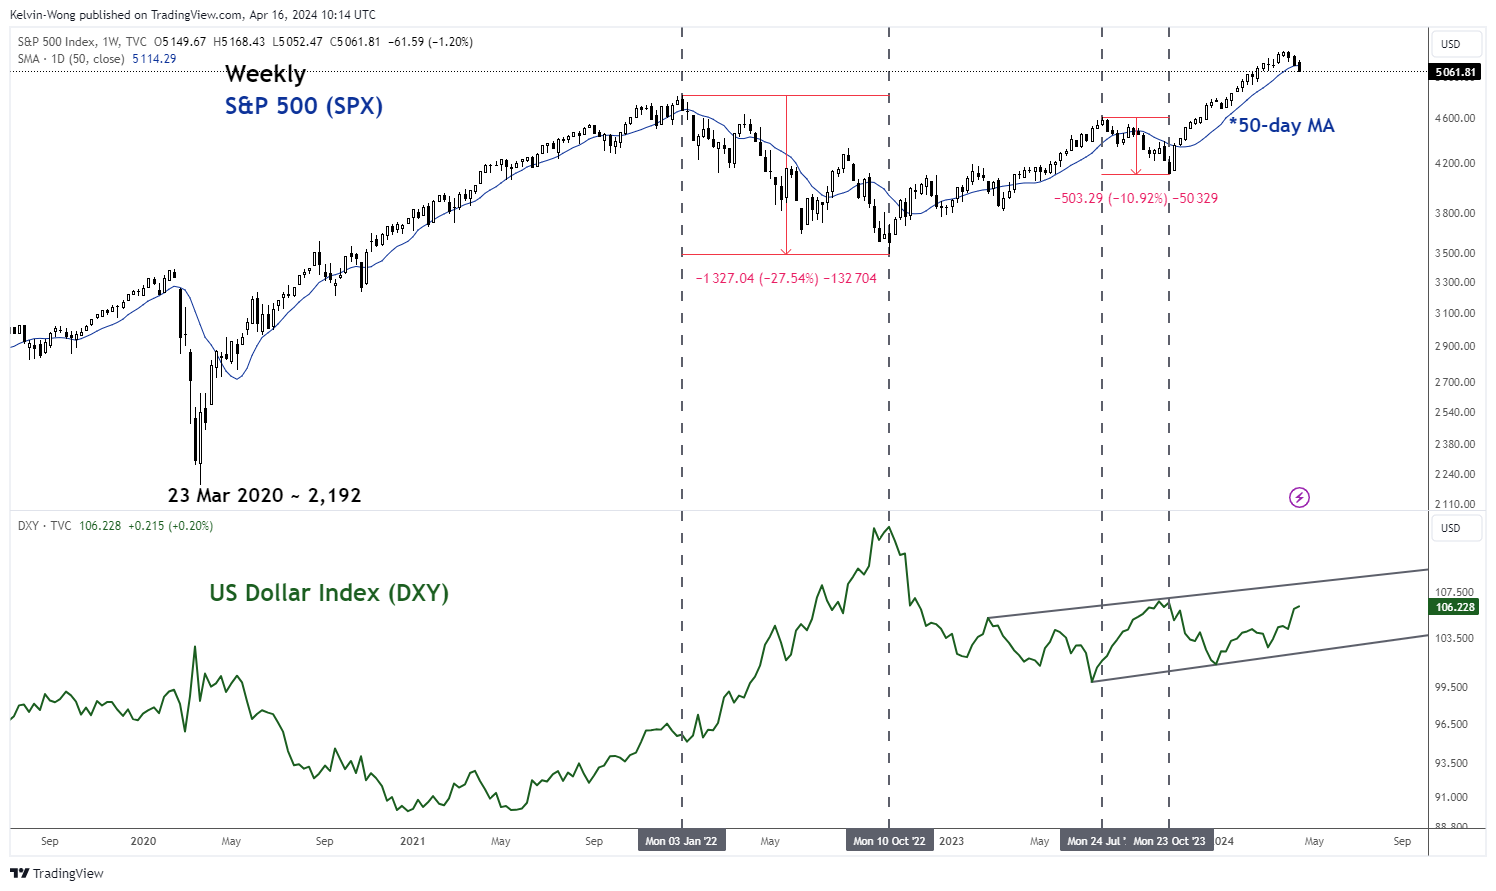
Fig 5: Major trend of S&P 500 with US Dollar Index as of 15 Apr 2024 (Source: TradingView, click to enlarge chart)
The S&P 500, a key benchmark stock index in the US as well as globally, is made up of the top 500 companies from eleven industry sectors, and the Information Technology sector has the highest skewed weightage of around 30% in terms of market capitalization.
Therefore, the price action movements of technology stocks within the S&P 500 will have a much more significant impact on the directional bias of the S&P 500 which can also trigger pronounced feedback loops into the wider US stock market.
Based on the latest data from FactSet as of 12 April, the Information Technology sector of the S&P 500 has the highest portion of aggregate revenue derived from international markets standing at 57% which suggests that any significant US dollar appreciation against the rest of the world currencies will likely to have a negative drag on the total revenue flows of US technology stocks when converted back to US dollars in terms of financial reporting (see Fig 4).
In addition, the previous recent episodes of persistent US dollar strength (represented by the movements of the US Dollar Index) seen from January 2022 to October 2022, and July 2023 to October 2023 have corresponded with significant corrections of -27% and -11% inflicted on the S&P 500 over the similar periods (see Fig 5).
We have written several articles on the S&P 500 that highlighted the risk of an impending medium-term corrective downmove sequence, the latest one was published on 8 April, click here for a recap.
So far, the S&P 500 has dropped by -4% from its current all-time high of 5,265 printed in late March, and yesterday, 15 April it recorded a close below its 50-day moving average for the first time since 2 November 2023.
Perhaps, a looming persistent US dollar strength may be the final death knell to kickstart the potential medium-term corrective decline in the US S&P 500 which may transform into a negative cascading waterfall effect on global stock markets.
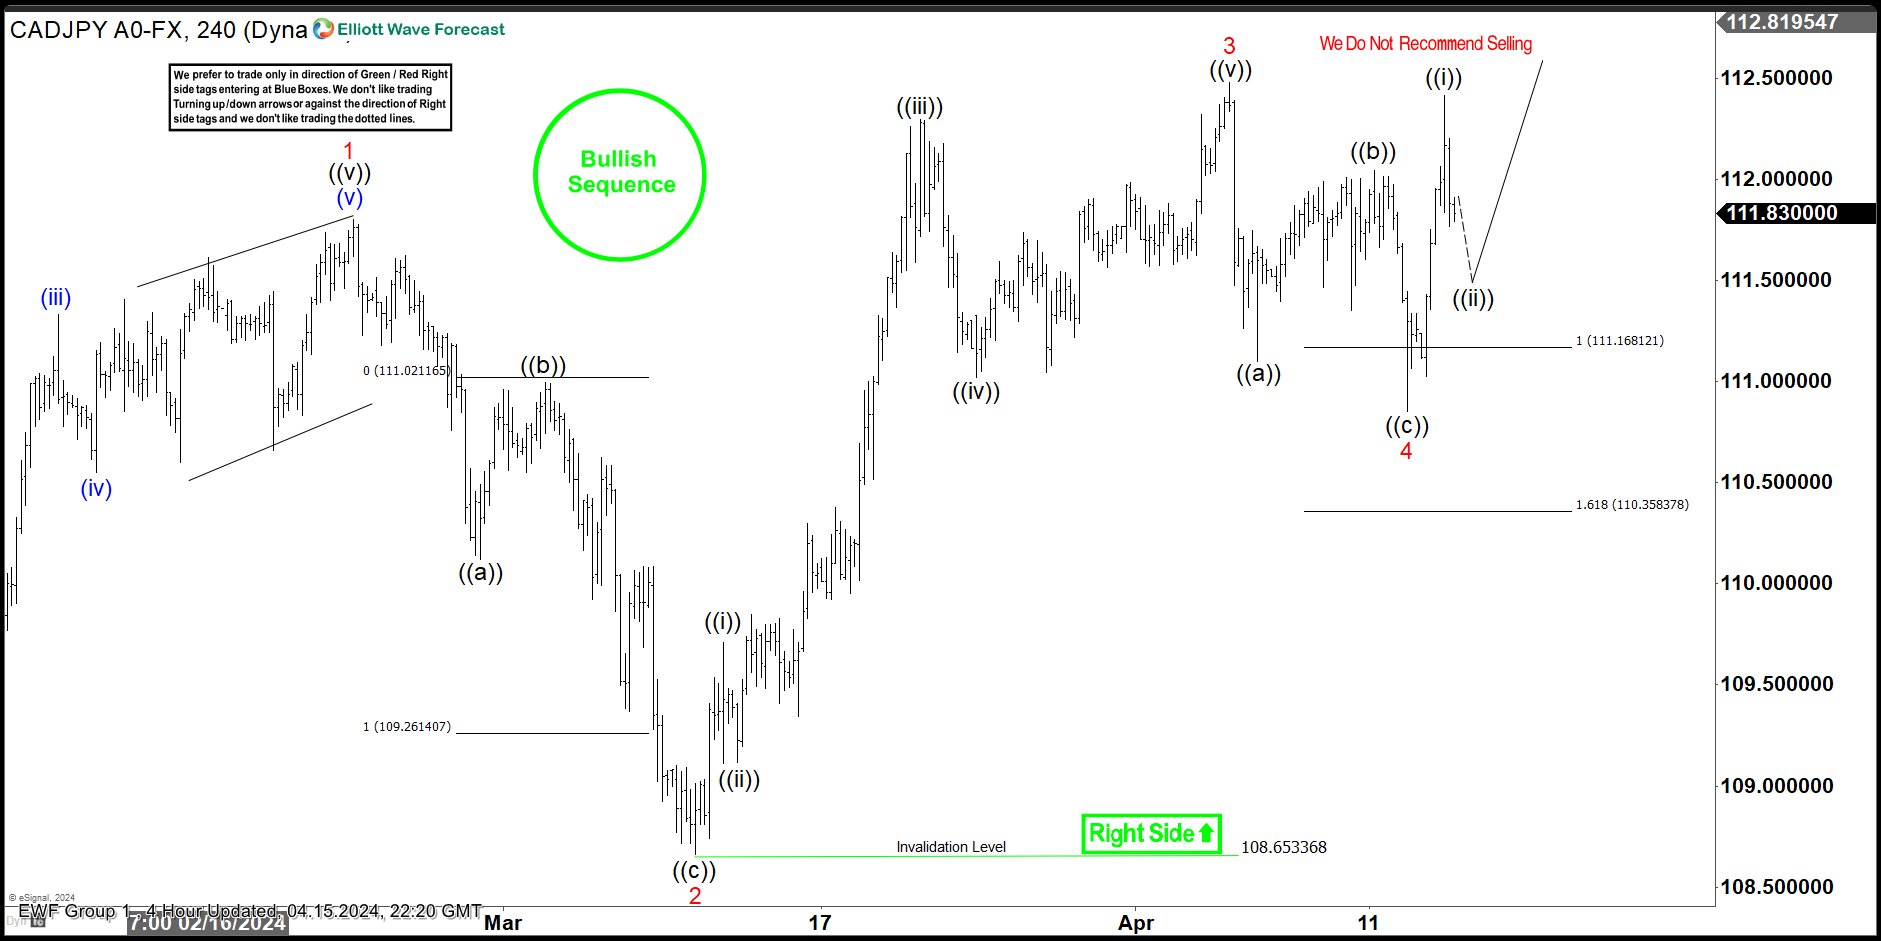
CADJPY Elliott Wave : Forecasting the Rally After 3 Waves Pull Back
In this technical blog we’re going to take a quick look at the Elliott Wave charts of CADJPY , published in members area of the website. As our members know we are favoring the long side in YEN pairs. Recently the pair has given us 3 waves pull back that found buyers right at the equal legs area. In the further text we are going to explain the Elliott Wave forecast.
CADJPY H4 Weekend Update 04.13.2024
CADJPY is giving us 4 red pullback against the 108.653 low. The current outlook indicates that the pullback may be evolving as an Elliott Wave Expanded Flat pattern. It’s crucial to observe that the extreme zone has already been reached at 111.168-110.358. We anticipate buyers to emerge in this area, potentially driving a further rally towards new highs or at least generating a three-wave bounce.
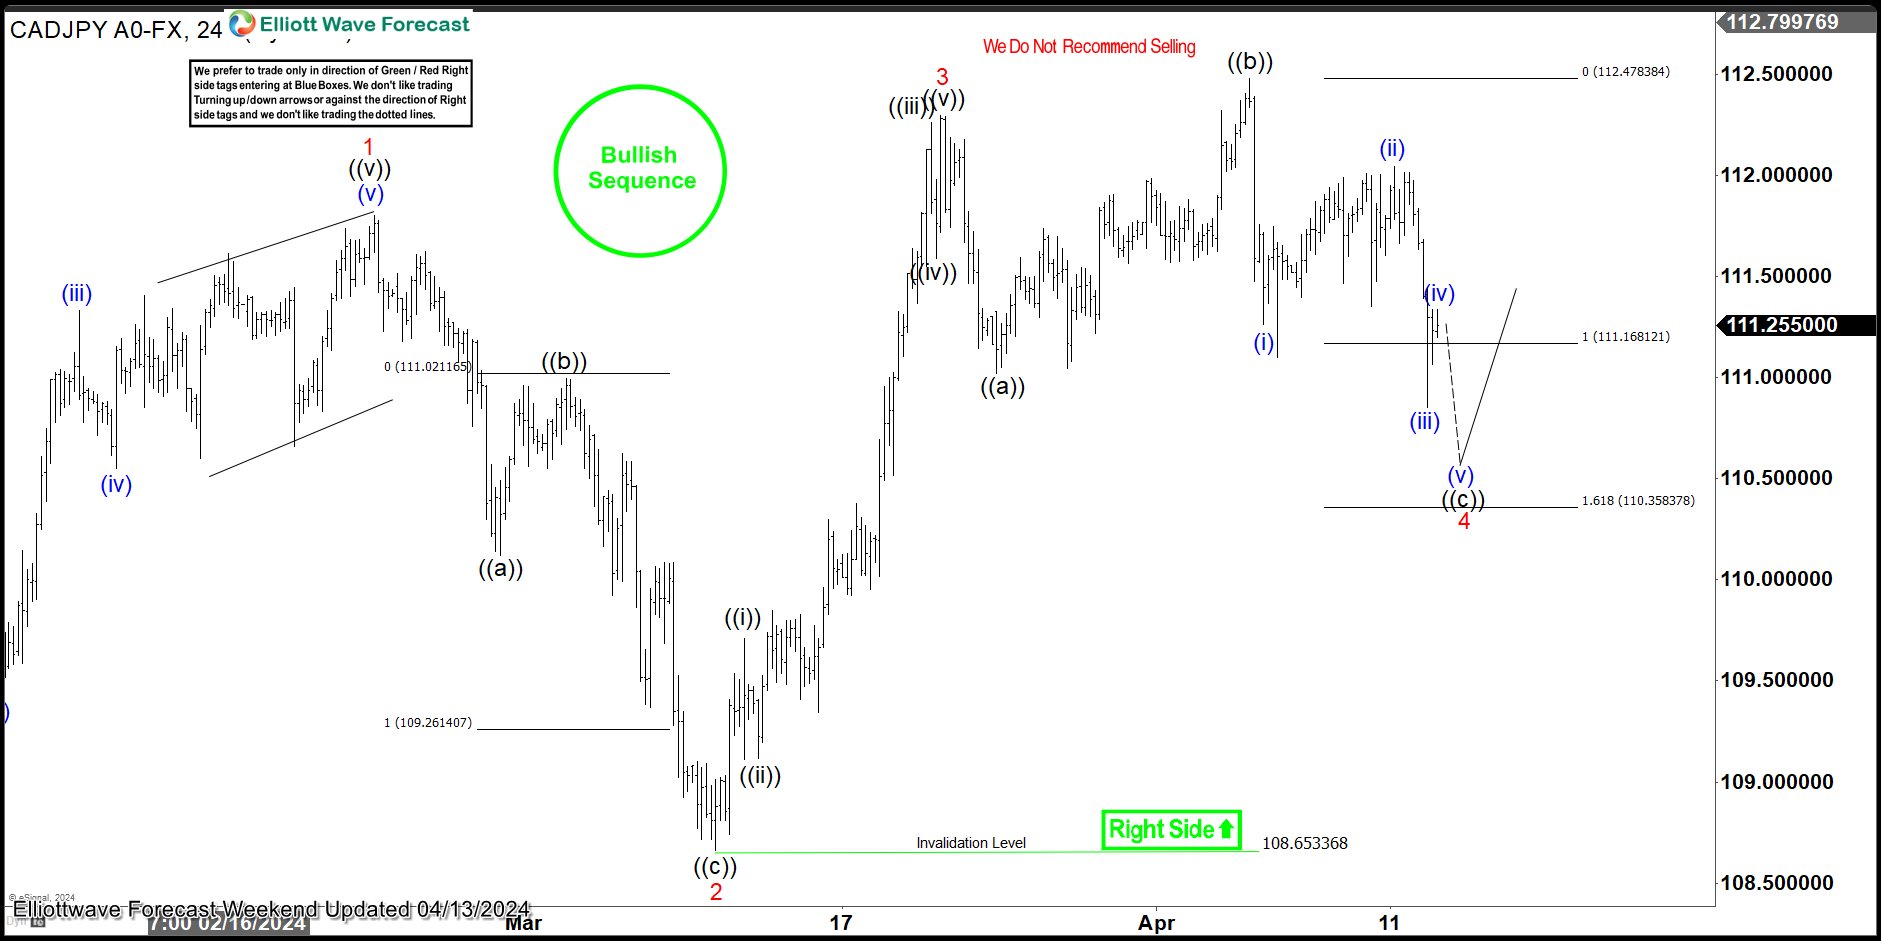
CADJPY H4 Update 04.13.2024
CADJPY has given us a nice reaction from the Equal Legs-Buyers zone as expected. We count wave 4 red pullback completed at the 110.854 low. Now, we would like to see a break of the 3 red peak to confirm that the next leg up is in progress. We don’t recommend selling the pair in any proposed pullback, and favor the long side.