Sample Category Title
AUDJPY Elliott Wave: Forecasting the Path
Hello fellow traders. In this technical blog we’re going to take a quick look at the Elliott Wave charts of AUDJPY Forex pair, published in members area of the website. As our members know we have been favoring the long side in YEN pairs. Recently we got a pull back that has made a clear 3 waves pull back that found buyers right at the equal legs area. In the further text we are going to explain the Elliott Wave forecast
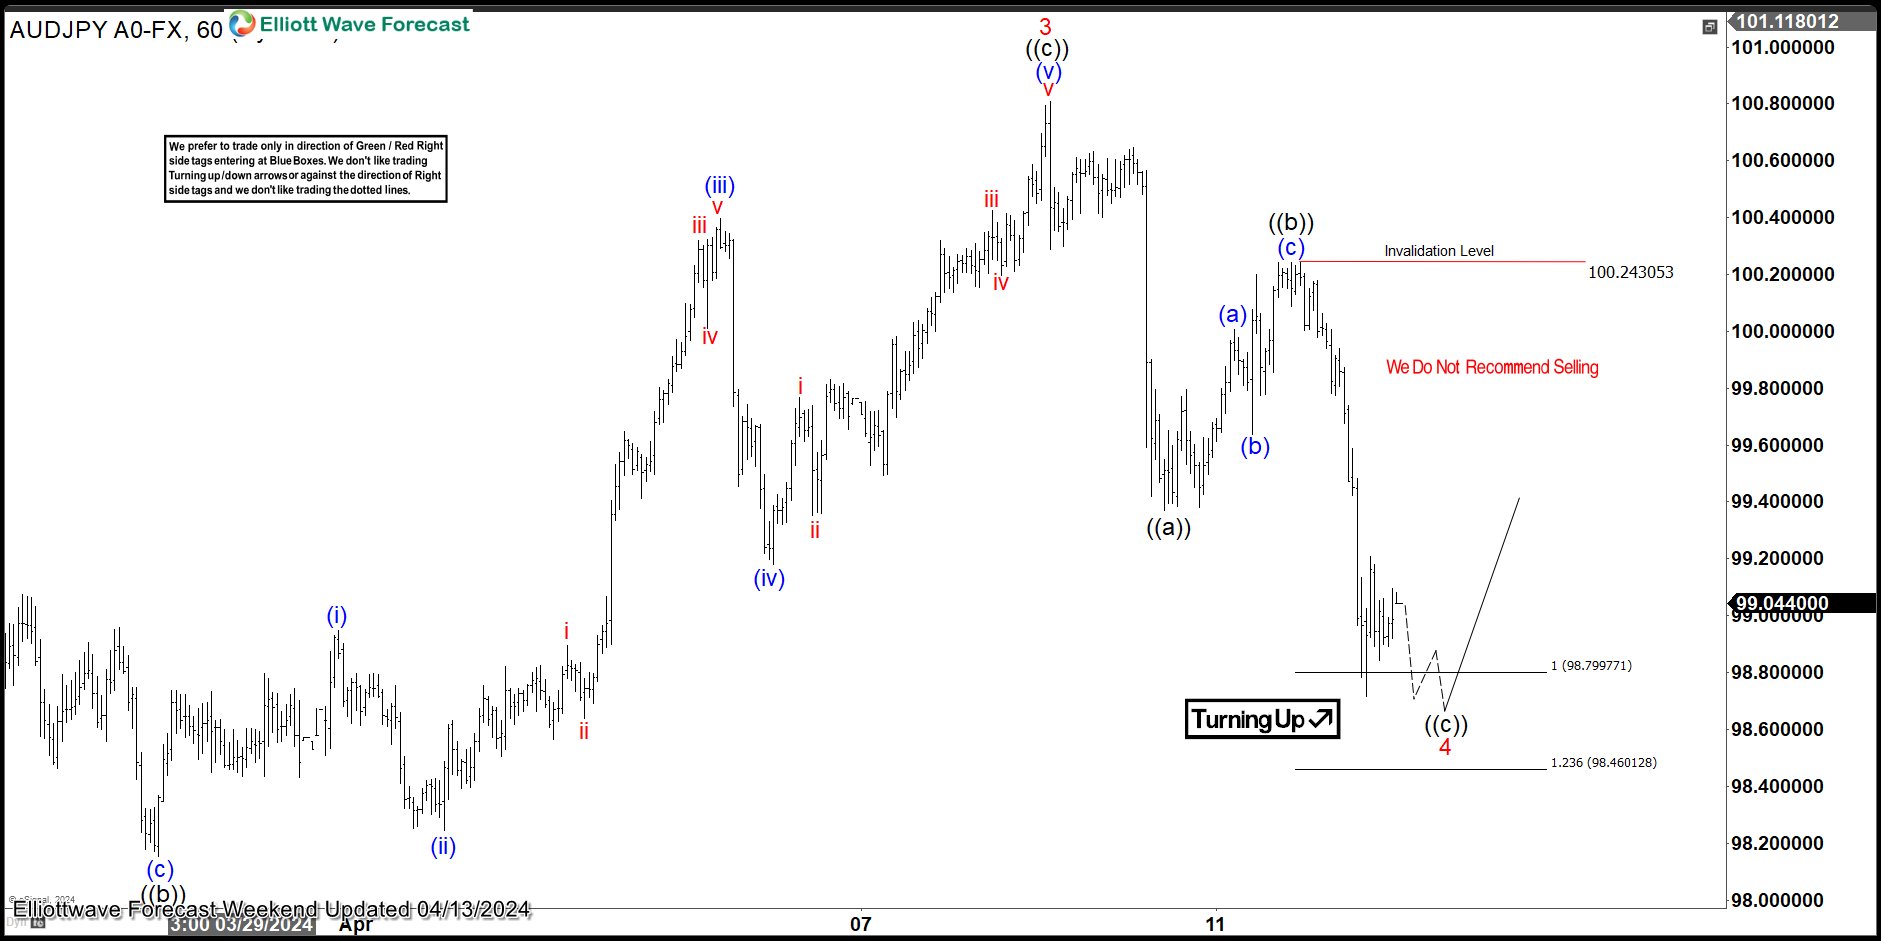
AUDJPY H1 Weekend Update 04.13.2024
AUDJPY ended cycle from the 96.8676 low and now correcting it. Current view suggests wave 4 red pull back can be unfolding as Elliott Wave Zig Zag Pattern. The Equal legs area is already reached at 98.799-98.460. We are aware that pull back can complete any moment. We don’t recommend selling the pair and expect further rally to resume from the buyers zone : 98.799-98.460.
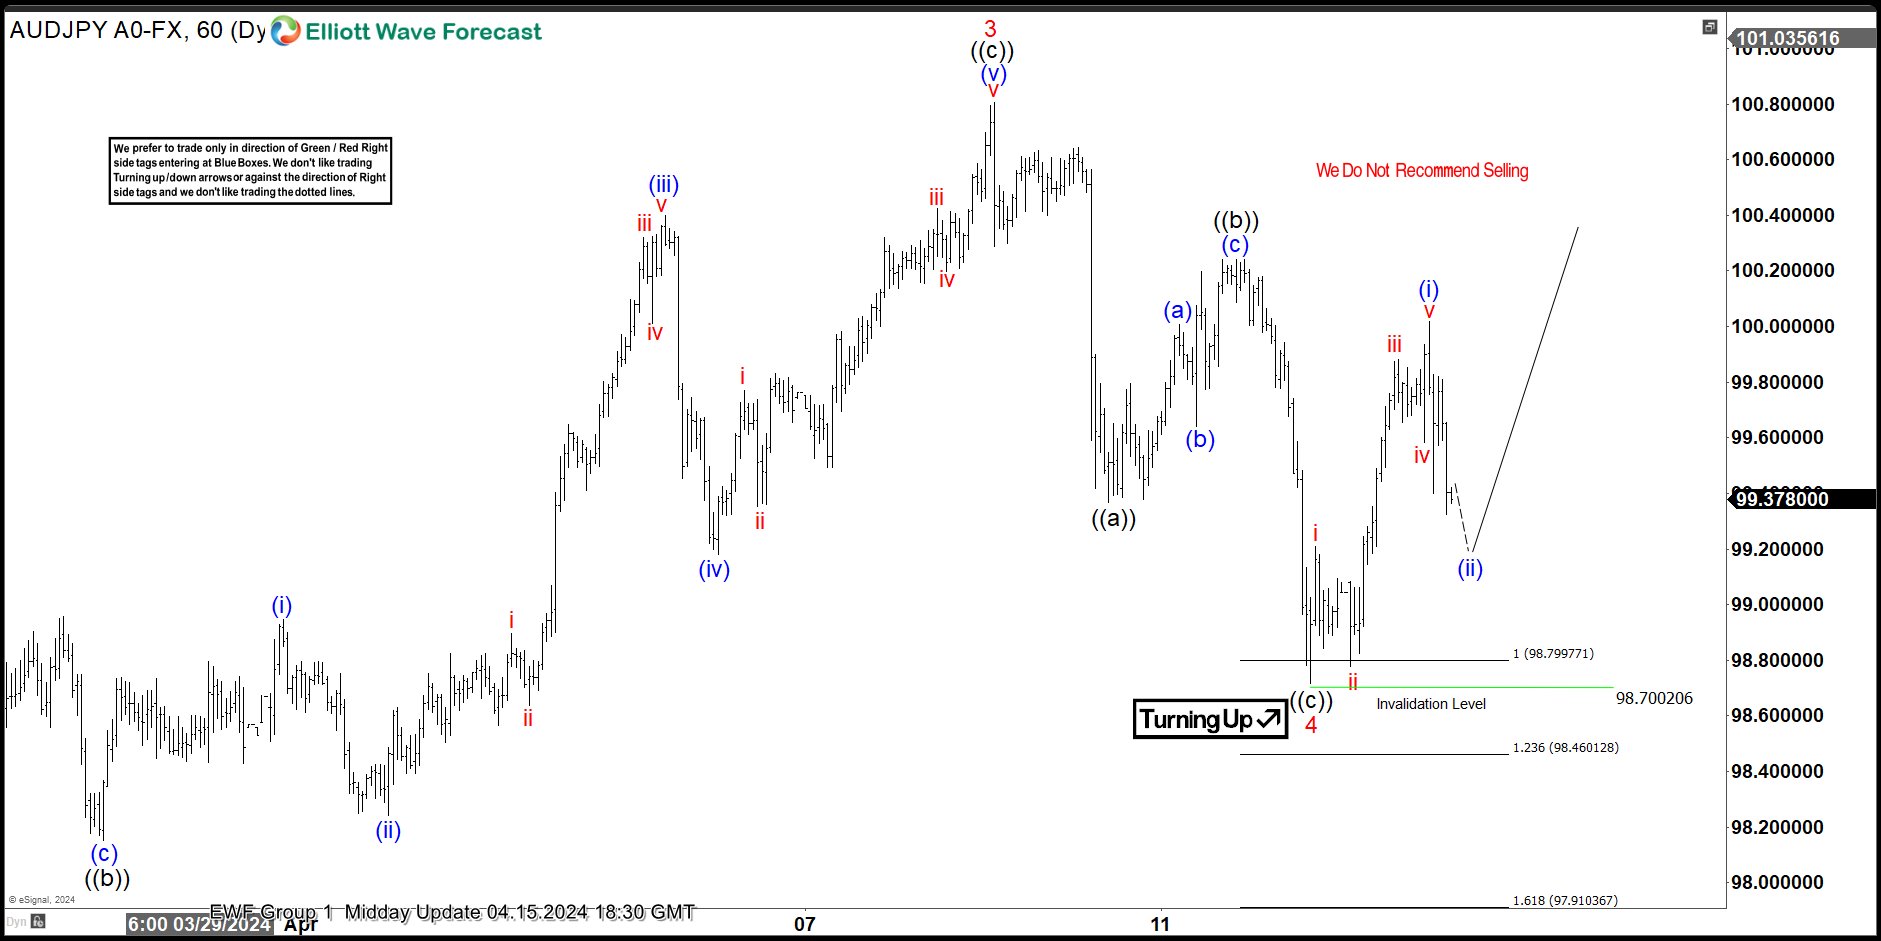
AUDJPY H1 Weekend Update 04.15.2024
AUDJPY has given us a nice reaction from the Equal Legs zone as expected. The bounce reached and exceeded 50% Fibonacci retracement against the ((b)) high, so we consider wave 4 red completed at the 98.7 low. We anticipate a break of the 3 red peak to confirm that the next leg up is in progress. Alternatively, if the price breaks below the 98.7 low, the pair will open up the possibility for a 7-swing pattern toward 97.963-97.476 area. In that case, any long positions will be stopped out at Break Even, and we will look to buy the dips again at the next set of equal legs.
ECB’s Rehn points to June rate cuts, but warns of geopolitical risks
ECB Governing Council member Olli Rehn highlighted in a statement that reduction in policy restrictions could commence in June as long as "inflation continues to fall as projected."
But he also addressed the predominant risks, identifying "geopolitics" as the primary source of uncertainty. He specifically pointed to the "deteriorating situation in Ukraine" and the "possible escalation of the Middle East conflict" as critical factors with potential ramifications on the European economy, especially concerning energy prices and overall economic stability.
Looking ahead to ECB's June meeting, the council will review an "updated assessment of the inflation outlook, the dynamics of underlying inflation, and the strength of monetary policy transmission."
This upcoming analysis will be crucial in determining whether ECB has sufficient confidence that inflation is sustainably converging towards its target, leading to a decision to "start to ease the stance of monetary policy and cut interest rates."
However, Rehn cautioned that this prospective easing is conditional on the absence of "further setbacks, for instance in the geopolitical situation and therefore in energy prices."
AUDUSD Breaks the Lower Bound of a Sideways Range
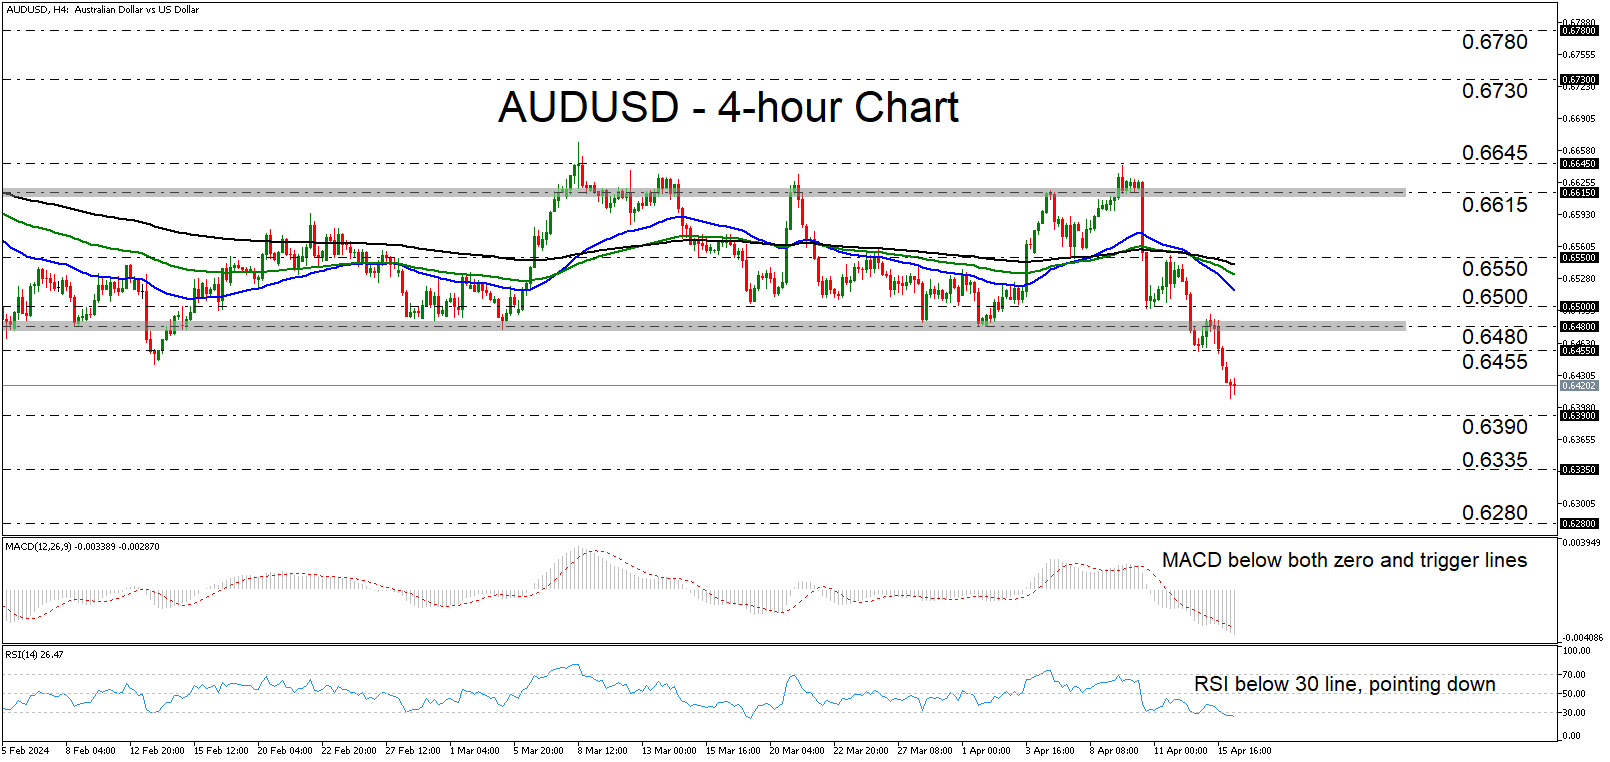
- AUDUSD extends slide after breaking lower bound of range
- MACD and RSI detect bearish momentum
- Break below 0.6390 could aim for 0.6335
- Recovery above 0.6500 could signal return within range
AUDUSD extended its tumble on Monday and during the Asian session Tuesday, falling below the key support barrier of 0.6455. On Friday, the pair broke below the lower end of a sideways range that was containing most of the price action since mid-January, and the dip below 0.6455 may have confirmed the shift in the near-term picture to bearish.
The short-term oscillators corroborate that view. The MACD is lying below both its zero and trigger lines, while the RSI is running below 30, pointing down as well.
If the bears are willing to stay in the driver’s seat, they could aim for the inside swing high of November 13, at around 0.6390, the break of which could extend the fall towards the low of the previous day, at around 0.6335. If there are no buyers to be found there either, then the next area to consider as support may be at around 0.6280. That zone stopped the pair from drifting lower on several occasions during October.
On the upside, a break back above 0.6500 may confirm the pair’s return within the aforementioned sideways range and thereby turn the outlook back to neutral. For the picture to be painted positively, AUDUSD may need to further recover and emerge above the upper bound of the range, at around 0.6615.
To sum up, AUDUSD continues to drift south after breaking the lower boundary of a sideways range that was in place since January. This has shifted the short-term outlook to bearish and suggests that further declines may be in store.
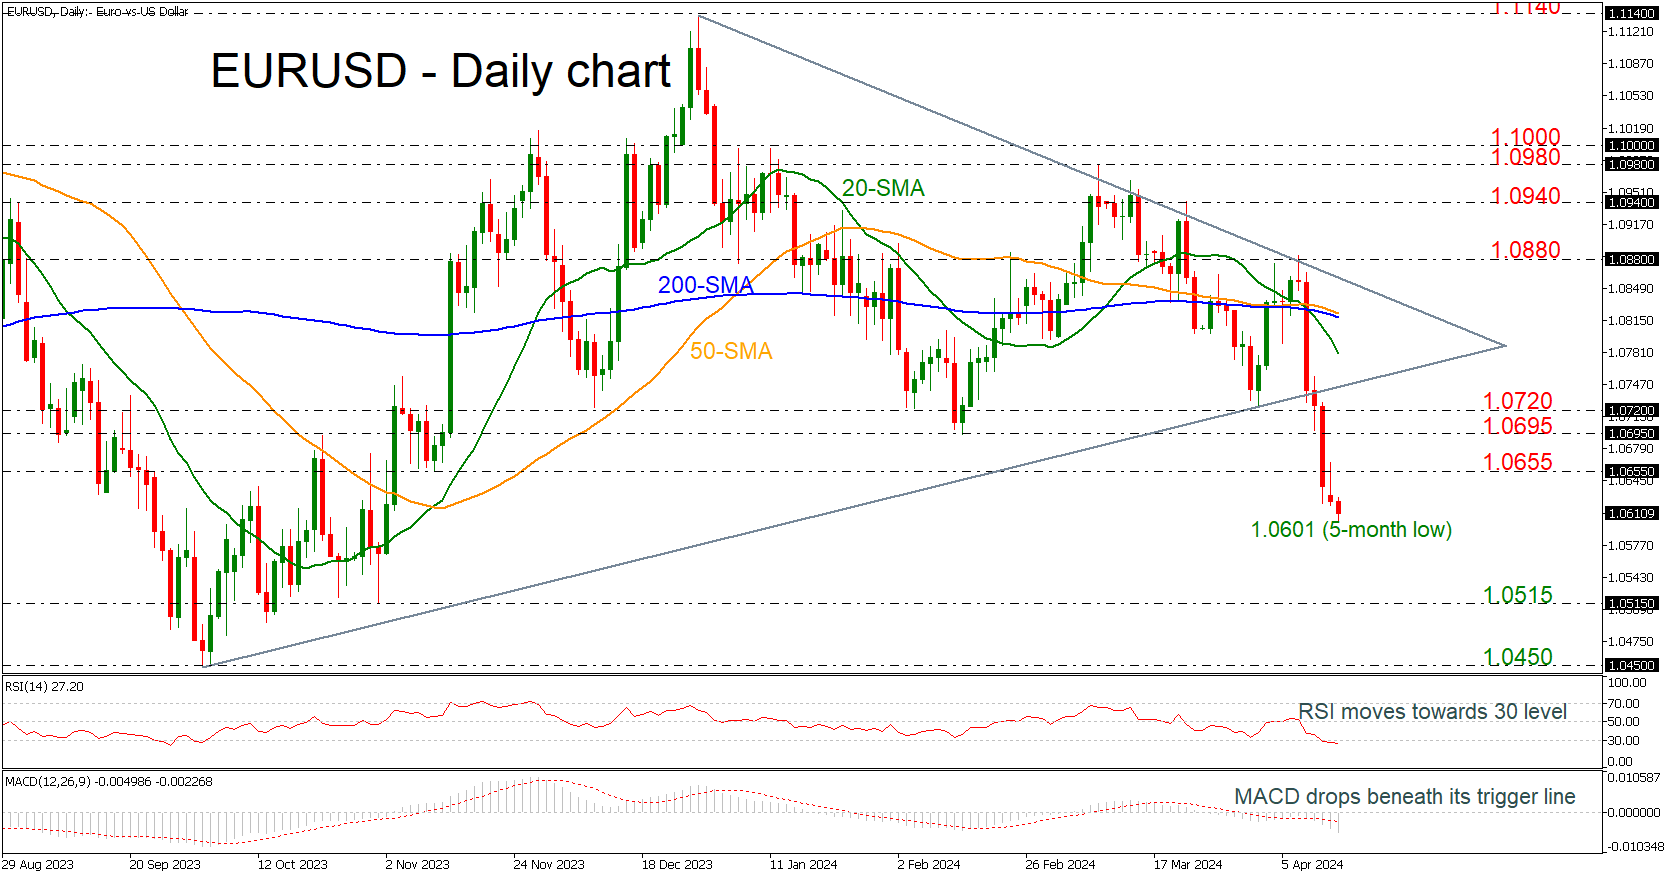
EURUSD Dives Further Near 1.0600
- EURUSD challenges new 5-month low
- Penetrates symmetrical triangle to the downside
- MACD and RSI continues bearish momentum
EURUSD has been losing more than 2.5% since the pullback from the 1.0880 resistance level and is challenging a new five month low around the 1.0600 handle. The market has been experiencing a strong sell-off over the last five days, switching the short-term outlook to bearish.
Technically, the RSI is holding beneath the 30 level, while the MACD is standing beneath its trigger and zero lines, strengthening its negative momentum.
In case the market extends its selling interest then the first support to watch is the 1.0515 barrier, taken from the lows on November 1. Even lower, the low from October at 1.0450 could be a critical level for steeper decreases.
On the flip side, an upside recovery may meet the 1.0655 resistance level ahead of the 1.0695-1.0720 restrictive region. The penetrated ascending trend line may act as resistance level together with 1.0760 before meeting the 20-day SMA at 1.0780.
To conclude, EURUSD is heading south, breaking the symmetrical triangle and opening the way for more losses.
WS Risk-Off Spilled Over to Asia
Markets
Markets yesterday initially reacted stoic to Saturday’s attack of Iran and against Israel. European and US equity markets even opened in green. Brent oil briefly dropped below the $90 p/b mark. Investors apparently expected any Israeli reaction to be guarded as the international community advocated de-escalation. Yields also resumed the uptrend that was interrupted on Friday. The focus from bond market also returned to the data. US March retail sales printed exceptionally strong both for headline (0.7 % M/M) and core measures (control group 1.1% m/m). The report reinforced recent market positioning assessing that the three rate hikes suggested in the March Fed dots is becoming ever more unlikely. US yields for maturities > 2-y touched new YTD peak levels. The former was blocked by the 5.0% barrier. Later, risk sentiment turned for the worse as Israeli officials warned the country will respond to the Iran attack. (US) equities gave of initially gains to close deep in red (Nasdaq -1.79%). Oil reversed course closing north $90 p/b. Especially short-term US yields ceded part of the early gains. Still, in a steepening move, yields closed between 2.4 bps (2-y) and 8.7 bps (30-y) higher. German yields showed similar gains (2-y +5.6 bps, 30-y 8.2 bps) but remain within the sideways consolidation pattern that is already in place since February. On FX markets, the dollar continues to outshine peers. The trade-weighted index DXY regained the 106 mark (106.21). USD/JPY touched a new 34-y top (close 154.28). EUR/USD saw more follow-through losses on Friday’s break below 1.0695 (close 106.24).
Yesterday’s WS risk-off spilled over to Asia this morning with regional indices losing up to 2.0%. Chinese data published this morning (cf infra) don’t help to improve sentiment. Still US Treasuries struggle to avoid further losses (+1 bp). The dollar outperforms (EUR/USD 1.0615, USD/JPY 134.35). Later today, the eco calendar is modestly interesting including ZEW confidence in Germany. In the US, building permits & housing starts and March production data will be released. Even in a risk-off context, bonds probably aren’t in a good position to play a safe haven role as inflationary risks won’t disappear anytime soon. At the same time, the dollar has few contenders to rival its save haven credentials. EUR/USD 1.0611 (76% retracement Oct/Jan) is the finally hurdle for a return to the 2023 low (1.0448). UK labour data published this morning were mostly weaker than expected. Employment in the 3 months to February declined sharply (-156k vs +74k expected). The unemployment rate jumped from 4.0% to 4.2%. Average weekly earnings eases marginally less than expected. Sterling declines in a first reaction (EUR/GBP 0.854).
News & Views
Chinese growth beat expectations but it’s only a shallow victory. GDP expanded 1.6% q/q in 2024Q1, accelerating from an upwardly revised 1.2% in Q4 2023 and topping the 1.5% analyst estimate. The accompanying monthly data releases shed some light on the composition. Fixed asset investment gained steam in March, accelerating to 4.5% y/y. The upswing, however, was almost entirely driven by state investments growing 7.8% vs a mere 0.5% growth in private investments. Industrial production slowed, both by state-owned companies and privately owned ones. The headline figure dropped to 4.5%. Retail sales offered little reasons to cheer as well with a deceleration to 3.1% y/y, down from the 5.5% gain in the first two months of the year and even further down from December’s 7.4%. Both industrial production and retail sales missed expectations by a wide margin. Property investment tumbled 9.5% in March, suggesting few to no signs of improvement in the giant but ailing sector. The Chinese yuan understandably quickly erased a kneejerk move higher in the wake of the release. USD/CNY traded at 7.2304 at this morning’s low-point before recovering to 7.2376 currently – near the weakest level since mid-November. It is this ongoing CNY weakness that prevents the Chinese central bank to drastically cut rates to jumpstart the economy, especially against the background of a Fed that has its hands tied because of stubbornly high inflation and ongoing economic strength.
The EU stepped up the trade offensive against China by unleashing a series of probes. It already launched an investigation into Chinese subsidies for electric vehicles and concluded last month that there was “sufficient evidence” of that, paving the way for import duties by July at the earliest. In addition, the EU will now look into the possibility of illegal support for Chinese windparks on European soil and for solar and railway firms. It will also launch an inquiry into China’s procurement of medical devices in the short run.
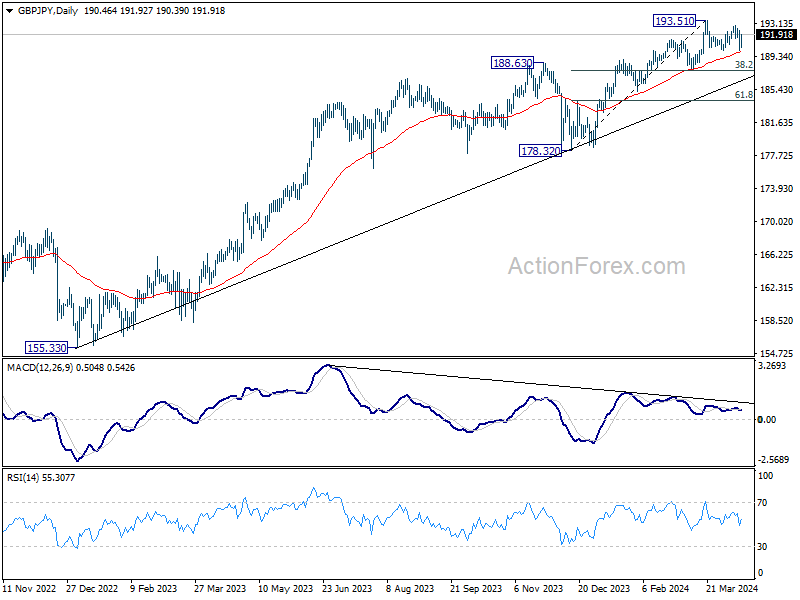
GBP/JPY Daily Outlook
Daily Pivots: (S1) 190.70; (P) 191.71; (R1) 193.01; More..
Range trading continues in GBP/JPY and intraday bias stays neutral for the moment. On the upside, break of 193.51 will resume larger up trend to 195.86 long term resistance. Nevertheless, decisive break of 189.97 support will indicate that it's at least correcting the rise from 178.32, and target 38.2% retracement of 178.32 to 193.51 at 187.70.
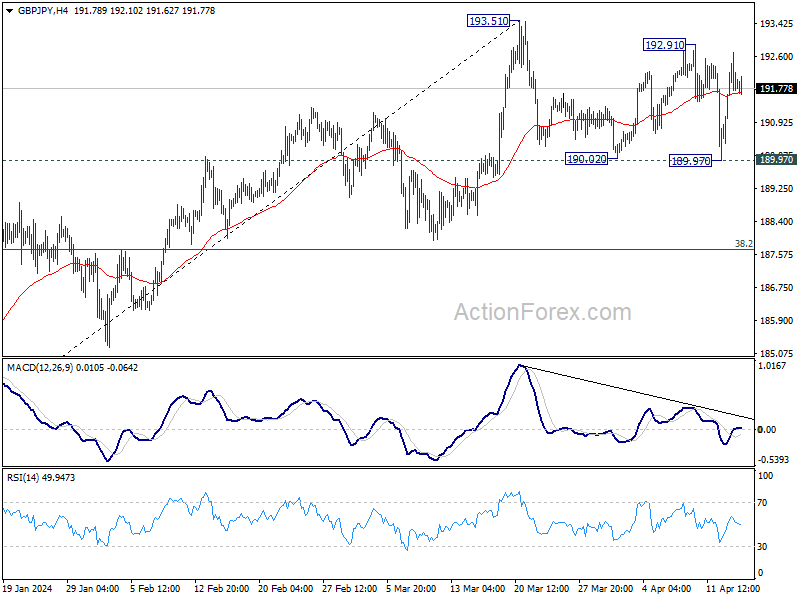
In the bigger picture, current rally is part of the up trend from 123.94 (2020 low), and is in progress for 195.86 long term resistance (2015 high). Break of 187.94 support is needed to be the first sign of medium term topping. Otherwise, outlook will remain bullish in case of retreat.
EUR/JPY Daily Outlook
Daily Pivots: (S1) 162.90; (P) 163.67; (R1) 164.68; More...
Range trading continues in EUR/JPY and intraday bias stays neutral. On the upside, firm break of 165.33 will resume larger up trend towards 169.96 key resistance next. However, decisive break of 162.26 support will argue that it's at least correcting the rise from 153.15, and target 38.2% retracement of 153.15 to 165.33 at 160.67.
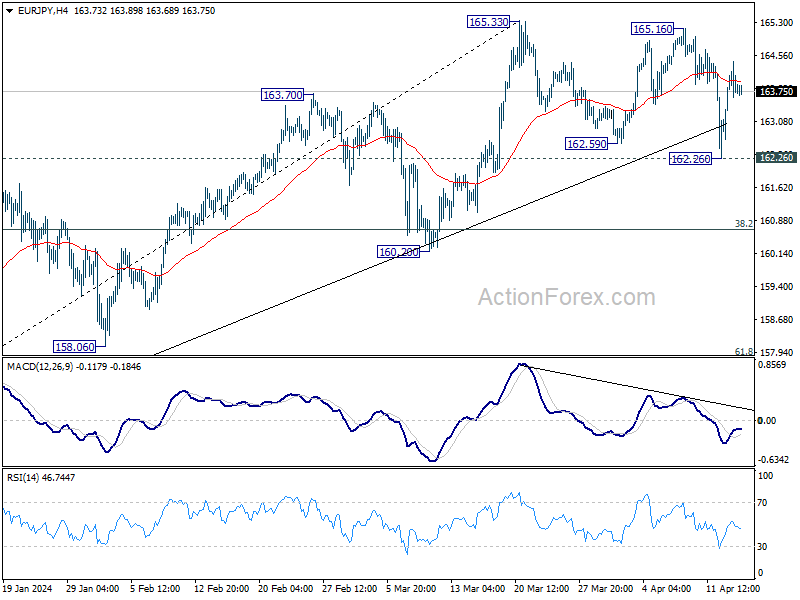
In the bigger picture, current rally is part of the up trend from 114.42 (2020 low), which is still in progress. Next target is 169.96 (2008 high). Break of 160.20 support is needed to be the first sign of medium term topping. Otherwise, outlook will stay bullish in case of retreat.

EUR/GBP Daily Outlook
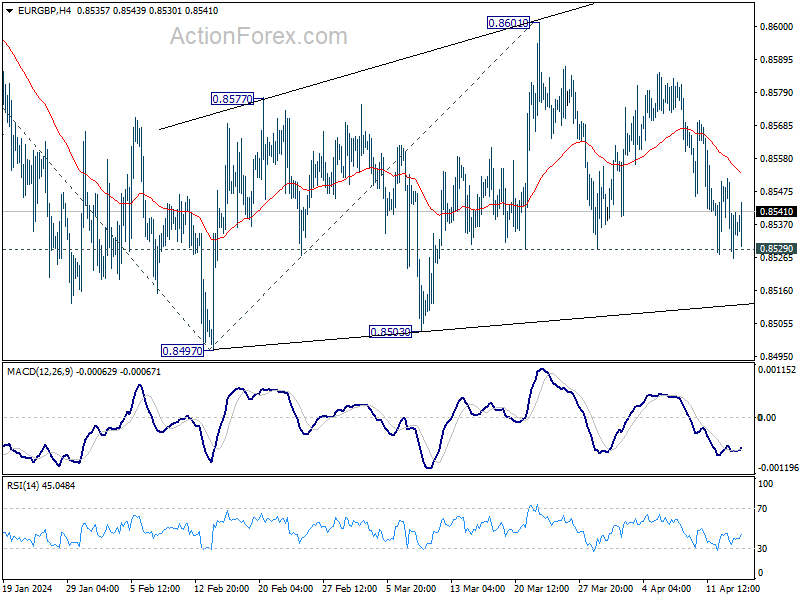
Daily Pivots: (S1) 0.8525; (P) 0.8539; (R1) 0.8551; More...
Outlook in EUR/GBP remains unchanged as range trading continues. Intraday bias stays neutral at this point. On the downside, firm break of 0.8529 support will argue that the corrective recovery from 0.8497 has completed at 0.8601. Intraday bias will be back on the downside for retesting 0.8497 low next. On the upside, break of 0.8601 will resume the rebound instead.
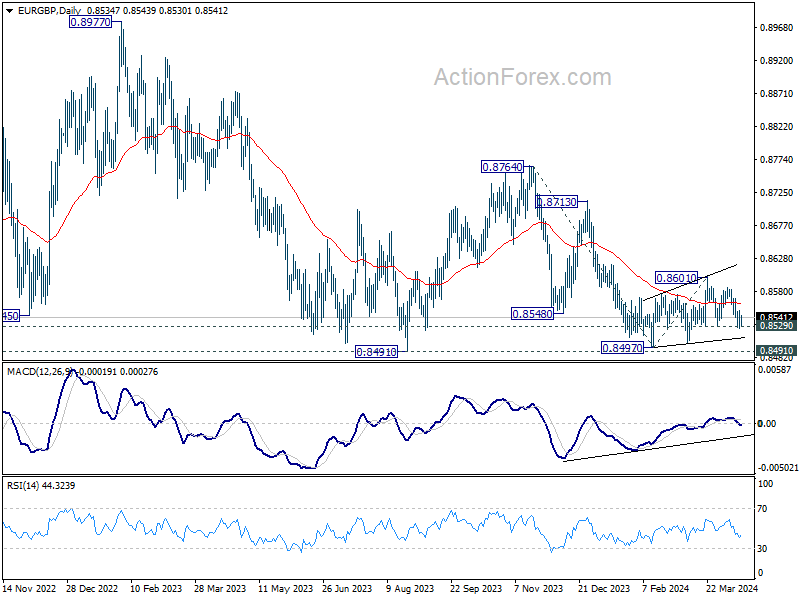
In the bigger picture, there is no clear sign that down trend from 0.9267 has completed, despite loss of downside momentum as seen in D MACD. As long as 0.8601 resistance holds, the down trend will remain in favor to resume through 0.8491 low at la later stage.
EUR/AUD Daily Outlook
Daily Pivots: (S1) 1.6438; (P) 1.6468; (R1) 1.6521; More...
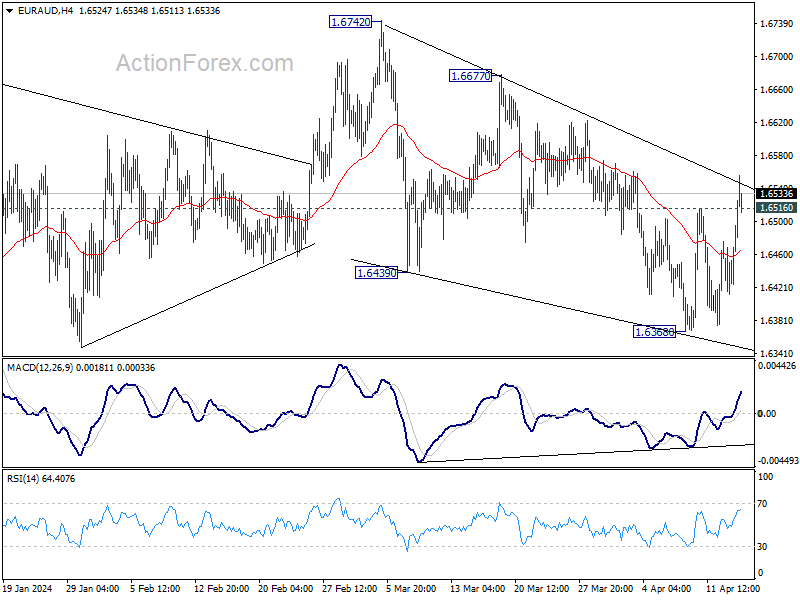
Intraday bias in EUR/AUD turned back to the upside with break of 1.6516 resistance. Further rally would be seen to 1.6677 resistance next. Break there will confirm that correction from 1.6742 has completed, and bring further rally through this high. On the downside, though, break of 1.6368 will resume the fall from 1.6742 instead.
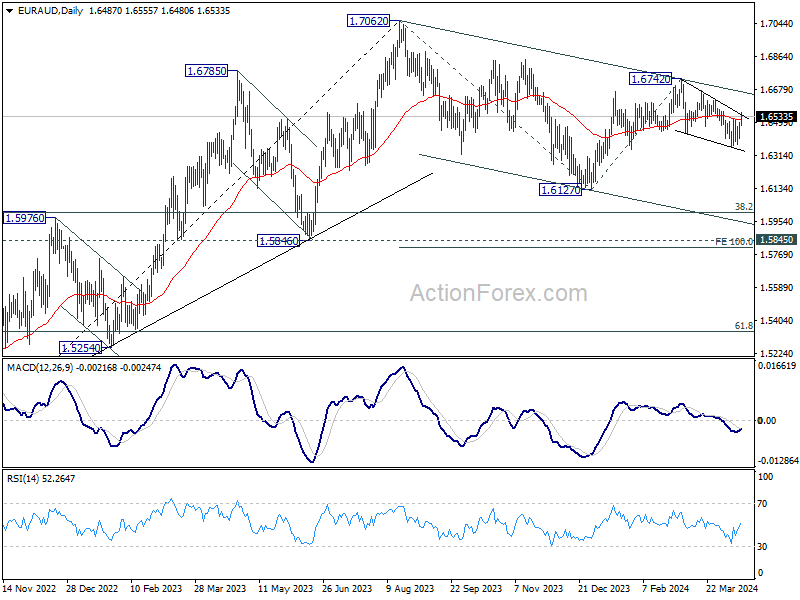
In the bigger picture, fall from 1.7062 medium term top is seen as a correction to the up trend from 1.4281 (2022 low). The correction is probably still in progress with fall from 1.6742 as the third leg. Strong support is expected around 1.5846 and 38.2% retracement of 1.4281 to 1.7062 at 1.6000 to bring rebound.
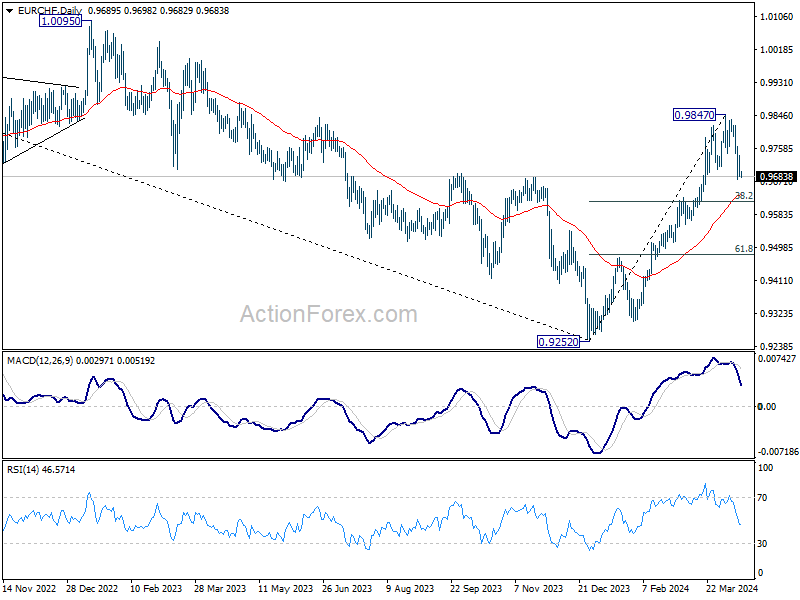
EUR/CHF Daily Outlook
Daily Pivots: (S1) 0.9662; (P) 0.9702; (R1) 0.9721; More...
No change in EUR/CHF's outlook as correction from 0.9847 is in progress. Intraday bias stays mildly on the downside for 38.2% retracement of 0.9252 to 0.9847 at 0.9620. But strong support is expected from there to contain downside to bring rebound, and set the range for the consolidation pattern from 0.9847. On the upside, above 0.9745 minor resistance will turn bias back to the upside for retesting 0.9847 instead.
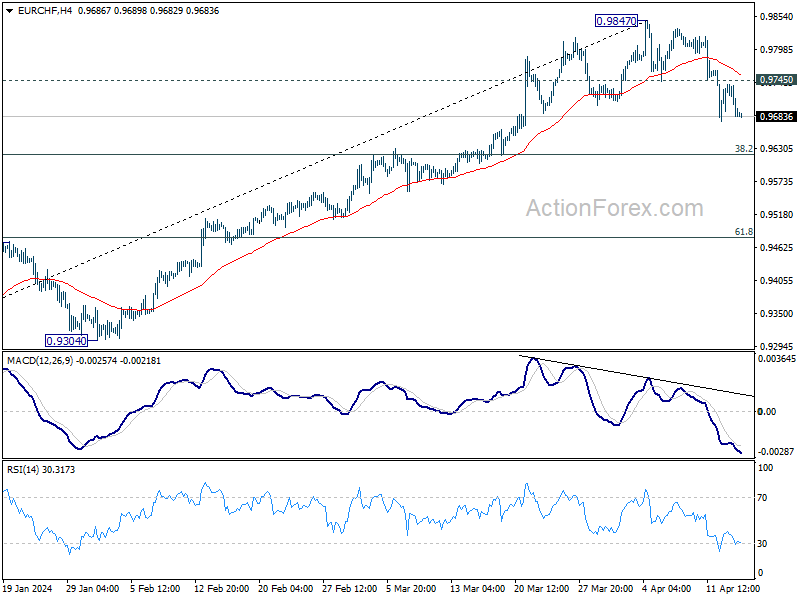
In the bigger picture, a medium term bottom should be in place at 0.9252 already, on bullish convergence condition in W MACD. Rise from there now target 38.2% retracement of 1.2004 (2018 high) to 0.9252 (2023 low) at 1.0303, even as a correction to the down trend from 1.2004. This will remain the favored case as long as 55 D EMA (now at 0.9636) holds.