Sample Category Title
USD/CHF Mid-Day Outlook
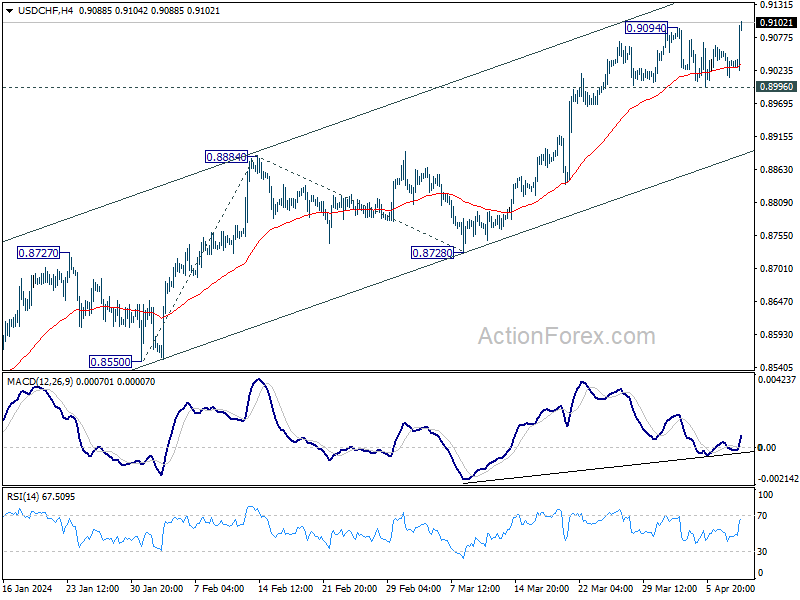
Daily Pivots: (S1) 0.9011; (P) 0.9038; (R1) 0.9064; More....
Intraday bias in USD/CHF is back on the upside with break of 0.9094 resistance. Current rise is part of the whole rally from 0.8332. Next target is 161.8% projection of 0.8550 to 0.8884 from 0.8728 at 0.8818. For now, near term outlook will stay bullish as long as 0.8996 support holds, in case of retreat.
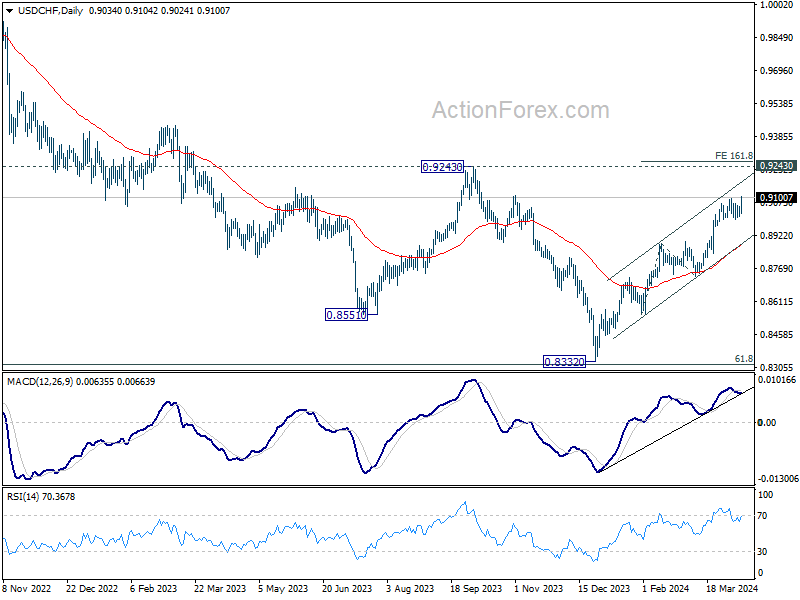
In the bigger picture, price actions from 0.8332 medium term bottom as tentatively seen as developing into a corrective pattern to the down trend from 1.0146 (2022 high). Further rise would be seen as long as 0.8728 support holds. But upside should be limited by 0.9243 resistance, at least on first attempt.
US: Core Inflation Comes in on the Hotter Side for a Third Consecutive Month
The Consumer Price Index (CPI) rose 0.4% month-on-month (m/m) in March, in line with the consensus forecast. On a twelve-month basis, CPI inched higher to 3.5% (from 3.2% in February).
- Energy prices were driven higher by further gains in gasoline prices (+1.7% m/m) and electricity costs (+0.9% m/m). Food prices ticked up 0.1% m/m and are up 2.2% from year-ago levels.
Excluding food & energy, core prices rose 0.4% m/m – ahead of the consensus forecast calling for a more modest gain of 0.3% m/m. Relative to March 2023, prices were up 3.8% – unchanged from the month prior.
Core service prices were the main factor behind a hot core reading. Core services prices rose 0.5% m/m and are up an elevated 5.4% year-over-year. Shelter costs were again the biggest contributor to last month's rise in core inflation, with both owners' equivalent rent (+0.4% m/m) and rent of primary residence (+0.4% m/m) notching solid gains. But non-housing services were even stronger, rising 0.6% m/m – an acceleration from last month's 0.45% gain – pushing the twelve-month change up to a 10-month high of 4.6%.
After recording a modest gain in February, core goods prices turned lower in March – falling 0.2% m/m. Prices for goods have been either flat or have declined in 9 of the past 10 months.
Key Implications
That is now three inflation reports that have come in on the 'hotter' side. At this point, the 'bump in the road' that Fed officials have been alluding to is starting to look more like a hill. Perhaps the only encouraging element of this morning's report was the fact that goods prices slipped back into deflationary territory. Beyond that, there were virtually no signs of 'further progress'. The three-month annualized change on core inflation ticked up to 4.5% (from 4.2%), while both the six-month annualized and twelve-month change held steady at 3.8% and 3.9%, respectively.
Following this morning's release, Treasury yields have shot higher and equity futures have sold-off. Pricing for a June cut has slipped to just 22%, and for good reason. Between now and the June FOMC meeting, Fed officials will only see two more inflation reports. Given the acceleration in inflation over the past three months, these reports are unlikely to be enough to instill greater confidence that inflation remains on a sustainable path back to 2%. For this reason, we favor the Fed waiting until July to cut rates
USD/JPY Mid-Day Outlook
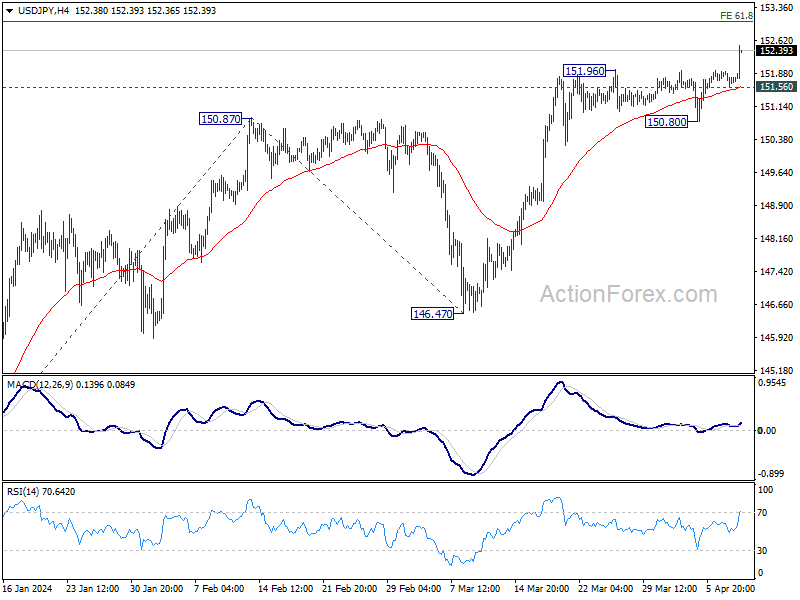
Daily Pivots: (S1) 151.59; (P) 151.76; (R1) 151.96; More...
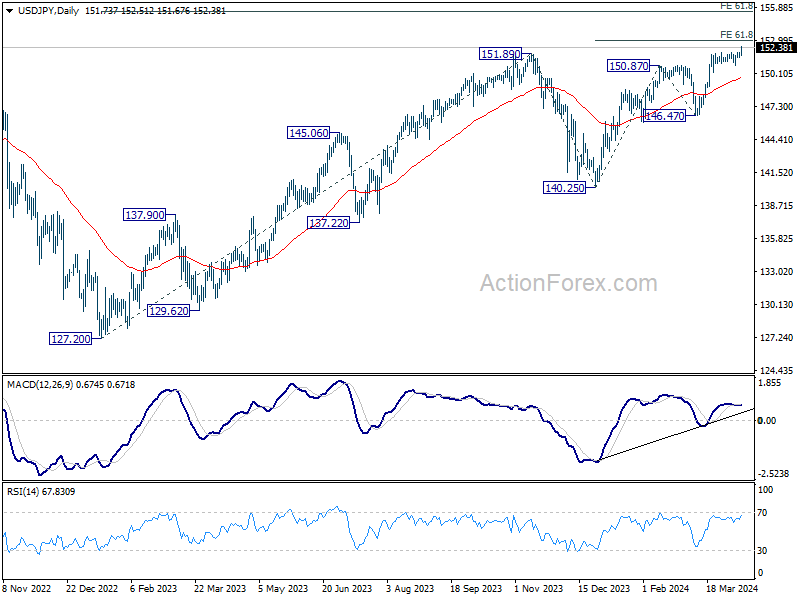
USD/JPY's surges to as high as 151.51 so far, and the break of 151.93 key resistance indicates long term up trend resumption. Intraday bias is back on the upside. Next target is 61.8% projection of 140.25 to 150.87 from 146.47 at 153.03. On the downside, below 151.56 minor support will turn intraday bias neutral again. But outlook will stay bullish as long as 150.80 support holds.
In the bigger picture, correction from 151.87 (2023) high could have completed at 140.25 already. Rise from 127.20 (2023 low), as part of the long term up trend, is probably ready to resume. Decisive break of 151.93 resistance (2022 high) will confirm this bullish case. Next medium term target will be 61.8% projection of 127.20 to 151.89 from 140.25 at 155.20. This will remain the favored case as long as 146.47 support holds, in case of another pullback.
US CPI Sparks Strong Dollar Rebound, USD/JPY Breaks 152
Dollar is having a strong, broad-based rebound in early US session, driven by upside surprises in CPI data. The concern for Fed stems not just from the headline inflation spurred by rising energy costs. But more significantly, core inflation failed to slow again, arguing that disinflation progress has stalled further.
The market's attention is now shifted to the forthcoming minutes from FOMC's March meeting. The split in Fed policymakers' projections, revealed through the dot plot, underscores the uncertain path ahead. With 10 officials forecasting three rate cuts this year and nine others suggesting two or fewer, the upcoming minutes are eagerly awaited for deeper insights into Fed's internal debate and the balance between hawkish and dovish views.
In terms of market reactions, the inflation report lead to sharp increase in 10-year yields, pushing towards 4.5%, and steep decline in stock futures. Additionally, USD/JPY breaks through critical 152, a level that could trigger intervention by Japan. This development positions the currency pair at the center of attention in the upcoming Asian session, with market participants eyeing Japan's response.
In the broader currency landscape, Dollar's ascent positions it as the current market leader, followed by Yen. New Zealand Dollar, despite an initial boost from a hawkish RBNZ, slid to one of the second weakest position, just ahead of Australian Dollar. Canadian Dollar remains in limbo, with markets awaiting BoC's rate decision, while Sterling slightly outperforms other European majors like the Euro and Swiss Franc.
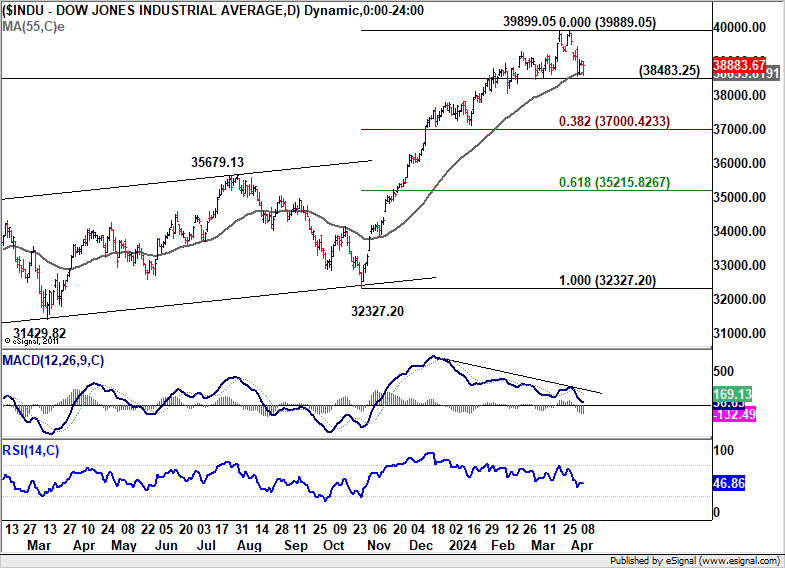
Technically, one focus for the US session is whether DOW would dive through 38483.25 near term support, and close below there. If realized, that would indicate that DOW is at least in a correction to the rally from 32327.20, and target 38.2% retracement of 32327.20 to 39899.05 at 37000.42 next.
In Europe, at the time of writing, FTSE is up 0.42%. DAX is up 0.19%. CAC is up 0.04%. UK 10-year yield is up 0.075 at 4.107. Germany 10-year yield is up 0.054. Earlier in Asia, Nikkei fell -0.48%. Hong Kong HSI rose 1.85%. China Shanghai SSE fell -0.70%. Singapore Strait Times rose 0.67%. Japan 10-year JGB yield rose 0.014 to 0.799.
US CPI jumps to 3.5% yoy in Mar, CPI core unchanged at 3.8% yoy
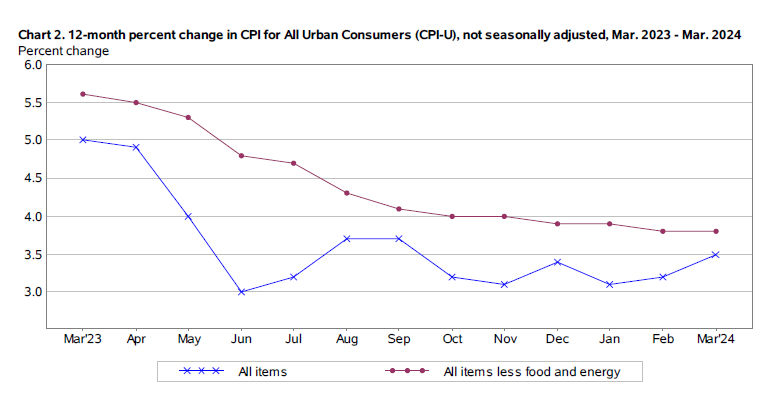
US CPI rises 0.4% mom in March, above expectation of 0.3% mom. CPI core (all items less food and energy) rises 0.4% mom, also above expectation of 0.3% mom. Energy index rose 1.1% mom. Food index rose 0.1% mom.
For the 12 months period, CPI accelerated from 3.2% yoy to 3.5% yoy, above expectation of 3.4% yoy. CPI core was unchanged at 3.8% yoy, above expectation of 3.7% yoy. Energy index was up 2.1% yoy while food index was up 2.2% yoy.
RBNZ holds OCR steady, no room for delay in bring down inflation to target band
RBNZ maintained Official Cash Rate unchanged at 5.50%, aligning with market expectations. This decision comes with reiterated commitment to "restrictive monetary policy stance," deemed necessary to alleviate capacity pressures and guide inflation back within the target range of 1 to 3 percent within "this calendar year".
During the recent meeting, members concurred that there has been "no material change in economic outlook" since their February Statement. There remains a "limited tolerance" for prolonging the timeframe to meet the inflation target, especially with inflation expectations and pricing intentions continuing to "remain elevated".
The "persistence of services inflation" and "elevated" goods price inflation were identified as continuous risks, with expected near-term increases in local government rates, insurance, and utility costs potentially decelerating the reduction in headline inflation.
On the flip side, RBNZ acknowledges potential downside risks to the inflation outlook, notably the impact of continued restrictive monetary policy amid weak global growth. This environment could precipitate a quicker than anticipated reduction in inflation. Weak business and consumer confidence, coupled with potential increases in unemployment and financial stress, are areas of concern. Additionally, structural economic challenges in China are highlighted as significant, given its critical role in the global economy and as a major trading partner for New Zealand.
BoJ's Ueda: Accommodative monetary policy to continue
In today's parliamentary address, BoJ Governor Kazuo Ueda reaffirmed the Bank of Japan's stance on continuing its accommodative monetary policy, underscoring the short-term interest rate as the "primary policy tool."
A key focus for BoJ, as Ueda noted, is the scrutiny of trend inflation's progress towards 2% target in judging "appropriate degree of monetary support."
Meanwhile, Ueda clarified that BoJ would not alter its monetary policy solely in response to FX fluctuations. However, he acknowledged that significant FX movements, if they lead to an unexpected increase in import prices and thereby risk elevating trend inflation beyond projections, could necessitate a reassessment of monetary policy.
USD/JPY Mid-Day Outlook
Daily Pivots: (S1) 151.59; (P) 151.76; (R1) 151.96; More...
USD/JPY's surges to as high as 151.51 so far, and the break of 151.93 key resistance indicates long term up trend resumption. Intraday bias is back on the upside. Next target is 61.8% projection of 140.25 to 150.87 from 146.47 at 153.03. On the downside, below 151.56 minor support will turn intraday bias neutral again. But outlook will stay bullish as long as 150.80 support holds.
In the bigger picture, correction from 151.87 (2023) high could have completed at 140.25 already. Rise from 127.20 (2023 low), as part of the long term up trend, is probably ready to resume. Decisive break of 151.93 resistance (2022 high) will confirm this bullish case. Next medium term target will be 61.8% projection of 127.20 to 151.89 from 140.25 at 155.20. This will remain the favored case as long as 146.47 support holds, in case of another pullback.
Economic Indicators Update
| GMT | Ccy | Events | Actual | Forecast | Previous | Revised |
|---|---|---|---|---|---|---|
| 23:50 | JPY | Bank Lending Y/Y Mar | 3.20% | 3.10% | 3.00% | |
| 23:50 | JPY | PPI Y/Y Mar | 0.80% | 0.80% | 0.60% | 0.70% |
| 02:00 | NZD | RBNZ Rate Decision | 5.50% | 5.50% | 5.50% | |
| 08:00 | EUR | Italy Retail Sales M/M Feb | 0.10% | 0.20% | -0.10% | |
| 12:30 | CAD | Building Permits M/M Feb | 9.30% | -3.50% | 13.50% | 12.90% |
| 12:30 | USD | CPI M/M Mar | 0.40% | 0.30% | 0.40% | |
| 12:30 | USD | CPI Y/Y Mar | 3.50% | 3.40% | 3.20% | |
| 12:30 | USD | CPI Core M/M Mar | 0.40% | 0.30% | 0.40% | |
| 12:30 | USD | CPI Core Y/Y Mar | 3.80% | 3.70% | 3.80% | |
| 13:45 | CAD | BoC Rate Decision | 5.00% | 5.00% | ||
| 14:00 | USD | Wholesale Inventories Feb F | 0.50% | 0.50% | ||
| 14:30 | USD | Crude Oil Inventories | 0.9M | 3.2M | ||
| 15:30 | CAD | BoC Press Conference | ||||
| 18:00 | USD | FOMC Minutes |
US CPI jumps to 3.5% yoy in Mar, CPI core unchanged at 3.8% yoy
US CPI rises 0.4% mom in March, above expectation of 0.3% mom. CPI core (all items less food and energy) rises 0.4% mom, also above expectation of 0.3% mom. Energy index rose 1.1% mom. Food index rose 0.1% mom.
For the 12 months period, CPI accelerated from 3.2% yoy to 3.5% yoy, above expectation of 3.4% yoy. CPI core was unchanged at 3.8% yoy, above expectation of 3.7% yoy. Energy index was up 2.1% yoy while food index was up 2.2% yoy.
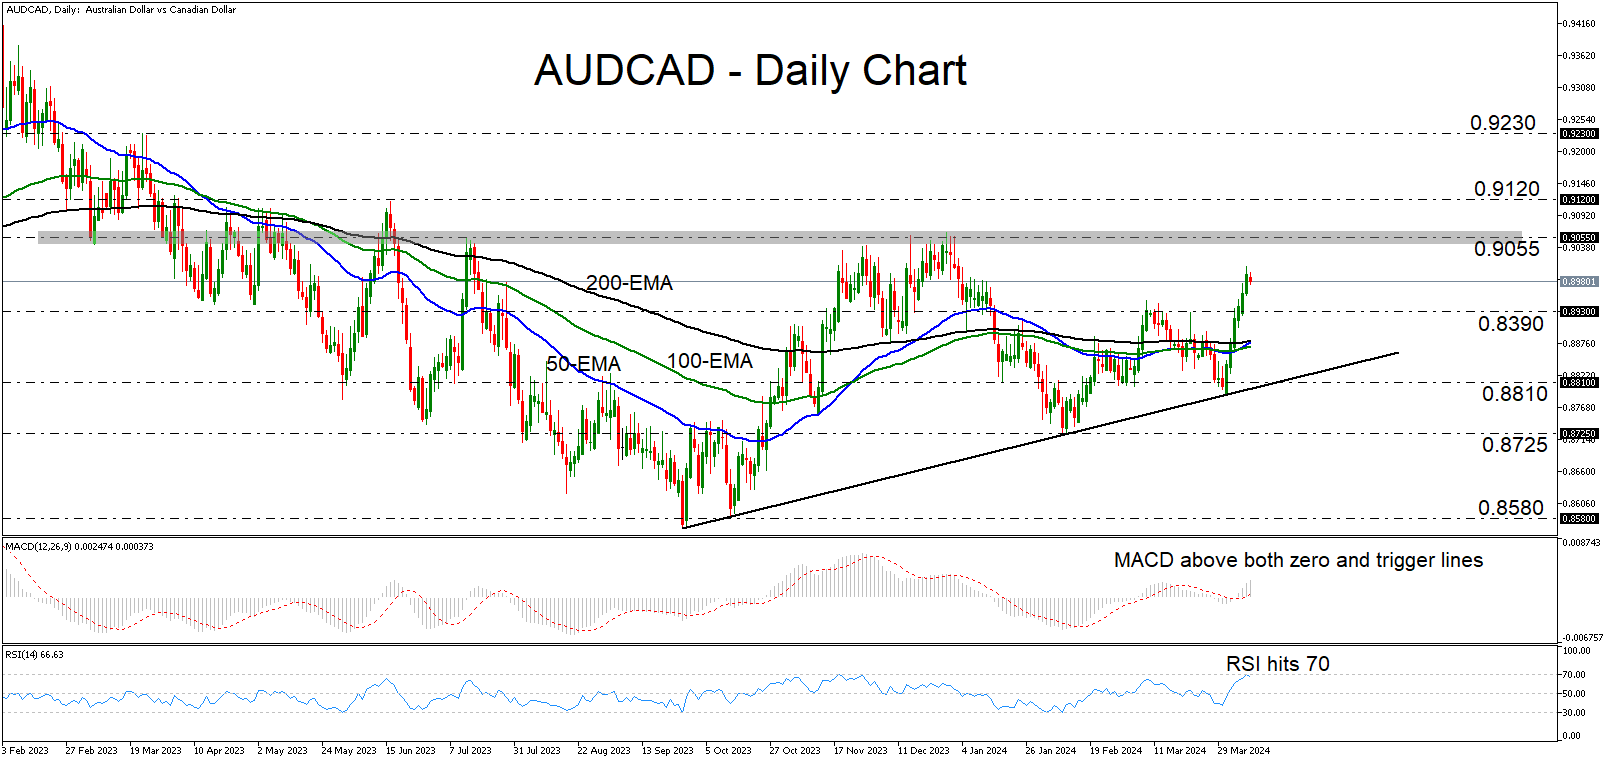
AUDCAD Rebounds Strongly from Uptrend Line
- AUDCAD rallies after hitting uptrend line
- RSI and MACD detect positive momentum
- A break above 0.9055 could shift the outlook to clearly bullish
- But a dip below 0.8810 could invite more bears
AUDCAD has been trading in a rally mode since April 2, when it hit support at the near-term uptrend line drawn from the low of September 27. On April 5, the pair emerged above the 0.8930 resistance (now turned into support) zone and looks to be headed towards the key obstacle of 0.9055.
Both the MACD and the RSI are detecting upside speed, corroborating the notion for some further advances, perhaps until the 0.9055 zone. The former is lying above both its zero and trigger lines pointing up, while the latter is near its 70 line. That said, the RSI ticked down after hitting 70, which implies that a minor pullback may be looming before the next leg north, perhaps to challenge the 0.8390 zone as support this time.
Should the bulls remain in the driver’s seat, a test of the 0.9055 barrier might not take long to happen. Nonetheless, for the outlook to be considered clearly bullish, a decisive move above that area may be needed. Such a move may initially target the high of June 16, 2023, at around 0.9120, the break of which could extend the rally towards the high of March 22, 2023, near 0.9230.
On the downside, a dip below 0.8810 could also signal the break below the aforementioned uptrend line. The sellers could then get encouraged to aim for the 0.8725 region, the break of which could carry larger bearish implications and perhaps pave the way towards the low of October 13 at 0.8580.
Summarizing, AUDCAD rebounded strongly after testing the uptrend line drawn from the low of September 27. However, the move that could shift the outlook to clearly bullish may be a decisive break above 0.9055.
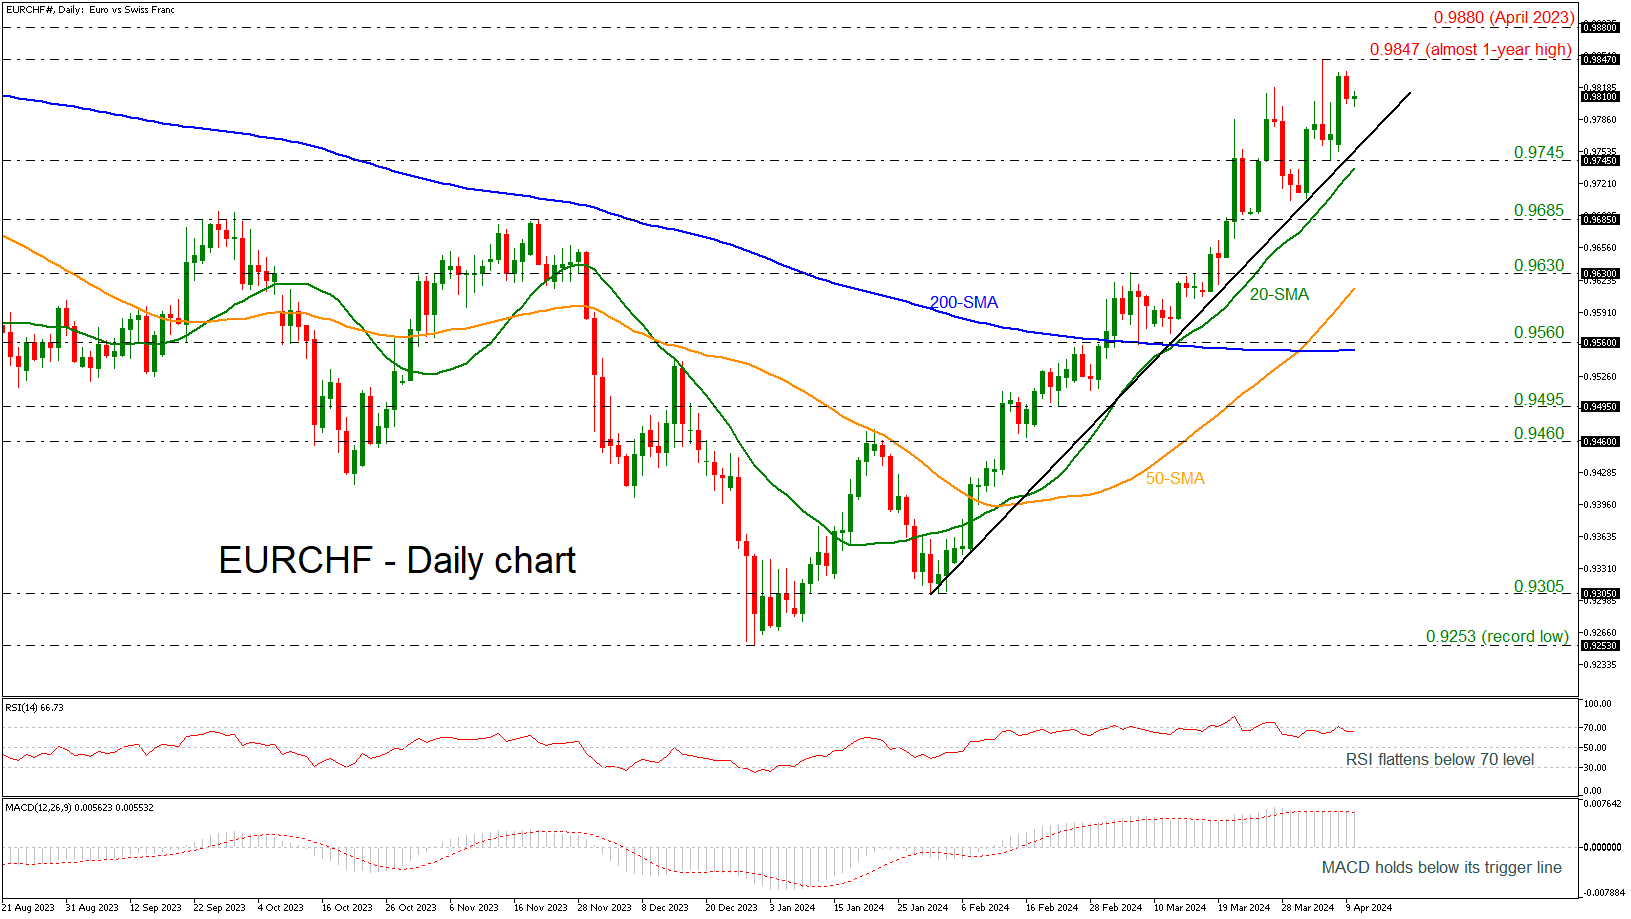
EURCHF Eases Slightly after 1-Year Peak
- EURCHF still stands above rising trend line
- Technical oscillators indicate negative correction
EURCHF has been in an ascending tendency since the end of January, and it posted a fresh almost one-year high of 0.9847 in the preceding week. Currently, the market is on the backfoot with the technical oscillators indicating a bearish retracement. The RSI is moving horizontally beneath the 70 threshold, while the MACD is losing some momentum beneath its trigger line in the positive region.
If buying interest persists, immediate resistance could be faced near the previous multi-month high of 0.9847 ahead of April’s 2023 peak of 0.9880. Steeper increases may see the parity level (1.000) come into play, registered back in March 2023.
In the negative scenario, a downside move may find initial support at the 0.9745 barricade, which stands near the 20-day simple moving average (SMA) at 0.9735. Even lower, the 0.9685 hurdle may halt bearish actions.
All in all, EURCHF is strongly positive in the medium-term view; however, a dive beneath the flat 200-day SMA at 0.9550 may switch the outlook to bearish.
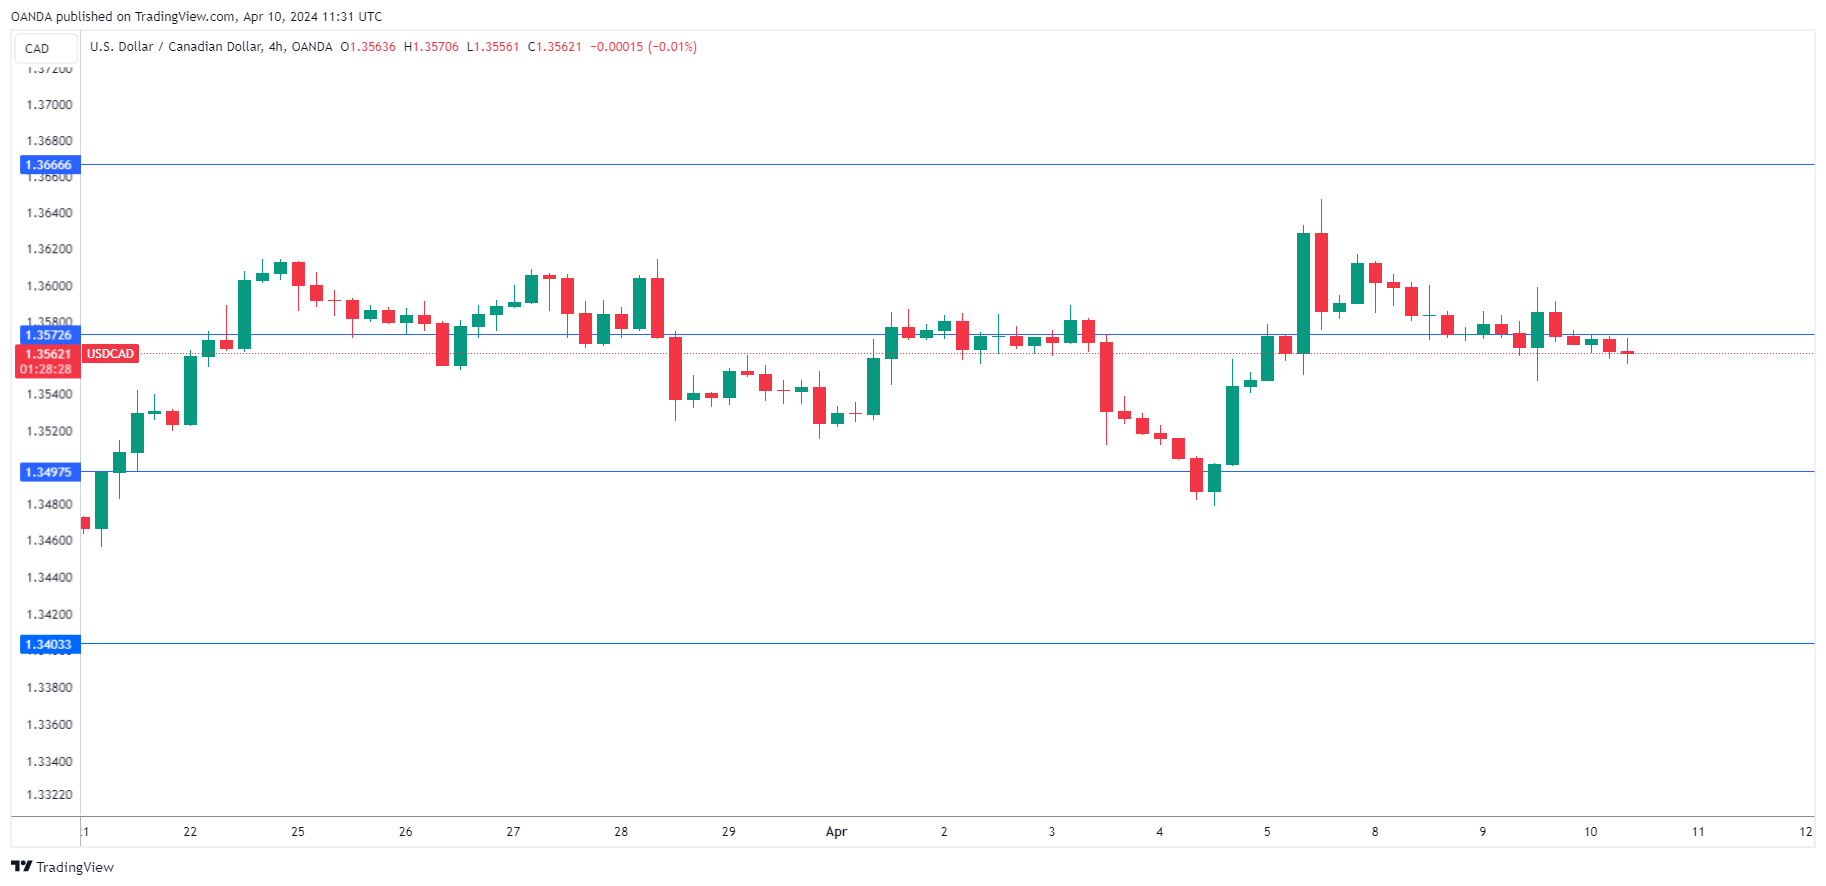
Canadian Dollar Calm Ahead of BoC Decision
The Canadian dollar is slightly lower on Wednesday. In the European session, USD/CAD is trading at 1.3559, down 0.09%.
Bank of Canada expected to stay pat
The Bank of Canada is widely expected to hold the cash rate at 5.0% at today’s meeting. The BoC’s rate policy has been “higher for longer”, with policy makers reluctant to lower rates until there is evidence that inflation is beaten. The BoC’s steep tightening cycle has pushed inflation all the way down to 2.8%, but that is still considerably higher than the inflation target of 2%.
The BoC has been cautious about lowering rates, with Governor Macklem saying last month that it was too early to lower rates as core inflation remained too high. The markets, however have been more hawkish and are eyeing a rate cut in the next few months. Although the BoC is likely to maintain rates at today’s meeting, the odds of a quarter-point cut in June stand at 78%, up from 70% at the end of March, with a July cut fully priced.
In an ideal world, the Bank of Canada would wait for the Federal Reserve to raise rates first so that the BoC move would have greater impact. A Fed cut would likely give a boost to the Canadian dollar which would help dampen inflation.
The US economy, however, continues to surprise with its resilience, with last week’s blowout nonfarm payrolls the latest example. The strong economy and persistent inflation could result in the Fed delaying an initial rate cut. The markets have priced in a June cut at 53% and a July cut at 73%, according to the CME’s FedWatch tool.
USD/CAD Technical
- USD/CAD tested resistance at 1.3572 earlier. Then next resistance line is 1.3666
- 1.3497 and 1.3403 are providing support
EUR/USD Holds Steady Ahead of Key Economic Updates
The EUR/USD pair is maintaining a neutral stance, trading around 1.0851 on Wednesday, as the market anticipates crucial updates, including the US inflation data for March and the outcome of the European Central Bank (ECB) meeting on Thursday. Given the significant events on the horizon, investors are exhibiting caution.
The US inflation rate for March is anticipated to show a 0.3% month-on-month increase, slightly below February's 0.4% rise. The core Consumer Price Index (CPI) is also expected to grow by 0.3% month-on-month. The market consensus leans towards the US Federal Reserve reducing its interest rate by 75 basis points throughout 2024, indicating three separate 25-point cuts.
Despite the increase in yields on US government bonds since the start of the year, the US dollar's reaction has been relatively subdued, with only a 2.5% appreciation against a 47-basis point widening in benchmark bond yields. This disparity suggests that the US dollar may play catch-up with Treasury yields, or bond yields might decrease to close the gap. This raises questions about the timing of this adjustment.
The ECB's interest rate is expected to remain at 4.5% per annum, with the European regulator likely to wait for the Fed's move towards easing monetary policy before making its adjustments. This approach is taken even though the eurozone has effectively managed high inflation ahead of other developed economies, theoretically positioning it to adapt its monetary policy sooner.
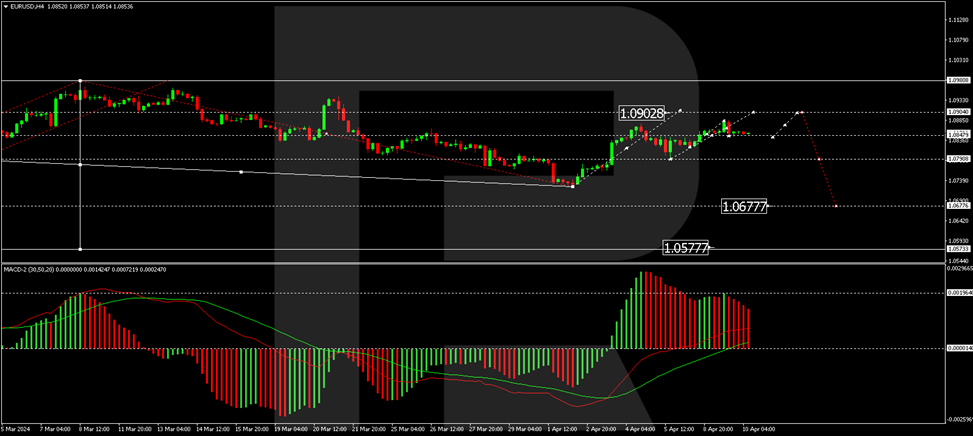
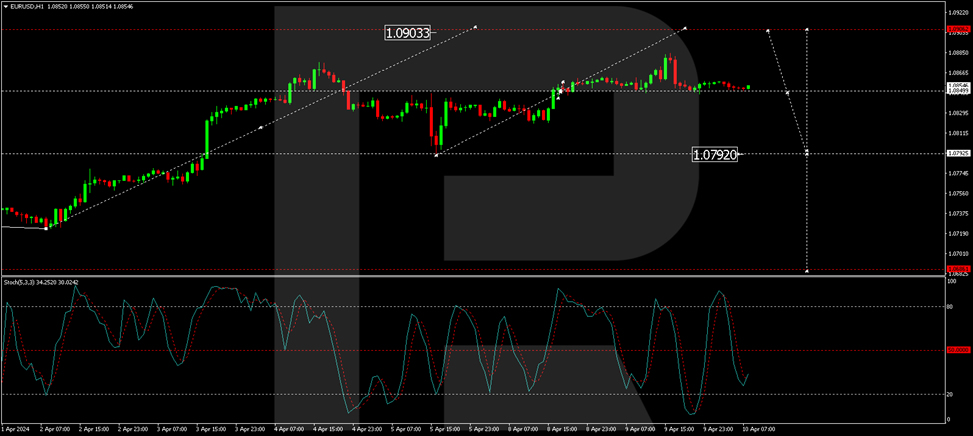
Technical analysis of EUR/USD
The H4 chart analysis of EUR/USD indicates a correction wave to 1.0883 followed by a decrease to 1.0844. A narrow consolidation range has formed above this level, potentially leading to a correction towards 1.0904 before a new decline towards 1.0790, with a continuation to 1.0700 as a possible target. The MACD indicator, with its signal line above zero and the histogram declining, suggests a potential sharp decrease.
The H1 chart shows a consolidation range of around 1.0850, extending to 1.0884. The market has returned to 1.0843, with the possibility of another correction wave to 1.0904 before a downward movement to 1.0790. The Stochastic oscillator, currently below 50, indicates a continuation of the decline towards 20, supporting the bearish scenario.
Dollar Index in Quiet Mode Ahead of Release of Key Economic Data from US
The dollar index is trading within a narrow range for the second consecutive day, as traders await release of the US inflation report for March, which is expected to provide more hints on the Fed’s policy outlook.
Widely expected start of cutting rates in June, as well as the pace and size of rate cuts, was questioned after a strong labor report last Friday.
Markets raised bets about keeping rates further on hold, with today’s CPI data to make the picture more clear.
Majority of markets observers believe that US inflation will rise again in March, which will cool expectations for June cut and provide fresh boost to the US dollar.
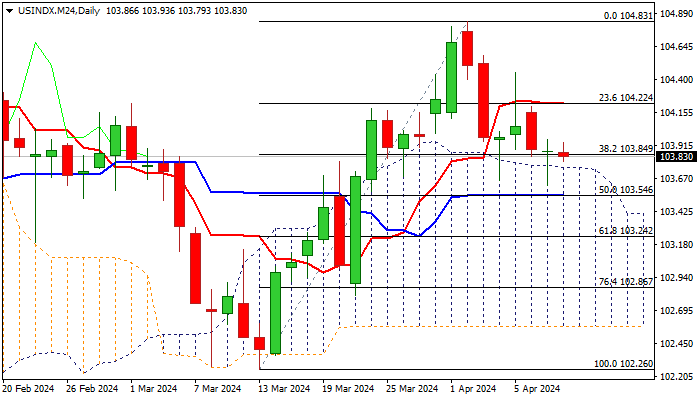
In such scenario, the dollar would jump and generate initial signal of an end of correction from 104.83 (Apr 2 high), with formation of a higher base at 103.65 zone.
Conversely, March data in line or below consensus would add to June rate cut bets and increase pressure on the US dollar.
Top of thick daily cloud offers immediate support at 103.74, guarding lower pivot at 103.55 (daily Kijun-sen / 50% retracement of 102.26/104.83), while daily Tenkan-sen (104.22) marks an upper trigger.
Res: 104.10; 104.22; 104.45; 104.83.
Sup: 103.74; 103.55; 103.24; 103.00.