Sample Category Title
Crypto Market Looking for Triggers
Market picture
The cryptocurrency market did not find the strength to accelerate and rolled back almost 2.3% on the day to $2.6 trillion, but that is still a gain of 3.5% in seven days. In other words, the market is holding on to its uptrend but needs drivers for further movement.
The US CPI report, which in recent years has caused a spike in volatility comparable to NFP, has an impressive potential to influence the market on Wednesday.
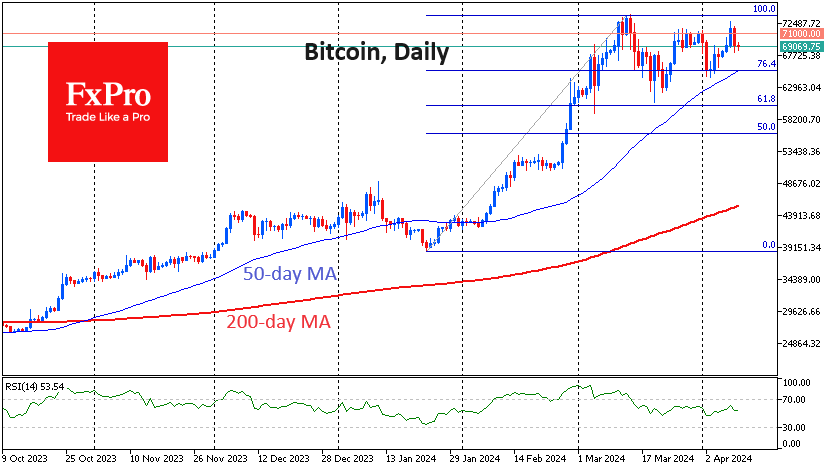
Renewed buying in Bitcoin and other leading altcoins since the start of the day on Wednesday indicates trader optimism. Still, this sentiment could change dramatically or intensify as early as this afternoon. On the Bitcoin chart, a support line can be drawn through the lows from early March, the testing of which became more frequent in April.
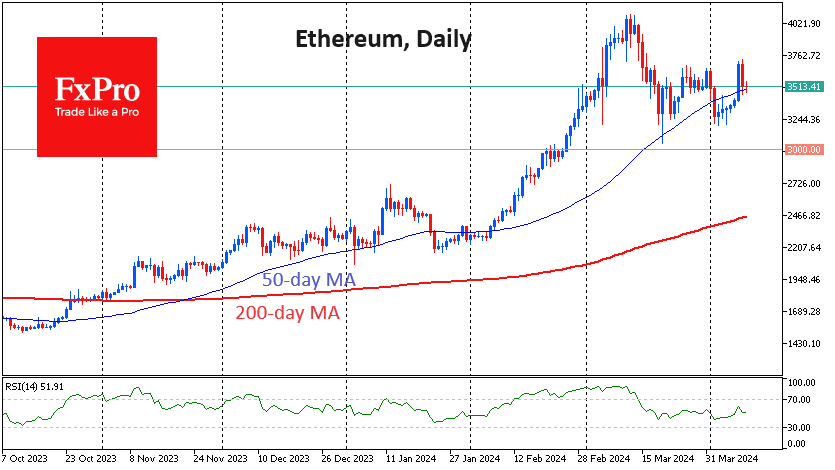
Ethereum is slightly above its 50-day moving average. Staying below this line in early April should not be dramatised, as a similar thing happened in late January and early February, only whetting buyers’ appetite.
News background
Chinese financial giants Harvest Fund and Southern Fund intend to offer units of their future bitcoin-based spot exchange-traded funds to clients through their Hong Kong branches. Applications for BTC-ETF registration have been filed with Hong Kong’s Securities and Futures Commission (SFC).
Deutsche Bank surveyed more than 3,600 of the bank’s US, UK and EU customers. According to the survey, only 10 per cent of respondents believe Bitcoin will exceed $75K by the end of 2024.
The US Treasury Department intends to strengthen control over crypto exchanges, including foreign ones. The department lacks “legislative tools” to combat the illegal use of cryptocurrencies by terrorist groups and countries under US sanctions, said US Treasury Undersecretary Wally Adeyemo.
The cost of mining bitcoin with an Antminer S19 XP as a result of halving will rise from $40K to $80K, CryptoQuant has calculated. US miners widely use this model, and it is the top in terms of energy efficiency in the S19 lineup, representatives of which still generate most of the hashrate.
The Solana blockchain team said that the launch of new projects will be suspended until 15 April while technical issues related to network congestion and transaction errors are resolved.
According to Cointelegraph Magazine, meme coins account for the majority of activity on Base’s L2 network, with one coin in six being a scam and 91% having vulnerabilities.
NZ Dollar Rises as RBNZ Pauses
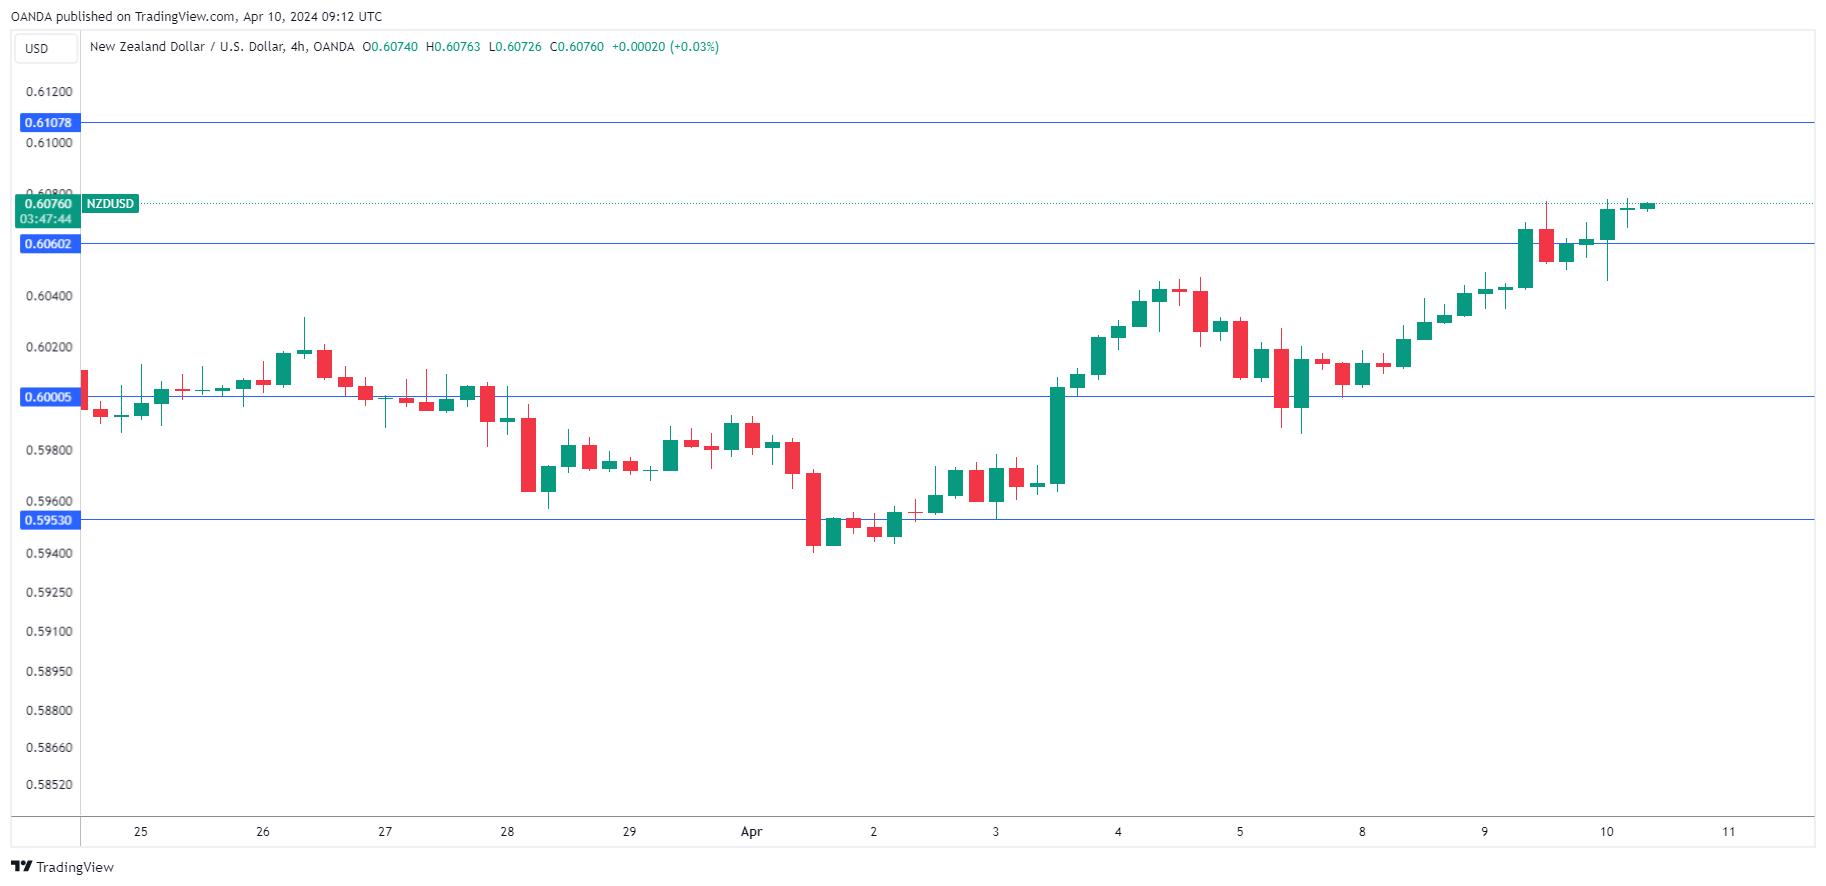
The New Zealand dollar has extended its gains on Wednesday and is higher for a third straight day. In the North American session, NZD/USD is trading at 0.6074, up 0.24%.
RBNZ holds rates, says economy weak
There was little drama from the Reserve Bank of New Zealand’s meeting on Wednesday, as the decision to pause was widely expected. The RBNZ has now kept the cash rate unchanged at 5.5% for six straight times.
There really wasn’t much for investors to digest from today’s meeting. The rate statement was only 140 words and there was no follow up press conference from Governor Orr. The takeaway message from the statement was that the RBNZ was confident that keeping the cash rate in restrictive territory would bring inflation within the 1-3% target band by the end of the year. This clearly was not market-moving news and the New Zealand dollar is showing little movement today.
The RBNZ statement made sure to mention that “economic growth in New Zealand remains weak”, but that was the only hint at a possible cut in rates. It’s a guessing game as to when the central bank will start lowering rates but a move before October appears unlikely.
What is certain is that the RBNZ will want to see more data before making a shift in policy, and next week’s fourth-quarter inflation release will be a key factor in rate policy. Inflation in Q4 was 4.7%, more than double the midpoint of the target band. If inflation remains persistently high, the RBNZ might delay rate cuts until 2025.
NZD/USD Technical
- NZD/USD is testing resistance at 0.6060. Above, there is resistance at 0.6107
- 0.6000 and 0.5953 are providing support
Is CADJPY Setting the Ground for Next Bull Run?
- CADJPY remains within a range despite hitting new high
- Upside risks exist above 111.50; bears could take the lead below 110.40
- BoC rate decision at 13:45 GMT is the highlight of the Canadian calendar
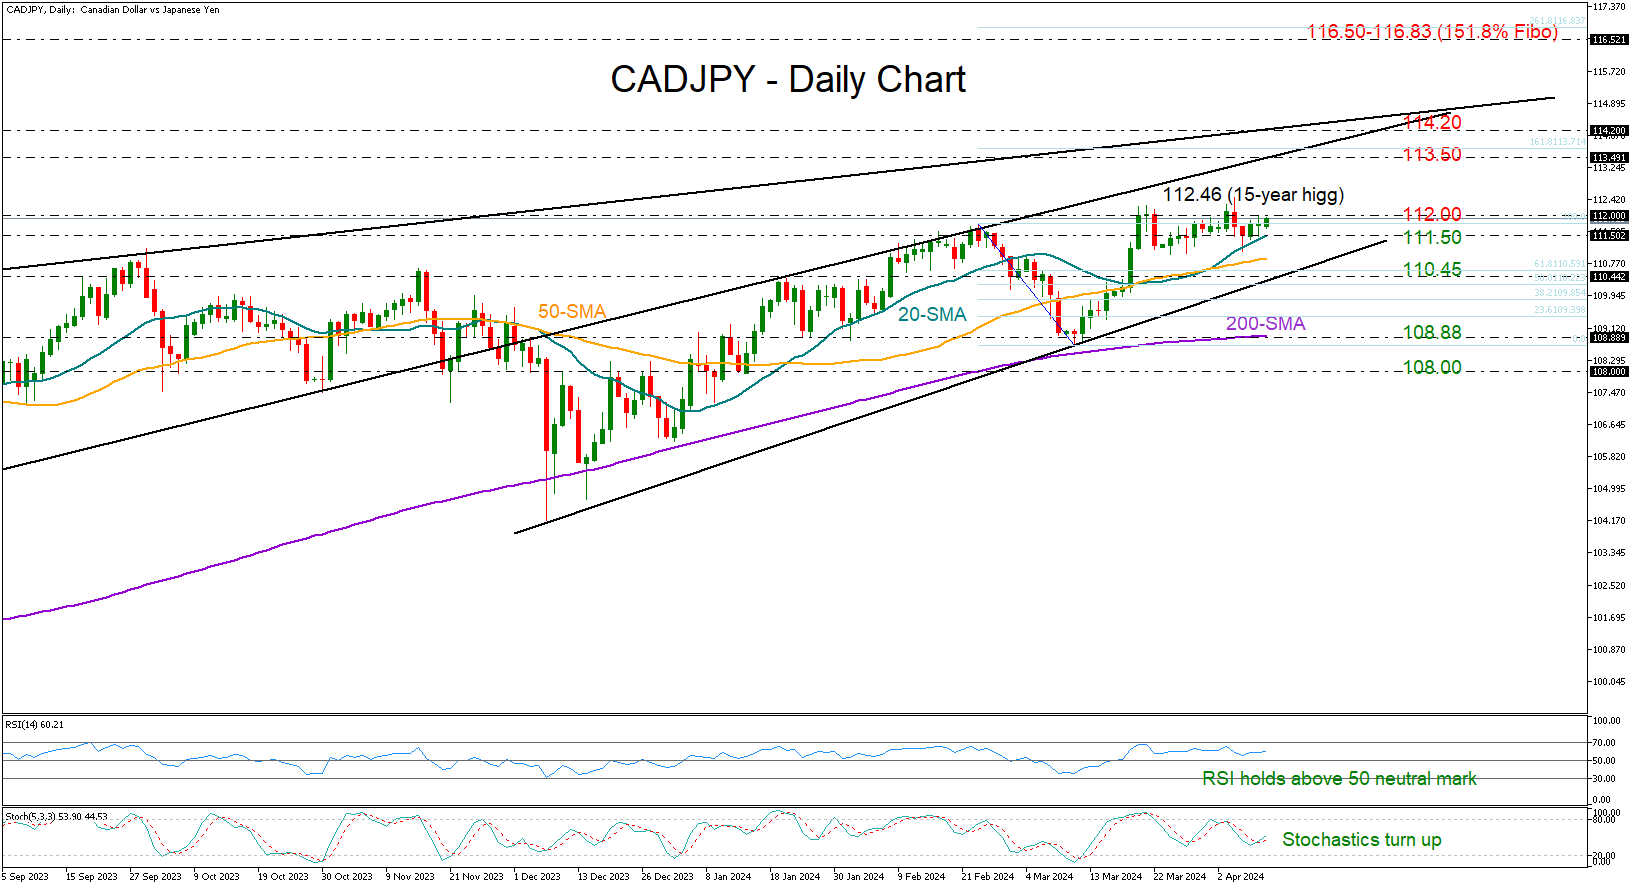
CADJPY remained stagnant after entering the 112.00 area, keeping its weak momentum despite reaching a new high of 112.46 last week - the highest level since the beggining of 2008.
The market's ability to stay resilient above the 20-day simple moving average (SMA) has been a positive development this week, feeding optimism for a bullish breakout above the 112.00 mark. The RSI and the stochastic oscillator are also providing a ray of hope for a positive session ahead as the former continues to hover above its 50 neutral mark and the latter is set for an upside reversal.
If the bulls manage to break through the 112.00 border, the long-term uptrend could continue towards the resistance area of 113.50-114.20, which includes two ascending lines drawn from the 2023 summer highs. Even higher, the 2007 barrier of 116.50 and the 161.8% Fibonacci extension of the September-December 2023 downleg at 116.83 could keep traders busy, delaying any extensions towards the 118.20 constraining zone taken from July 2007.
Selling pressure may remain under control if the price continues to trade above the shorter-term SMAs and the support trendline at 110.45. Otherwise, the bears might target the 200-day SMA at 108.88, a break of which could would worsen the short-term outlook below November’s low. In this case, the way would clear towards the 108.00 restrictive territory.
Overall, CADJPY is in a wait and see mode, with a potential for a bullish continuation into the 113.50-114.20 are following the latest rebound on the 20-day SMA. Alternatively, the consolidation phase could continue unless the bears crack the 110.45 floor.
USDJPY Flirts With Intervention Zone
- USDJPY trades sideways a tad below 152.00
- This level was protected by Japanese authorities in 2022
- Momentum indicators approach overbought conditions
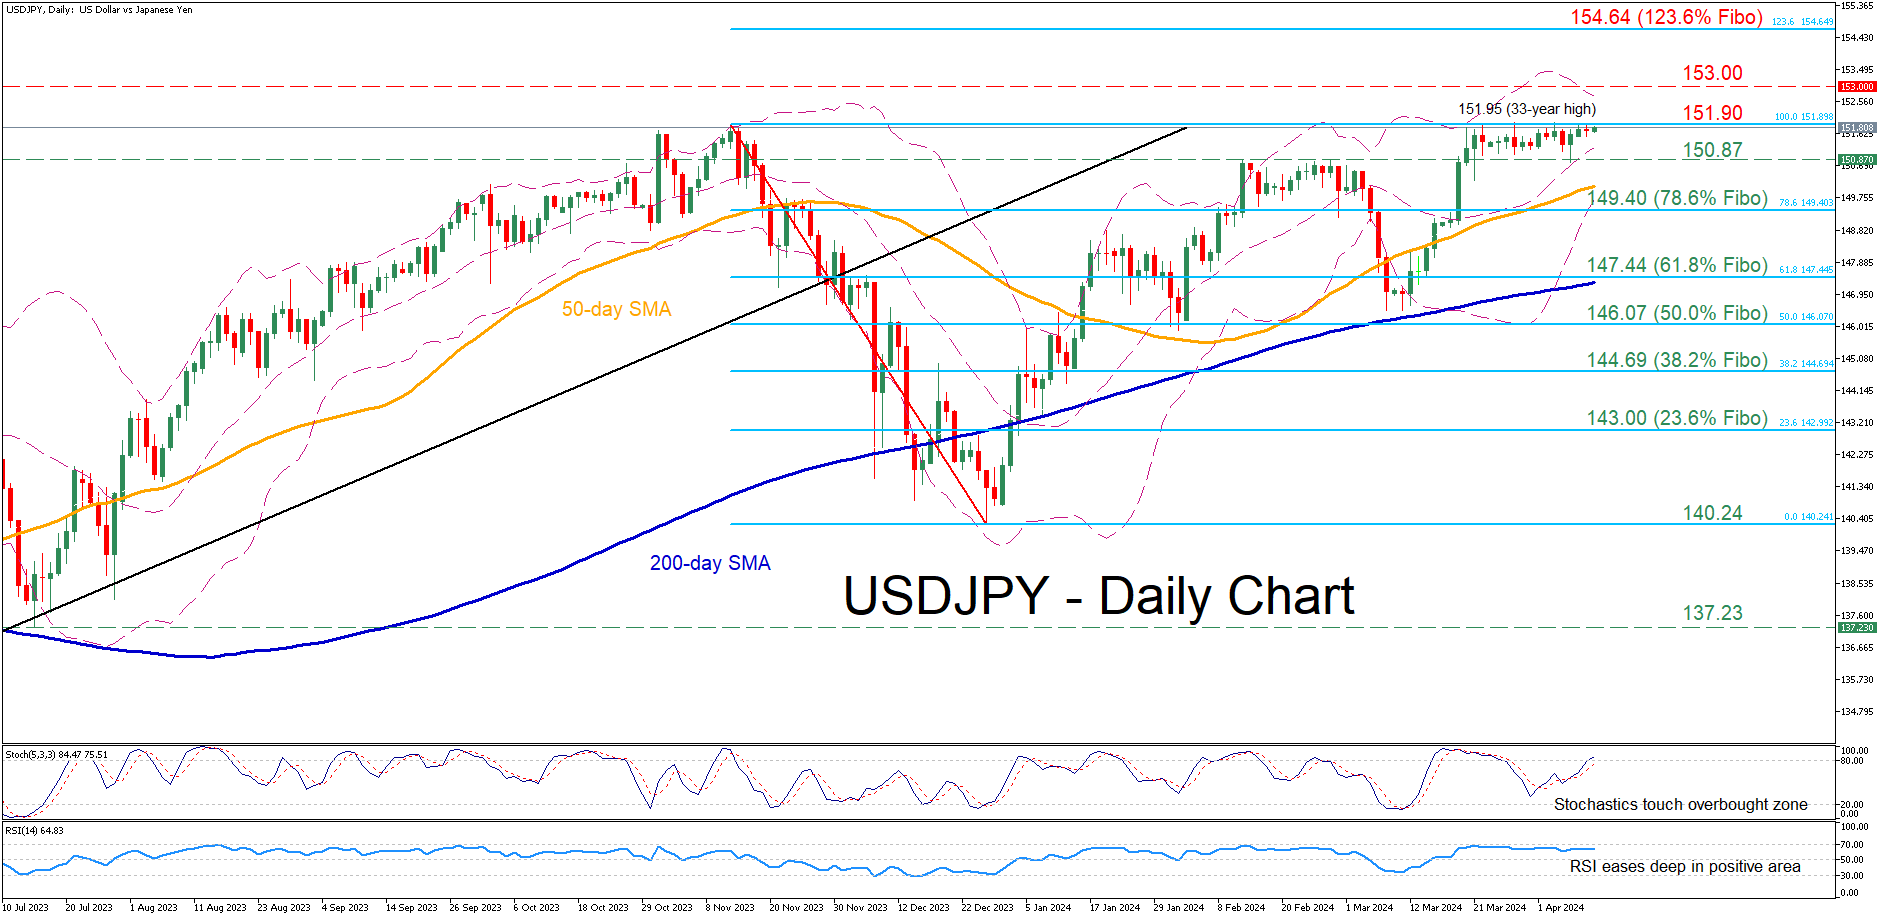
USDJPY has been in a steady uptrend after finding its feet at the 200-day simple moving average (SMA) in early March. In the near-term, the pair has been trading flat after posting a fresh 34-year high of 151.95, approaching levels that Japanese authorities were willing to protect in the past.
Should bullish pressures persist, the price might retest the 34-year peak of 151.95. Surpassing that zone, the pair could storm to fresh highs before it meets resistance at the 153.00 round number. Further upside attempts could then come to a halt at 154.64, which is the 123.6% Fibonacci extension of the 151.90-140.24 downleg.
On the flipside, if the pair experiences a pullback, the recent support of 150.87 that also acted as resistance in February could prove to be the first barricade for the bears to overcome. Even lower, the price could encounter strong support at the 78.6% Fibo of 149.40. A violation of that hurdle may set the stage for the 61.8% Fibo of 147.44.
Overall, USDJPY remains stuck within the 151.00-152.00 range as the bulls appear hesitant to propel the price above the 2022 intervention zone. Could this repeated inability spark a downside correction?
EURUSD Oscillates Within a Sideways Range
- EURUSD trades sideways between 1.0725 and 1.0930
- Oscillators confirm the lack of directional momentum
- A move above 1.0930 may be needed to brighten the outlook
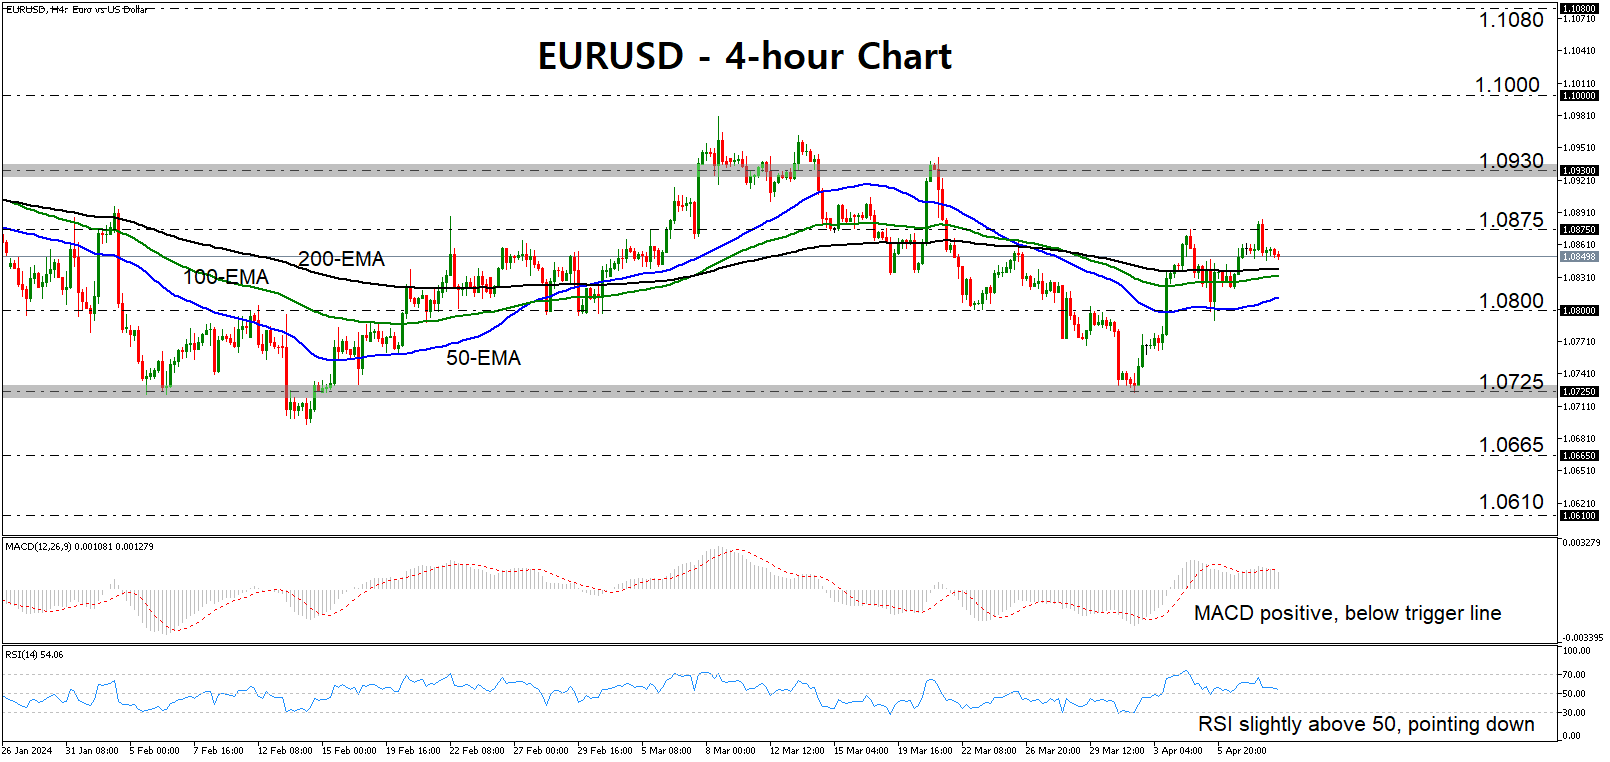
EURUSD pulled back on Tuesday, after hitting resistance slightly above the 1.0875 barrier, marked by the high of April 4. In the bigger picture, most of the price action has been contained between 1.0725 and 1.0930 since January 16, suggesting a neutral near-term outlook.
The lack of directional momentum is also confirmed by our short-term oscillators. The MACD, although positive, is lying below its trigger line and is pointing south. The RSI is running above 50, but it is slowly getting closer to that equilibrium barrier.
Another attempt and a successful break above 1.0875 could pave the way towards the upper end of the sideways range at around 1.0930, but a break above that hurdle is needed for the picture to brighten. Such a move may initially pave the way towards the psychological round number of 1.1000.
On the downside, a dip below 1.0800 could see scope for declines towards the lower bound of the range, at around 1.0725, the break of which could invite more bears and take the action down to the 1.0665 area, which offered support during the first half of November.
To recap, EURUSD has been trading in a sideways manner lately, staying largely contained between 1.0725 and 1.0930. For a new trend to begin, a decisive exit out of that sideways range may be needed.
GBP/USD Recovers While EUR/GBP Dips to Support
GBP/USD is gaining pace above the 1.2660 resistance. EUR/GBP declined steadily below the 0.8572 and 0.8566 support levels.
Important Takeaways for GBP/USD and EUR/GBP Analysis Today
- The British Pound is attempting a fresh increase above 1.2660.
- There is a key bullish trend line forming with support near 1.2670 on the hourly chart of GBP/USD at FXOpen.
- EUR/GBP is trading in a bearish zone below the 0.8572 pivot level.
- There is a connecting bearish trend line forming with resistance near 0.8562 on the hourly chart at FXOpen.
GBP/USD Technical Analysis
On the hourly chart of GBP/USD at FXOpen, the pair remained well-bid above the 1.2575 level. The British Pound started a decent increase above the 1.2605 zone against the US Dollar.
The bulls were able to push the pair above the 50-hour simple moving average and 1.2660. The pair even climbed above 1.2700 and traded as high as 1.2709. It is now correcting gains below the 23.6% Fib retracement level of the upward move from the 1.2574 swing low to the 1.2709 high.
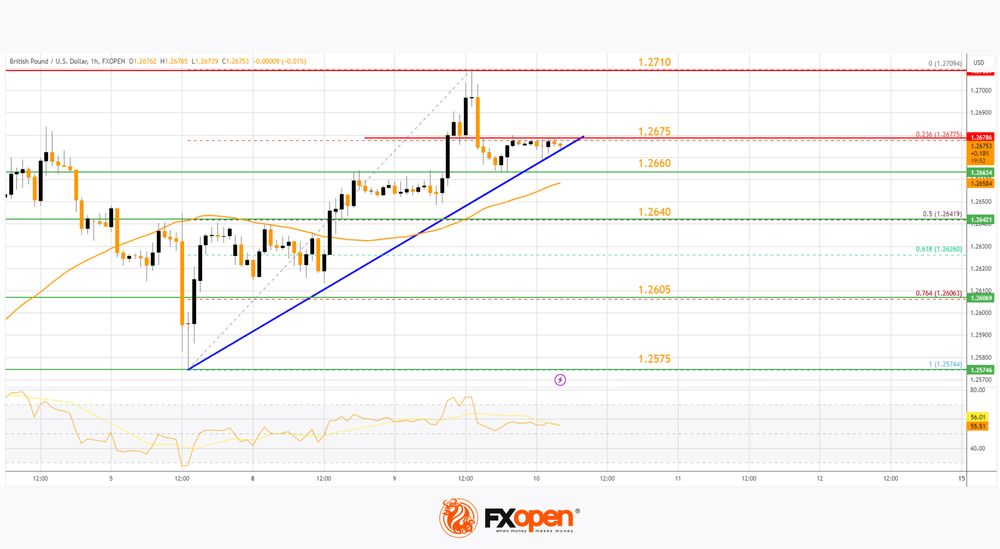
On the upside, the GBP/USD chart indicates that the pair is facing resistance near 1.2675. The next major resistance is near 1.2710.
A close above the 1.2710 resistance zone could open the doors for a move toward 1.2740. Any more gains might send GBP/USD toward 1.2800. On the downside, there is a key support forming near a bullish trend line at 1.2670.
If there is a downside break below 1.2670 and 1.2660, the pair could accelerate lower. The next major support is near the 50% Fib retracement level of the upward move from the 1.2574 swing low to the 1.2709 high at 1.2640.
The next key support is seen near 1.2605, below which the pair could test 1.2575. Any more losses could lead the pair toward the 1.2500 support.
EUR/GBP Technical Analysis
On the hourly chart of EUR/GBP at FXOpen, the pair started a steady decline from well above 0.8580. The Euro traded below the 0.8572 and 0.8566 support levels against the British Pound.
The EUR/GBP chart suggests that the pair even declined below the 0.8562 level and tested 0.8560. It is now consolidating losses and trading below the 50-hour simple moving average. The pair is now facing resistance near a connecting bearish trend line at 0.8562.
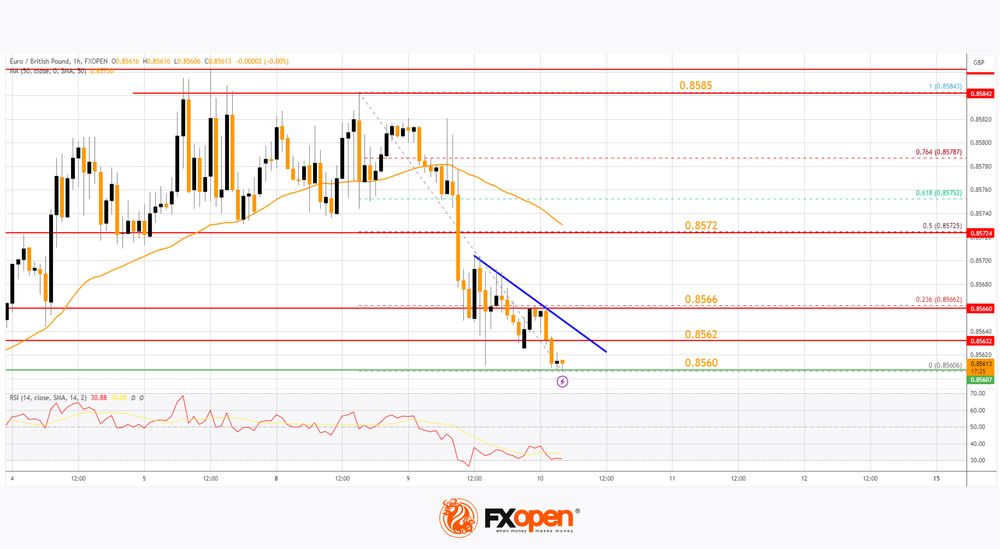
It is close to the 23.6% Fib retracement level of the downward move from the 0.8584 swing high to the 0.8560 low. The next major resistance could be 0.8572.
The 50% Fib retracement level of the downward move from the 0.8584 swing high to the 0.8560 low is also at 0.8572. A close above the 0.8572 level might accelerate gains. In the stated case, the bulls may perhaps aim for a test of 0.8585. Any more gains might send the pair toward the 0.8620 level.
Immediate support sits near 0.8560. The next major support is near 0.8525. A downside break below the 0.8525 support might call for more downsides. In the stated case, the pair could drop toward the 0.8500 support level.
Trade over 50 forex markets 24 hours a day with FXOpen. Take advantage of low commissions, deep liquidity, and spreads from 0.0 pips. Open your FXOpen account now or learn more about trading forex with FXOpen.
This article represents the opinion of the Companies operating under the FXOpen brand only. It is not to be construed as an offer, solicitation, or recommendation with respect to products and services provided by the Companies operating under the FXOpen brand, nor is it to be considered financial advice.
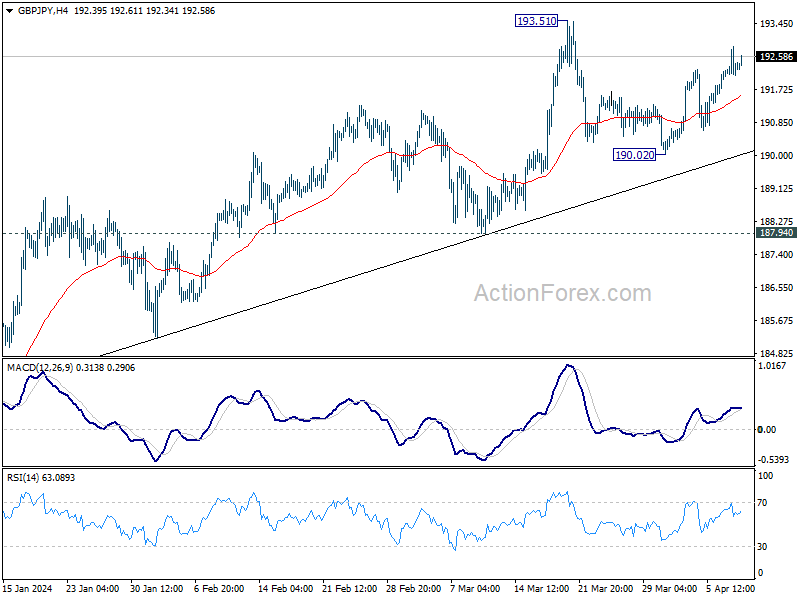
GBP/JPY Daily Outlook
Daily Pivots: (S1) 191.81; (P) 192.33; (R1) 192.93; More.....
Intraday bias in GBP/JPY remains neutral at this point as consolidation from 193.51 could extend. But further rally is expected as long as 190.02 support holds. On the upside, break of 193.51 will resume larger up trend to 195.86 long term resistance. On the downside, though, break of 190.02 will turn bias to the downside for 187.94 support instead.
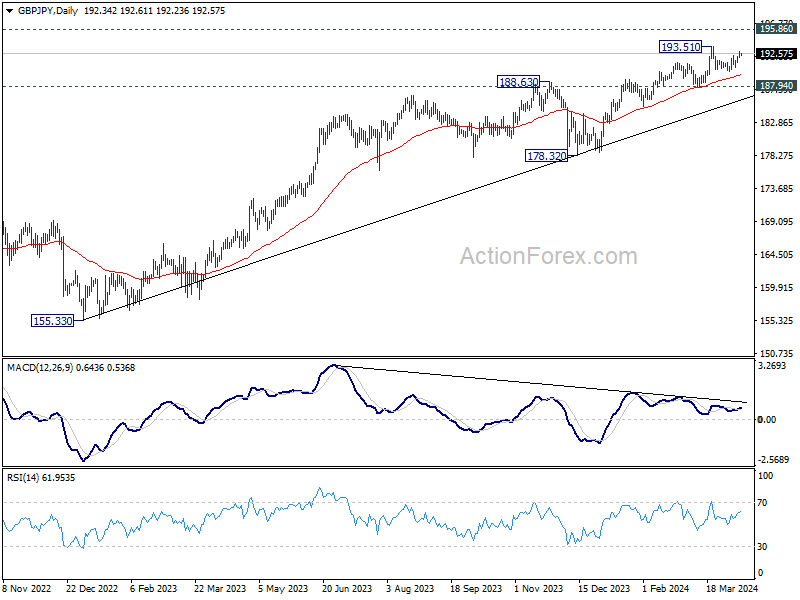
In the bigger picture, current rally is part of the up trend from 123.94 (2020 low), and is in progress for 195.86 long term resistance (2015 high). Break of 187.94 support is needed to be the first sign of medium term topping. Otherwise, outlook will remain bullish in case of retreat.
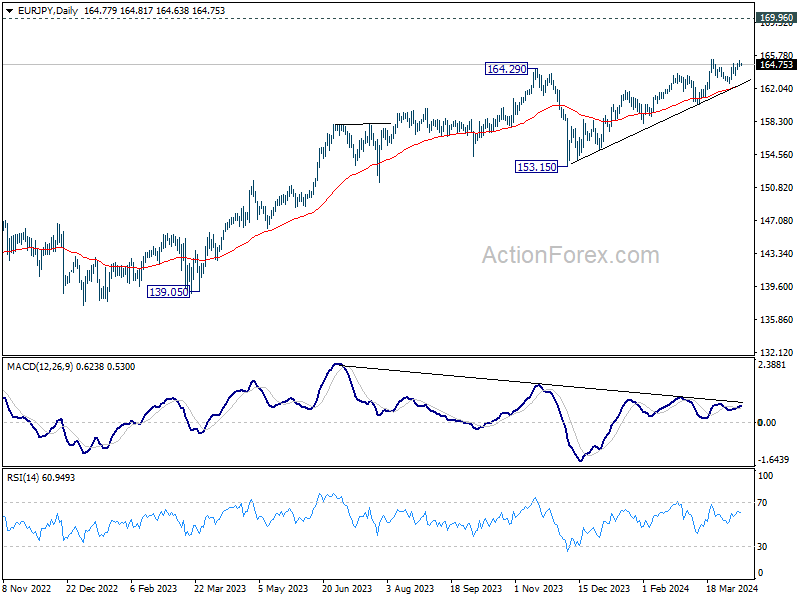
EUR/JPY Daily Outlook
Daily Pivots: (S1) 164.49; (P) 164.83; (R1) 165.13; More...
Intraday bias in EUR/JPY remains neutral for the moment and consolidation could continue below 165.33. But further rally remains in favor as long as 162.59 support holds. On the upside, firm break of 165.33 will resume larger up trend towards 169.96 key resistance next. On the downside, though, break of 162.59 will turn bias to the downside for 160.20 support next.
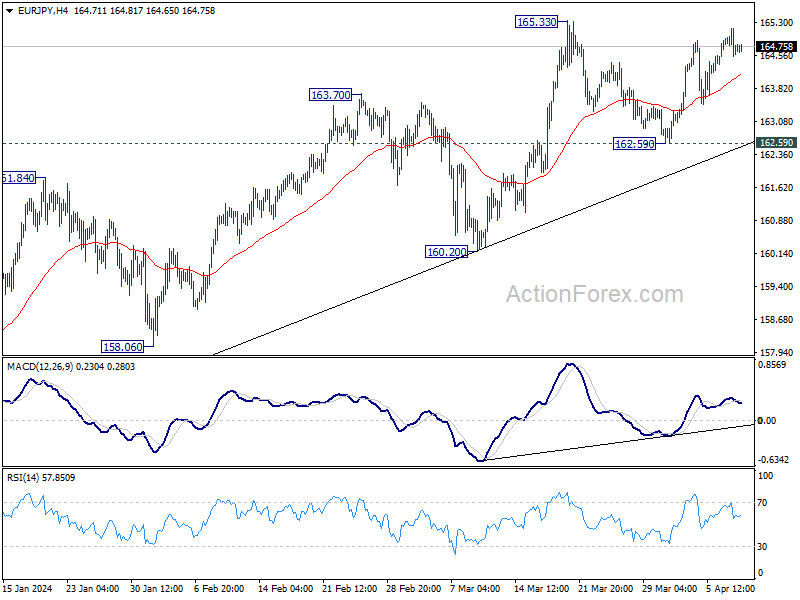
In the bigger picture, current rally is part of the up trend from 114.42 (2020 low), which is still in progress. Next target is 169.96 (2008 high). Break of 160.20 support is needed to be the first sign of medium term topping. Otherwise, outlook will stay bullish in case of retreat.
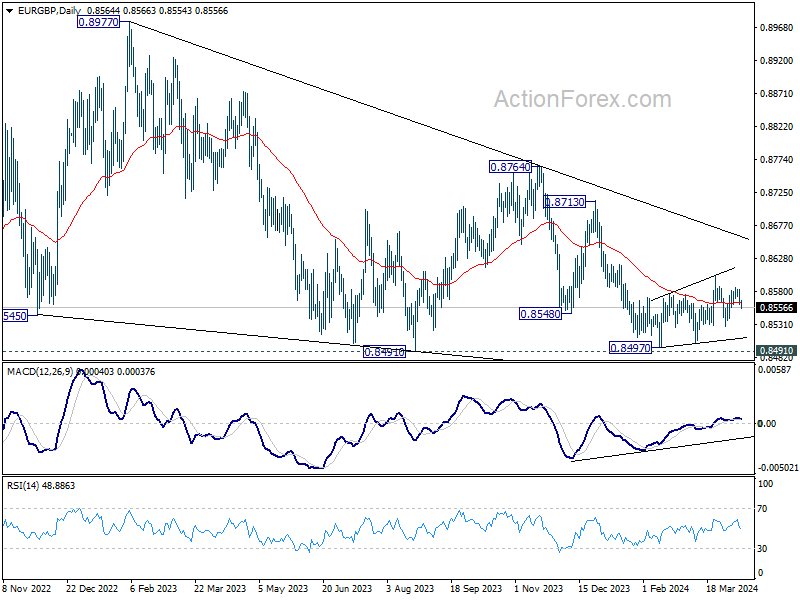
EUR/GBP Daily Outlook
Daily Pivots: (S1) 0.8555; (P) 0.8570; (R1) 0.8578; More...
Intraday bias in EUR/GBP stays neutral as range trading continues. On the downside, firm break of 0.8529 support will argue that the corrective recovery from 0.8497 has completed at 0.8601. Intraday bias will be back on the downside for retesting 0.8497 low next. On the upside, break of 0.8601 will resume the rebound instead.
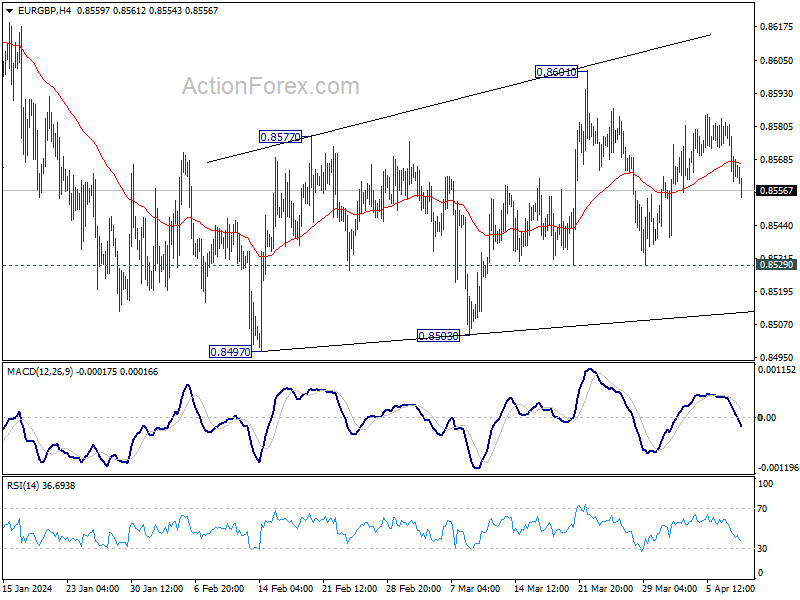
In the bigger picture, there is no clear sign that down trend from 0.9267 has completed, despite loss of downside momentum as seen in D MACD. As long as 0.8713 resistance holds, the down trend will remain in favor to resume through 0.8491 low at la later stage.
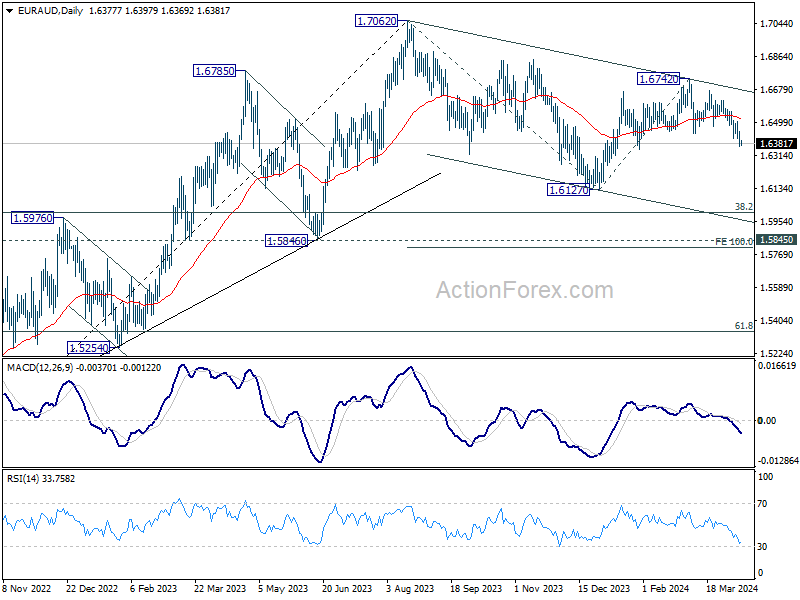
EUR/AUD Daily Outlook
Daily Pivots: (S1) 1.6348; (P) 1.6400; (R1) 1.6431; More..
Intraday bias in EUR/AUD stays on the downside at this point. Break of 100% projection of 1.6742 to 1.6439 from 1.6677 at 1.6374 will pave the way to 161.8% projection at 1.6187 next. For now, risk will stay on the downside as long as 1.6503 resistance holds, in case of recovery.
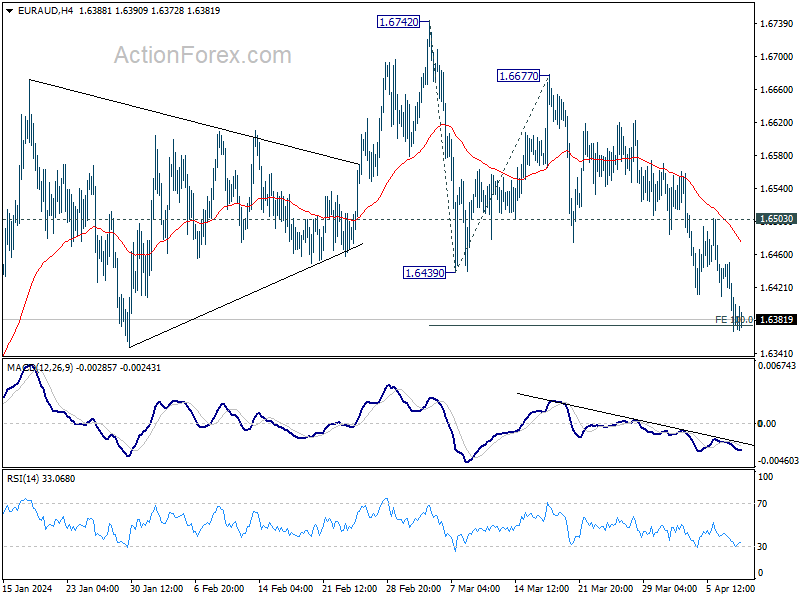
In the bigger picture, fall from 1.7062 medium term top is seen as a correction to the up trend from 1.4281 (2022 low). The correction is still in progress with fall from 1.6742 as the third leg. Strong support is expected around 1.5846 and 38.2% retracement of 1.4281 to 1.7062 at 1.6000 to bring rebound.