
Sample Category Title
EUR/CHF Daily Outlook
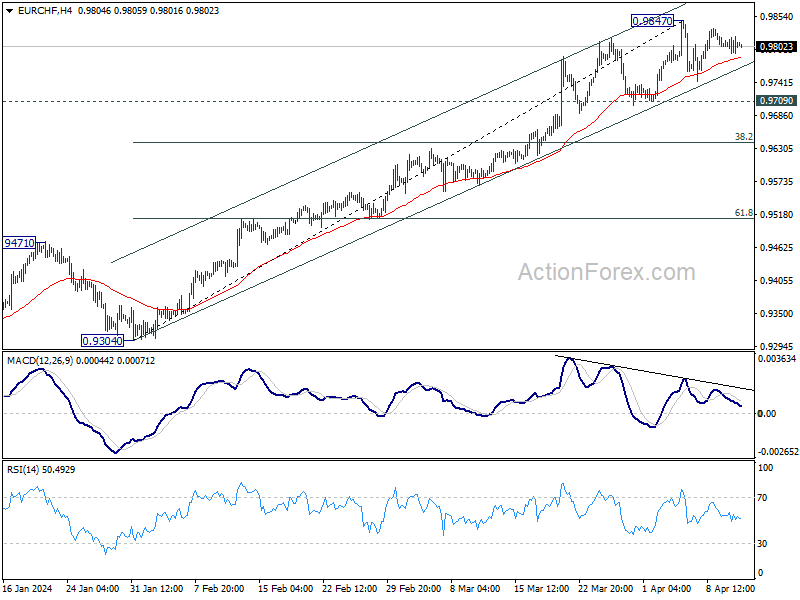
Daily Pivots: (S1) 0.9792; (P) 0.9807; (R1) 0.9821; More...
EUR/CHF is still extending the consolidation form 0.9847 and intraday bias stays neutral. Near term outlook will remain bullish as long as 0.9709 support holds. Break of 0.9847 will resume larger rise from 0.9252. However, considering bearish divergence condition in 4H MACD, break of 0.9709 will confirm short term topping, and turn bias back to the downside for deeper pullback.
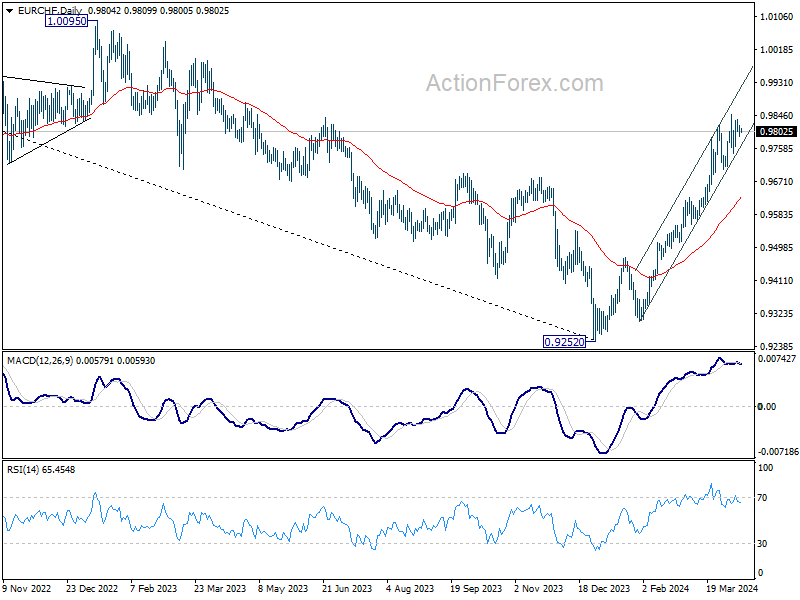
In the bigger picture, a medium term bottom should be in place at 0.9252 already, on bullish convergence condition in W MACD. Rise from there would now target 38.2% retracement of 1.2004 (2018 high) to 0.9252 (2023 low) at 1.0303, even as a correction to the down trend from 1.2004. This will remain the favored case as long as 55 D EMA (now at 0.9625) holds.
USD/CAD Daily Outlook
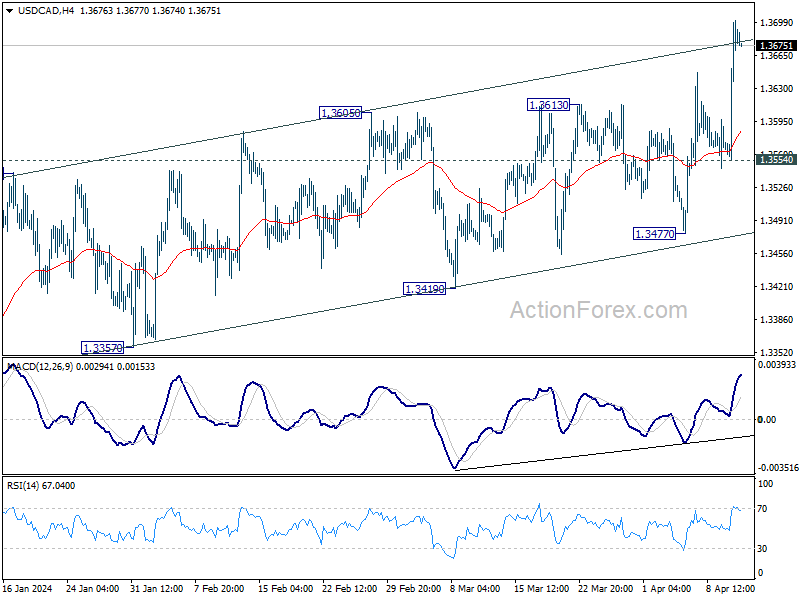
Daily Pivots: (S1) 1.3591; (P) 1.3647; (R1) 1.3738; More...
Intraday bias in USD/CAD remains on the upside for the moment. Firm break of channel resistance would prompt upside acceleration, and extend the rally from 1.3176 to 1.3897 resistance next. For now, further rally will remain in favor as long as 1.3554 support holds, in case of retreat.
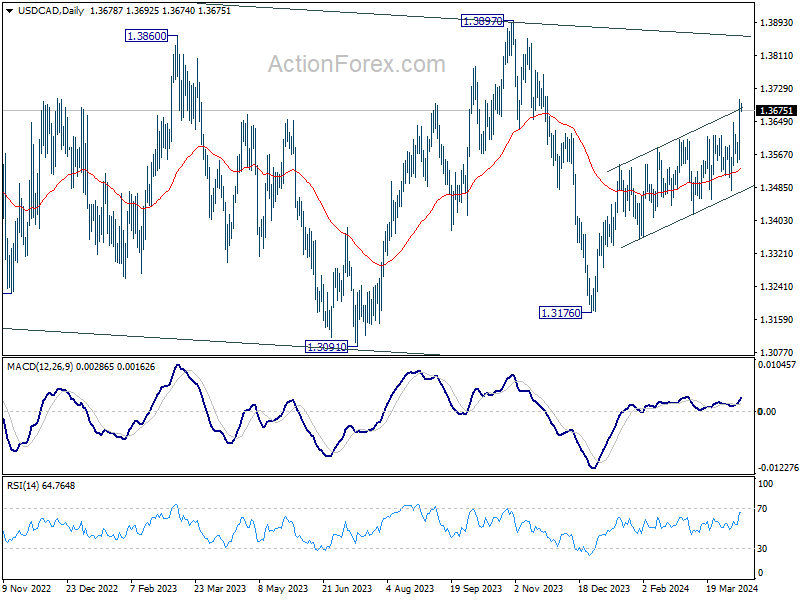
In the bigger picture, price actions from 1.3976 (2022 high) are viewed as a corrective pattern only. In case of another fall, strong support should emerge above 1.2947 resistance turned support to bring rebound. Overall, larger up trend from 1.2005 (2021 low) is still expected to resume through 1.3976 at a later stage.
AUD/USD Daily Report
Daily Pivots: (S1) 0.6464; (P) 0.6548; (R1) 0.6596; More...
Intraday bias in AUD/USD remains on the downside for the moment. Decisive break of 0.6480 support will argue that is ready to resume through 0.6442. Next target will be 61.8% projection of 0.6870 to 0.6442 from 0.6643 at 0.6378. For now, risk will stay mildly on the downside as long as 0.6643 resistance holds, in case of recovery.
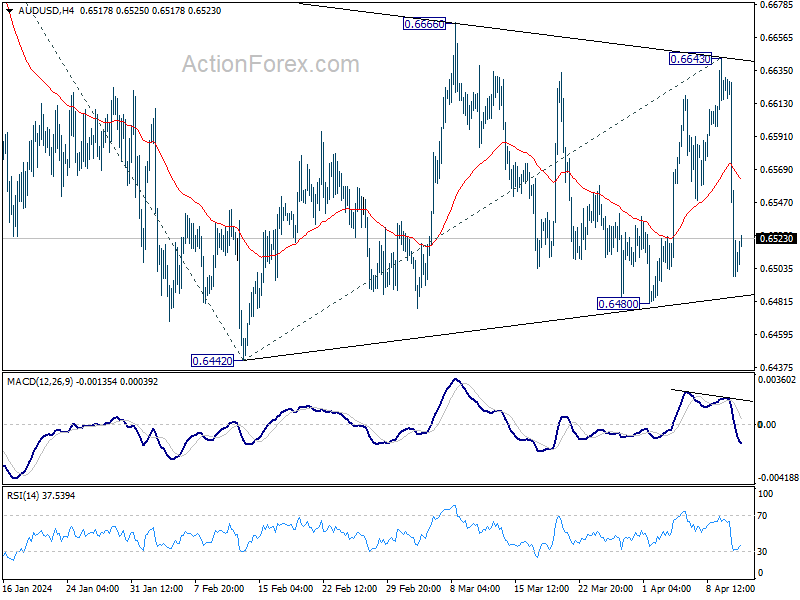
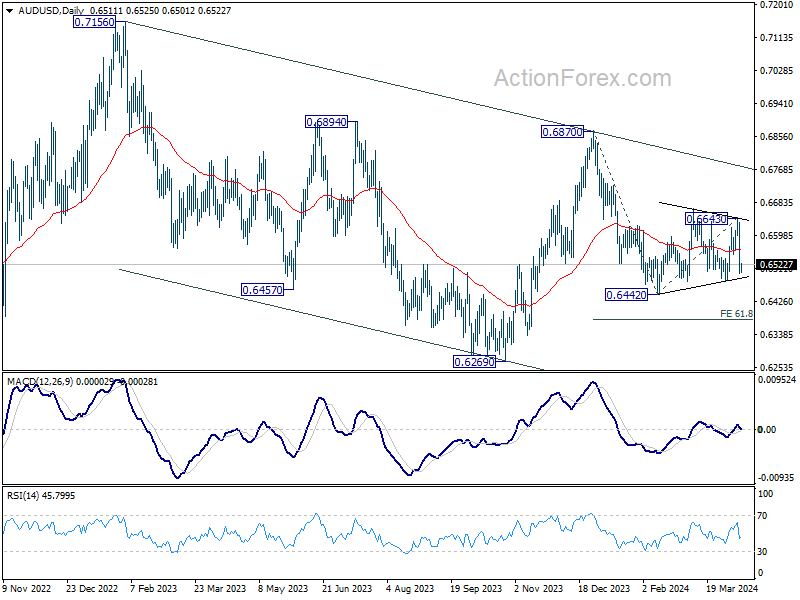
In the bigger picture, price actions from 0.6169 (2022 low) are seen as a medium term corrective pattern to the down trend from 0.8006 (2021 high). Fall from 0.7156 (2023 high) is seen as the second leg, which might still be in progress. Overall, sideway trading could continue in range of 0.6169/7156 for some more time. But as long as 0.7156 holds, an eventual downside breakout would be mildly in favor.
USD/JPY Daily Outlook
Daily Pivots: (S1) 152.09; (P) 152.66; (R1) 153.73; More...
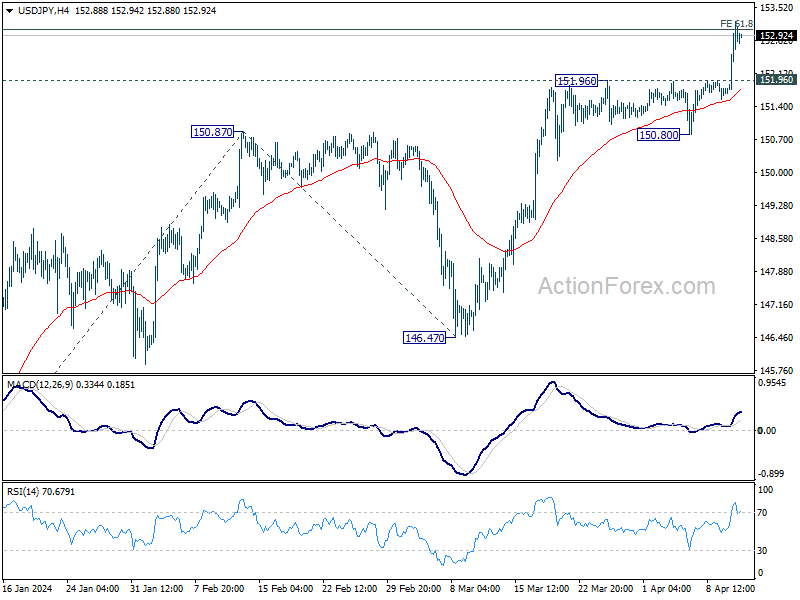
Intraday bias in USD/JPY remains on the upside at this point. 61.8% projection of 140.25 to 150.87 from 146.47 at 153.03 is already met but there is not sign of topping yet. Sustained break there will target 155.20 projection level next. On the downside, below 151.95 support will turn intraday bias neutral again. But outlook will stay bullish as long as 150.80 support holds.
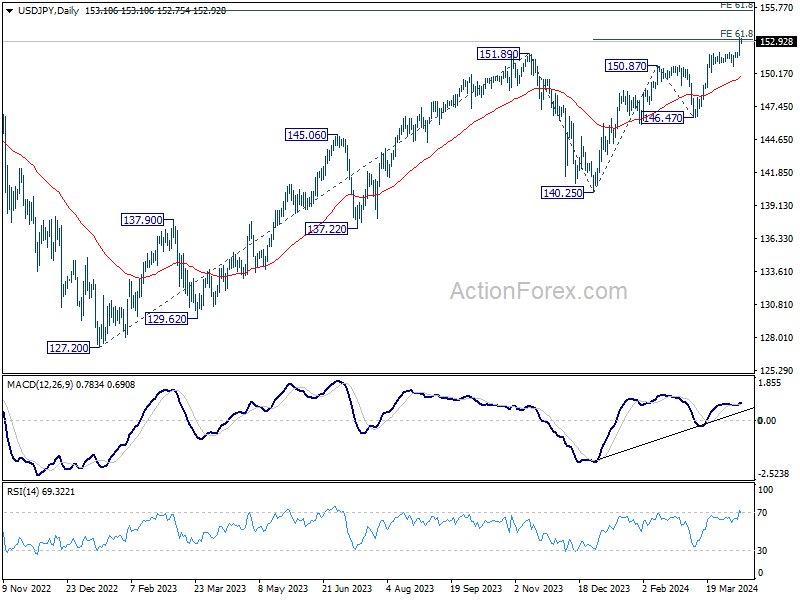
In the bigger picture, correction from 151.87 (2023) high could have completed at 140.25 already. Rise from 127.20 (2023 low), as part of the long term up trend, is probably ready to resume. Decisive break of 151.93 resistance (2022 high) will confirm this bullish case. Next medium term target will be 61.8% projection of 127.20 to 151.89 from 140.25 at 155.20. This will remain the favored case as long as 146.47 support holds, in case of another pullback.
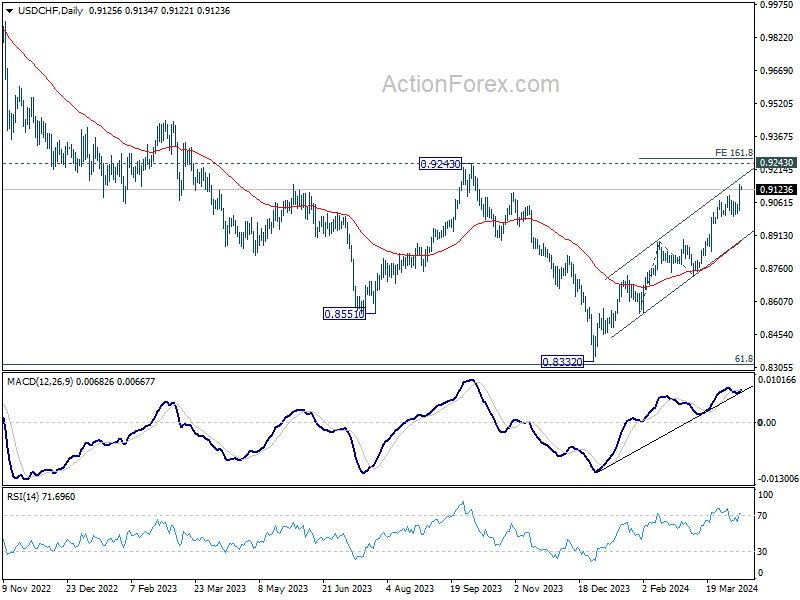
USD/CHF Daily Outlook
Daily Pivots: (S1) 0.9051; (P) 0.9100; (R1) 0.9177; More....
Intraday bias in USD/CHF remains on the upside for the moment. Current rise is part of the whole rally from 0.8332. Next target is 161.8% projection of 0.8550 to 0.8884 from 0.8728 at 0.8818. For now, near term outlook will stay bullish as long as 0.8996 support holds, in case of retreat.
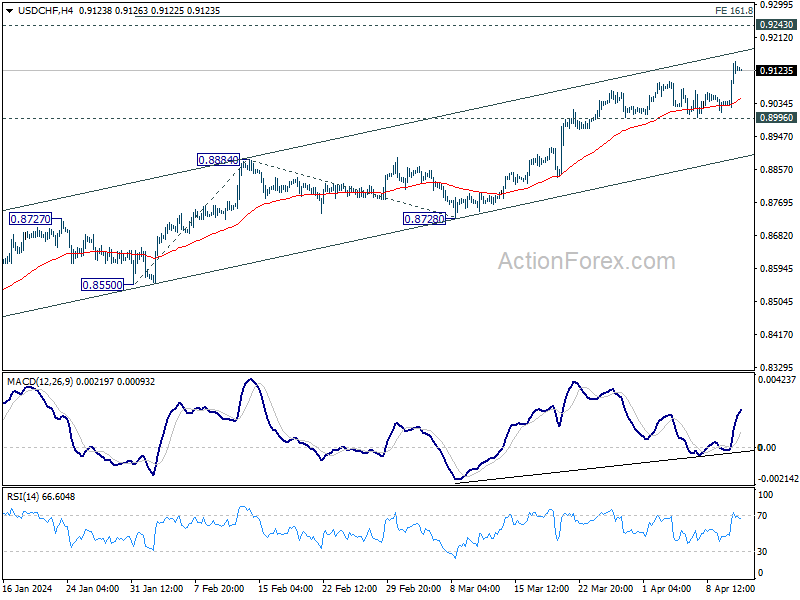
In the bigger picture, price actions from 0.8332 medium term bottom as tentatively seen as developing into a corrective pattern to the down trend from 1.0146 (2022 high). Further rise would be seen as long as 0.8728 support holds. But upside should be limited by 0.9243 resistance, at least on first attempt.
GBP/USD Daily Outlook
Daily Pivots: (S1) 1.2471; (P) 1.2589; (R1) 1.2659; More...
Intraday bias in GBP/USD remains on the downside at this point. Decisive break of 1.2517 support will carry larger bearish implication. Next near term target will be 61.8% projection of 1.2892 to 1.2538 from 1.2708 at 1.2489. Firm break there could trigger downside acceleration to 100% projection at 1.2354. On the upside, above 1.2581 minor resistance will turn intraday bias neutral first. But risk will stay on the downside as long as 1.2708 resistance holds, in case of recovery.
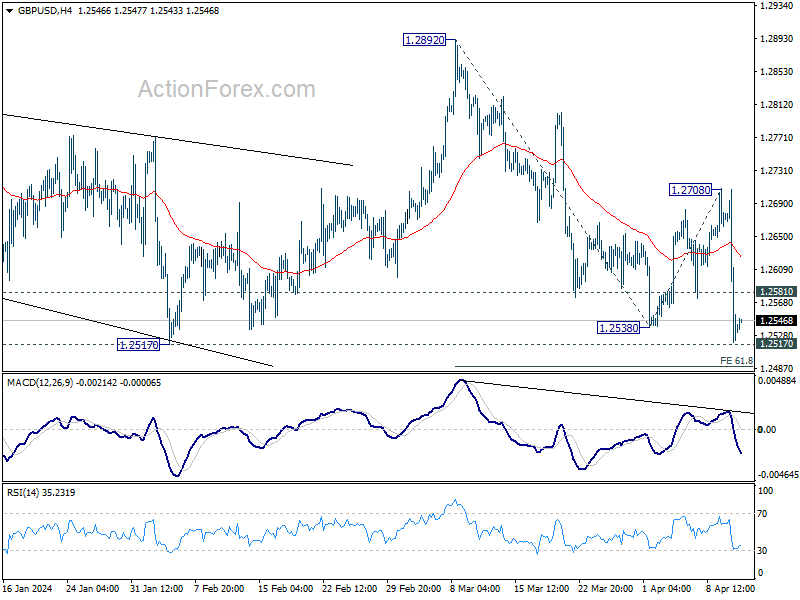
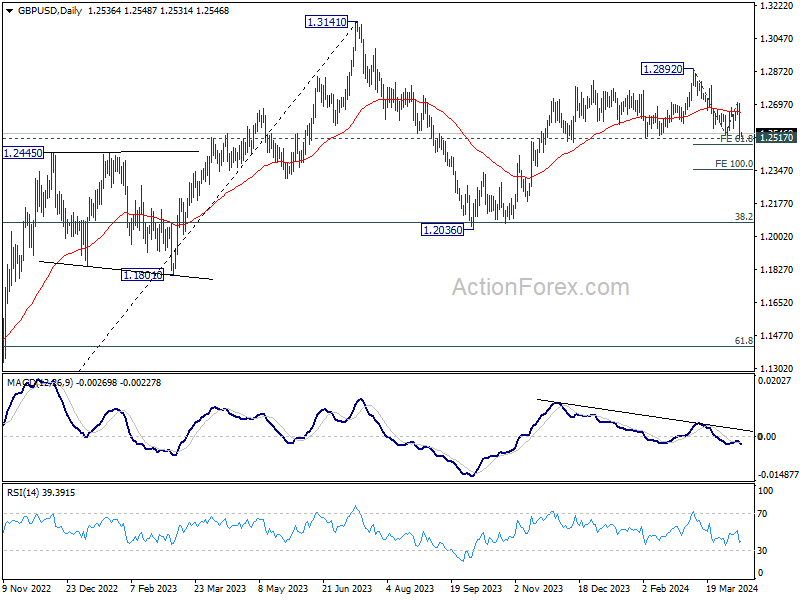
In the bigger picture, price actions from 1.3141 medium term top are seen as a corrective pattern to up trend from 1.0351 (2022 low). Rise from 1.2036 is seen as the second leg, which might still be in progress. But upside should be limited by 1.3141 to bring the third leg of the pattern. Meanwhile, firm break of 1.2517 support will argue that the third leg has already started for 38.2% retracement of 1.0351 (2022 low) to 1.3141 at 1.2075 again.
EUR/USD Daily Outlook
Daily Pivots: (S1) 1.0692; (P) 1.0779; (R1) 1.0830; More...
Intraday bias in EUR/USD remains on the downside for 1.0694/0723 support zone. Decisive break there will resume whole fall from 1.1138. Next target is 100% projection of 1.1138 to 1.0694 from 1.0980 at 1.0536. On the upside, above 1.0790 minor resistance will turn intraday bias neutral first. But risk will stay on the downside as long as 1.0884 resistance holds, in case of recovery.
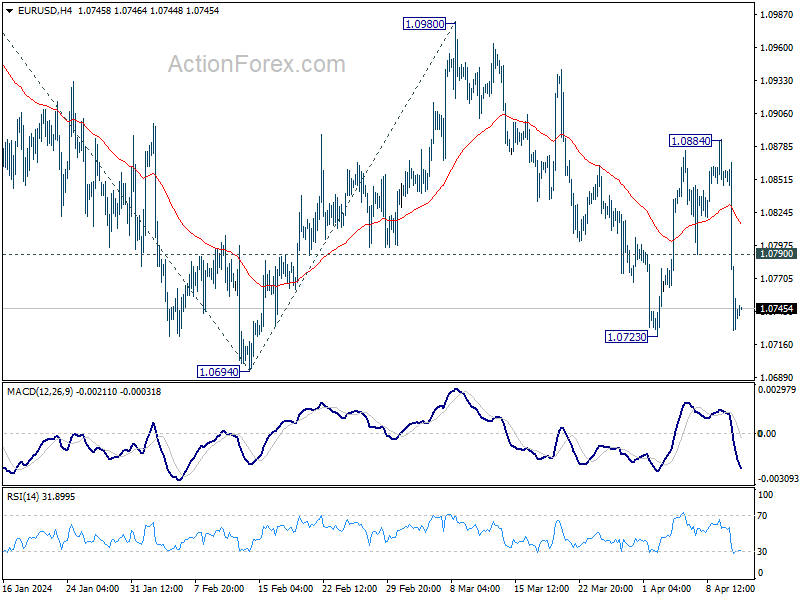
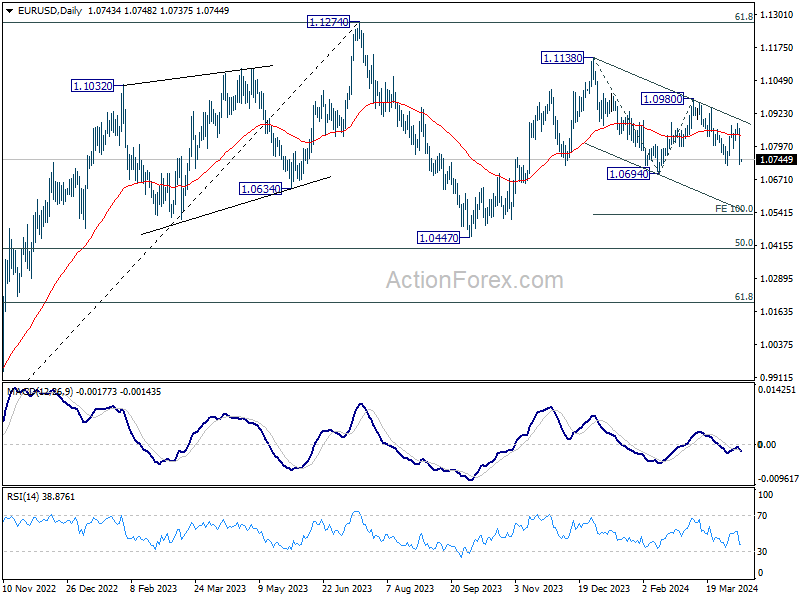
In the bigger picture, price actions from 1.1274 are viewed as a corrective pattern to rise from 0.9534 (2022 low). Rise from 1.0447 is seen as the second leg. While further rally could cannot be ruled out, upside should be limited by 1.1274 to bring the third leg of the pattern. Meanwhile, sustained break of 1.0694 support will argue that the third leg has already started for 1.0447 and possibly below.
Dollar Holds Strong as June Rate Cut Expectations Wane; ECB to be Non-Event
Dollar remains firm in Asian session after the strong post-CPI rally. US stocks were deeply sold off as a June Fed rate cut is further priced out by the markets. Market attention is now keenly focused on the upcoming PPI for March, as well as University of Michigan's consumer survey results. Should today's PPI data reveal strong figures, followed by heightened consumer inflation expectations tomorrow, it could further delay the Fed's anticipated rate reduction timeline, thereby reinforcing the Dollar's strength.
In Europe, the financial markets are braced for ECB rate decision, with broad consensus anticipating the main refinancing rate to hold steady at 4.50%. ECB has communicated clearly its conditional plan to initiate rate cuts by June, dependent on the first-quarter wage data due in May. By then, new economic projections will be available too to guide monetary policy decision. It's unlikely that ECB will depart from its cautious stance at this juncture. President Christine Lagarde would continue to emphasize a data-dependent approach and reaffirm the meeting-by-meeting decisions. Today's announcement and subsequent press conference are anticipated to have minimal impact on the markets.
Throughout this week, Dollar is currently the dominant currency, outpacing its counterparts with no significant competition. Swiss Franc has underperformed the most, followed by Australian Dollar, Euro, Yen, Sterling, Canadian Dollar, and New Zealand Dollar in order. Yen, in particular, finds itself in the middle position following Japan's hesitancy to signal an imminent intervention in currency markets. Notably, all non-Dollar currencies are currently trading within the previous week's range, indicating a lack of definitive strength or weakness among them.
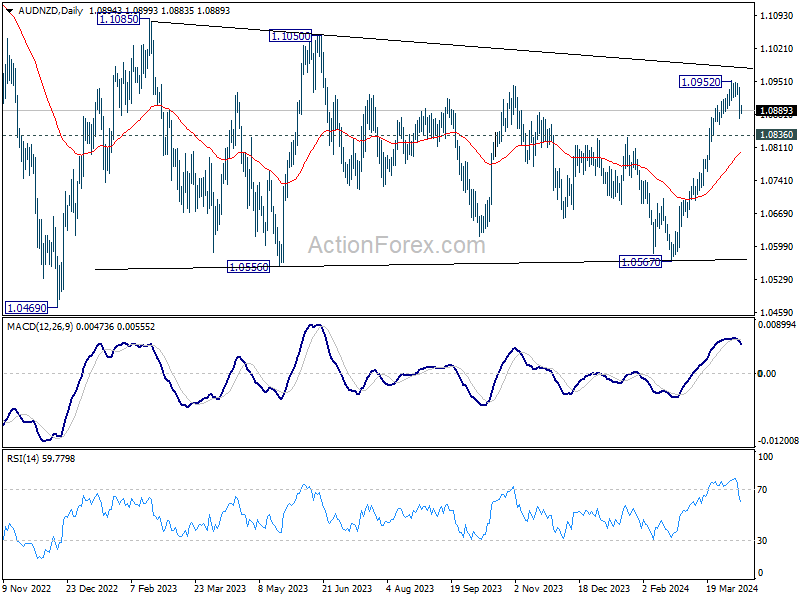
Technically, AUD/NZD is worth a watch in the coming days. This week's retreat raises the chance that rebound from 1.0567 has completed at 1.0952, ahead of medium trend line resistance. Firm break of 1.0836 support will argue that the sideway pattern from 1.1085 is starting another falling leg back to 55 D EMA (now at 1.0800) first, and then towards 1.0567 support.
In Asia, at the time of writing, Nikkei is down -0.41%. Hong Kong HSI is down -0.76%. China Shanghai SSE is up 0.37%. Singapore Strait Times is down -0.37%. Japan 10-year JGB yield surges sharply by 0.0611 to 0.860. Overnight, DOW fell -1.09%. S&P 500 fell -0.95%. NASDAQ fell -0.84%. 10-year yield rose 0.069 to 4.378.
DOW takes a dive and Dollar leaps, as traders start to dismiss June Fed cut
Bets on a Fed rate cut in June receded sharply following yesterday's stronger than expected US CPI report. The drastic shift in sentiment led to steep decline in DOW and strong rally in Dollar index. FOMC minutes further cemented this outlook, revealing Fed's cautious stance on interest policy easing and its desire for more evidence of disinflation progress before considering rate cuts.
The March FOMC minutes highlighted a consensus among members regarding the "uncertainty" surrounding the "persistence of high inflation". Recent economic data did little to assuage these concerns, failing to increase the Committee's confidence that inflation was on a steady decline toward 2% target.
The minutes further detailed concerns over the "relatively broad based" nature of recent inflation increases, cautioning against dismissing these trends as mere statistical outliers. This characteristic led to a consensus that these developments should not be hastily dismissed as "merely statistical aberrations."
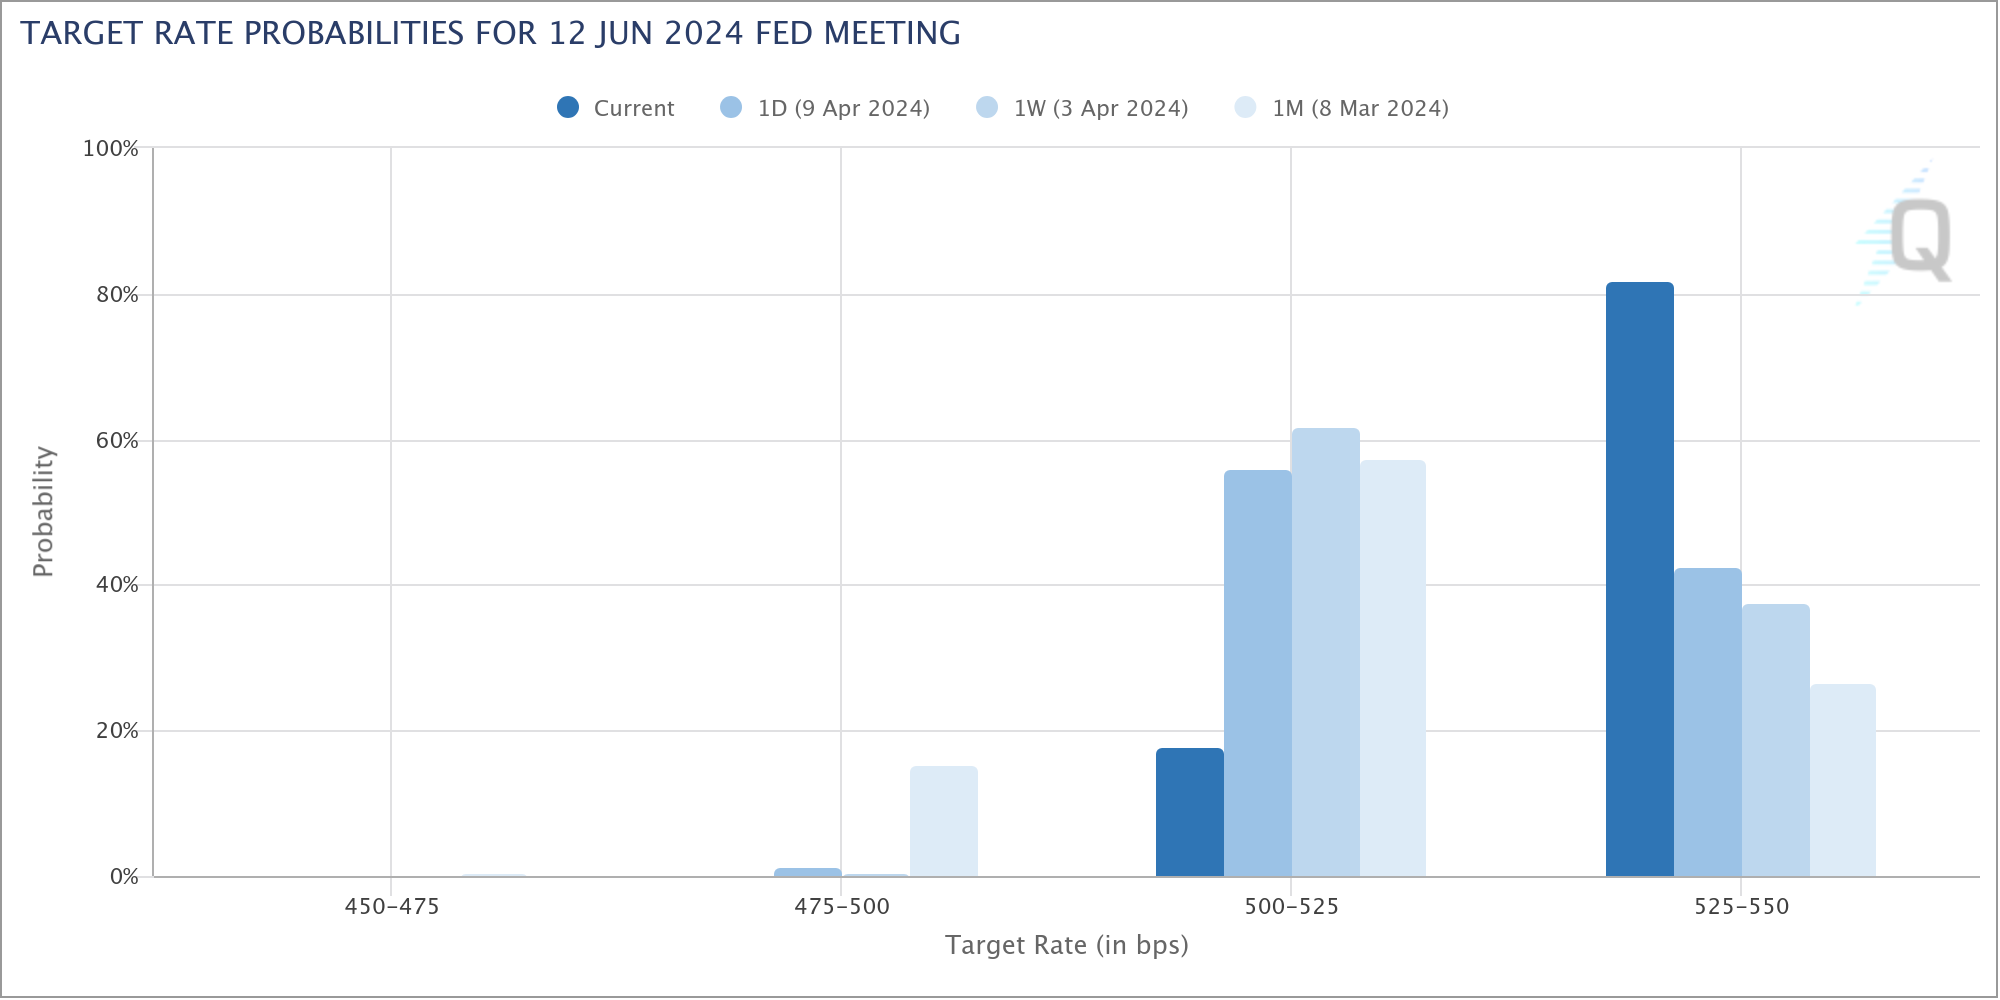
Fed fund futures are now pricing in just 18% chance of a Fed rate cut in June, comparing to 58% a day ago.
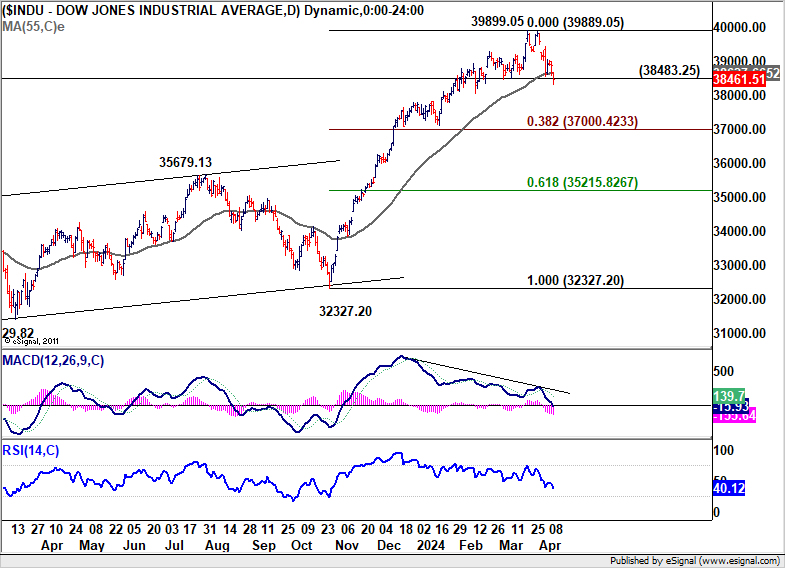
DOW closed down -422 pts or -1.09% at 38461.51. Technically, the break of 38483.25 support and 55 D EMA suggest that rise from 32327.20 has completed at 39899.05, on bearish divergence conditions in D MACD. Deeper correction is in favor to 38.2% retracement of 32327.20 to 39899.05 at 37000.42.
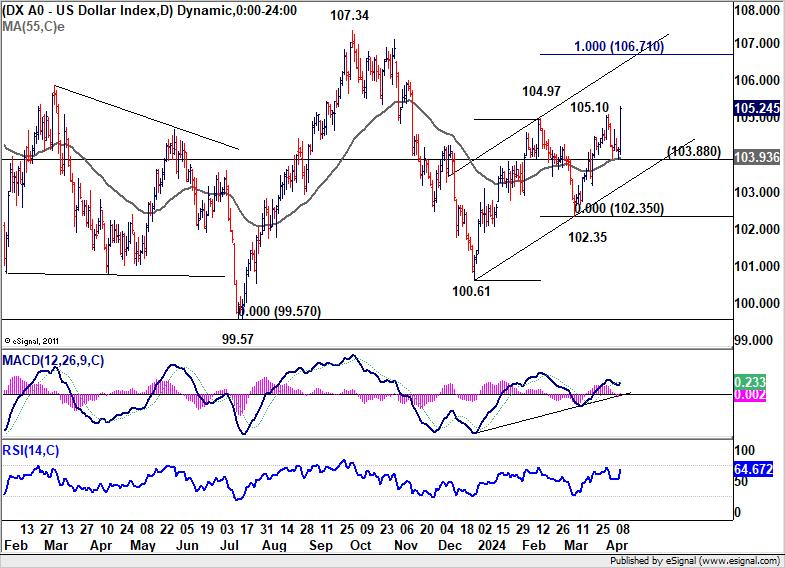
Dollar Index surged sharply to close at 105.24. Break of 150.10 resistance indicates resumption of whole rally from 100.61. Also, the strong support from 55 D EMA is a clear near term bullish sign. Further rally is now expected as long as 103.93 support holds. Next target is 100% projection of 100.61 to 104.97 from 102.35 at 106.71.
Japan's Suzuki and Kanda: No predetermined Yen levels for currency intervention
Japanese Yen's steep decline through 152 mark against Dollar overnight has put attention on potential currency intervention. However, responses from key officials today suggest a more measured approach is being considered at this point. In particular, Finance Minister Shunichi Suzuki acknowledged the mixed implications of a weakening Yen, with pros and cons. Its looks like Japan is not gearing up for direct intervention at the current level.
Suzuki highlighted the government is looking at the currency markets "with a high sense of urgency". But he also emphasized that Japan is "not just looking at levels" such as 152 or 153, but also the underlying factors driving Yen's depreciation.
Suzuki reiterated the government's preference for currency stability, emphasizing that exchange rates should reflect economic fundamentals rather than short-term volatilities.
Masato Kanda, Japan's top currency diplomat, echoed this sentiment by highlighting the recent pace of Yen's movements as "rapid." While not dismissing interventions, Kanda pointed out the absence of a fixed level that would trigger such actions. "I don't have any particular level in mind," he noted.
China's CPI falls back to 0.1%, PPI negative for 18th month
China's CPI slowed significantly from 0.7% yoy to 0.1% yoy in March, coming in below expectation of 0.4% yoy. Core CPI, which strips out food and energy prices, also decelerated from 1.2% yoy to 0.6% yoy. This shift was largely influenced by a notable -2.7% decrease in food prices, while non-food prices edged up rose 0.7%. Month-on-month, CPI declined -1.0% mom.
NBS attributed this March dip in CPI to a "seasonal decline in consumer demand following the holidays and the overall sufficient market supply."
In parallel, PPI, a measure of factory-gate prices, edged down further to -2.8% yoy from February's -2.7% yoy, aligning with market expectations. This continuation of downward trend for the 18th consecutive month emphasizes persistent deflationary pressures within the manufacturing sector. On a month-on-month basis, PPI contracted by -0.1%.
Looking ahead
ECB rate deicsion in the main focus in Euroepan session while Italy will release industria output. Later in the day, US will publish PPI and jobless claims.
EUR/USD Daily Outlook
Daily Pivots: (S1) 1.0692; (P) 1.0779; (R1) 1.0830; More...
Intraday bias in EUR/USD remains on the downside for 1.0694/0723 support zone. Decisive break there will resume whole fall from 1.1138. Next target is 100% projection of 1.1138 to 1.0694 from 1.0980 at 1.0536. On the upside, above 1.0790 minor resistance will turn intraday bias neutral first. But risk will stay on the downside as long as 1.0884 resistance holds, in case of recovery.
In the bigger picture, price actions from 1.1274 are viewed as a corrective pattern to rise from 0.9534 (2022 low). Rise from 1.0447 is seen as the second leg. While further rally could cannot be ruled out, upside should be limited by 1.1274 to bring the third leg of the pattern. Meanwhile, sustained break of 1.0694 support will argue that the third leg has already started for 1.0447 and possibly below.
Economic Indicators Update
| GMT | Ccy | Events | Actual | Forecast | Previous | Revised |
|---|---|---|---|---|---|---|
| 23:01 | GBP | RICS Housing Price Balance Mar | -4% | -6% | -10% | |
| 23:50 | JPY | Money Supply M2+CD Y/Y Mar | 2.50% | 2.40% | 2.50% | 2.40% |
| 01:00 | AUD | Consumer Inflation Expectations Apr | 4.60% | 4.30% | ||
| 01:30 | CNY | CPI Y/Y Mar | 0.10% | 0.40% | 0.70% | |
| 01:30 | CNY | PPI Y/Y Mar | -2.80% | -2.80% | -2.70% | |
| 08:00 | EUR | Italy Industrial Output M/M Feb | 0.50% | -1.20% | ||
| 12:15 | EUR | ECB Main Refinancing Operations Rate | 4.50% | 4.50% | ||
| 12:15 | EUR | ECB Rate On Deposit Facility | 4.00% | 4.00% | ||
| 12:30 | USD | PPI M/M Mar | 0.30% | 0.60% | ||
| 12:30 | USD | PPI Y/Y Mar | 2.30% | 1.60% | ||
| 12:30 | USD | PPI Core M/M Mar | 0.20% | 0.30% | ||
| 12:30 | USD | PPI Core Y/Y Mar | 2.30% | 2.00% | ||
| 12:30 | USD | Initial Jobless Claims (Apr 5) | 215K | 221K | ||
| 12:45 | EUR | ECB Press Conference | ||||
| 14:30 | USD | Natural Gas Storage | 14B | -37B |
EUR/USD Outlook Ahead of ECB Main Refinancing Rate and Monetary Policy
Talking Points
- European Central Bank – ECB
- US Consumer Price Index – US CPI
- EUR/USD Technical Analysis – Weekly Chart
EUR/USD has been grappling with significant pressure over the past few weeks, caught between the influence of inflation data and the ongoing speculation on the USA and Euro Zone interest rate paths. Since January 1st, 2024, the pair has been trading within a range as high as 1.1000 and as low as 1.0700, and most of the trading days witnessed price action between 1.0780 and 1.0920 as economic and inflation data continued to shape the markets, underscoring the importance of these factors in the pair’s performance.
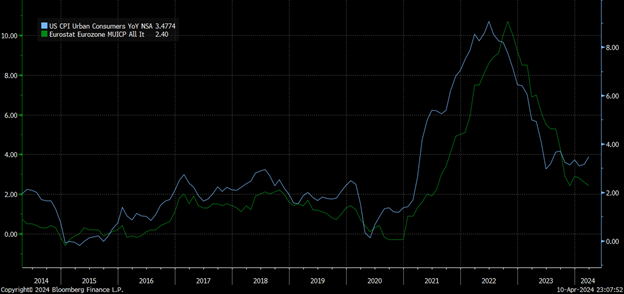
Source: Bloomberg Finance L.P.
European Central Bank – ECB
- The European Central Bank (ECB) is set to meet this Thursday, April 11th, 2024. For its latest meeting on March 7th, 2024, the ECB kept the interest rate on hold at its current level of 4.5%. According to Bloomberg Analysts’ Survey, the probability of a rate cut for the April 11th,2024, meeting currently stands at 4.4%, compared to 82.2% for the June 6th,2024, meeting.
- Inflation in the Euro Zone has been steadily declining. The Eurozone HICP Y/Y is currently at 2.4%, slightly above the ECB’s target of 2%. The decline in the inflation rate was reflected in all index components, unlike the USA, where service costs remained higher for longer. The Eurozone HICP M/M remains close to its recent averages; however, it rose slightly in January and February 2024. The decline in the Eurozone inflation over the past few months may have impacted the recent weakness of the Euro price against other currencies; thus, traders will be looking for the ECB to clarify their expectations for a June rate cut.
Consumer Price Index – US CPI
- The US CPI, Core CPI M/M, and Y/Y were released on Wednesday, along with the minutes for the FOMC latest meeting. The US CPI and Core CPI rose by 0.4% in March, a similar percentage change to February 2024; the CPI Y/Y rose by 3.5%, compared to 3.2%. The numbers mean that US Inflation may remain higher for longer and, by default, less than expected FED interest rate cuts for 2024. The minutes of the latest FOMC Meeting showed that Policymakers acknowledged the impact of higher rates on growth; however, their main concern is still Inflation.
EUR/USD Technical Analysis – Weekly Chart
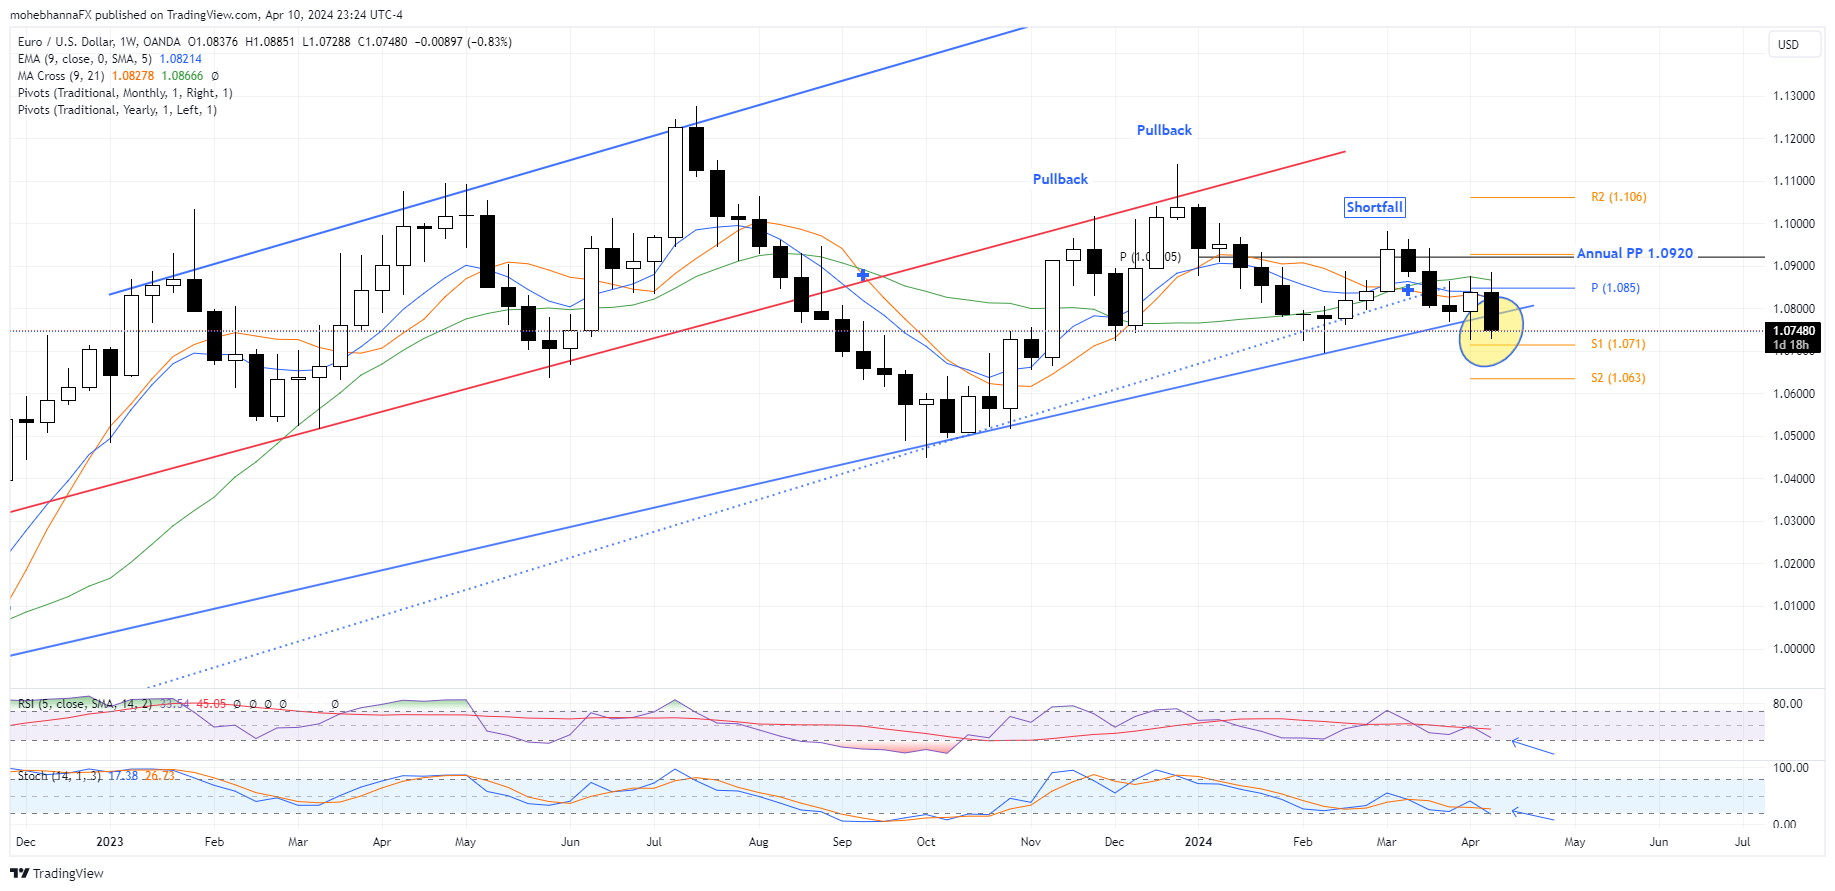
Source: TradingView.com
- The overall long-term chart context remains unchanged and still reflects a “Rising Wedge” formation for the downtrend, which began mid-2021; price action attempted to break below the lower pattern border; however, last week’s candle closed with a hammer formation above the support level represented by the channel lower border, thus adding more weight to the price level. (Highlighted Ellipse)
- Price action is currently trading below its monthly pivot point of 1.0850. The pivot point intersects with EMA9, SMA9, and SMA20, forming a confluence of resistance above the current market price.
- Price action continued to trade below the annual pivot point of 1.0920, representing a critical level to watch for breakouts.
- The EURUSD price decline that occurred after last Friday’s NFP has faded as the price rose back to its opening levels by the end of the trading day, forming a hammer candlestick on the Daily Chart, however, EUR/USD dropped again after high US inflation date.
- RSI remained in line with price action and broke above its moving average.
- The Stochastic Indicator aligns with price action, and the %K line crosses above the %D line.
DAX Looking to Do Double Correction
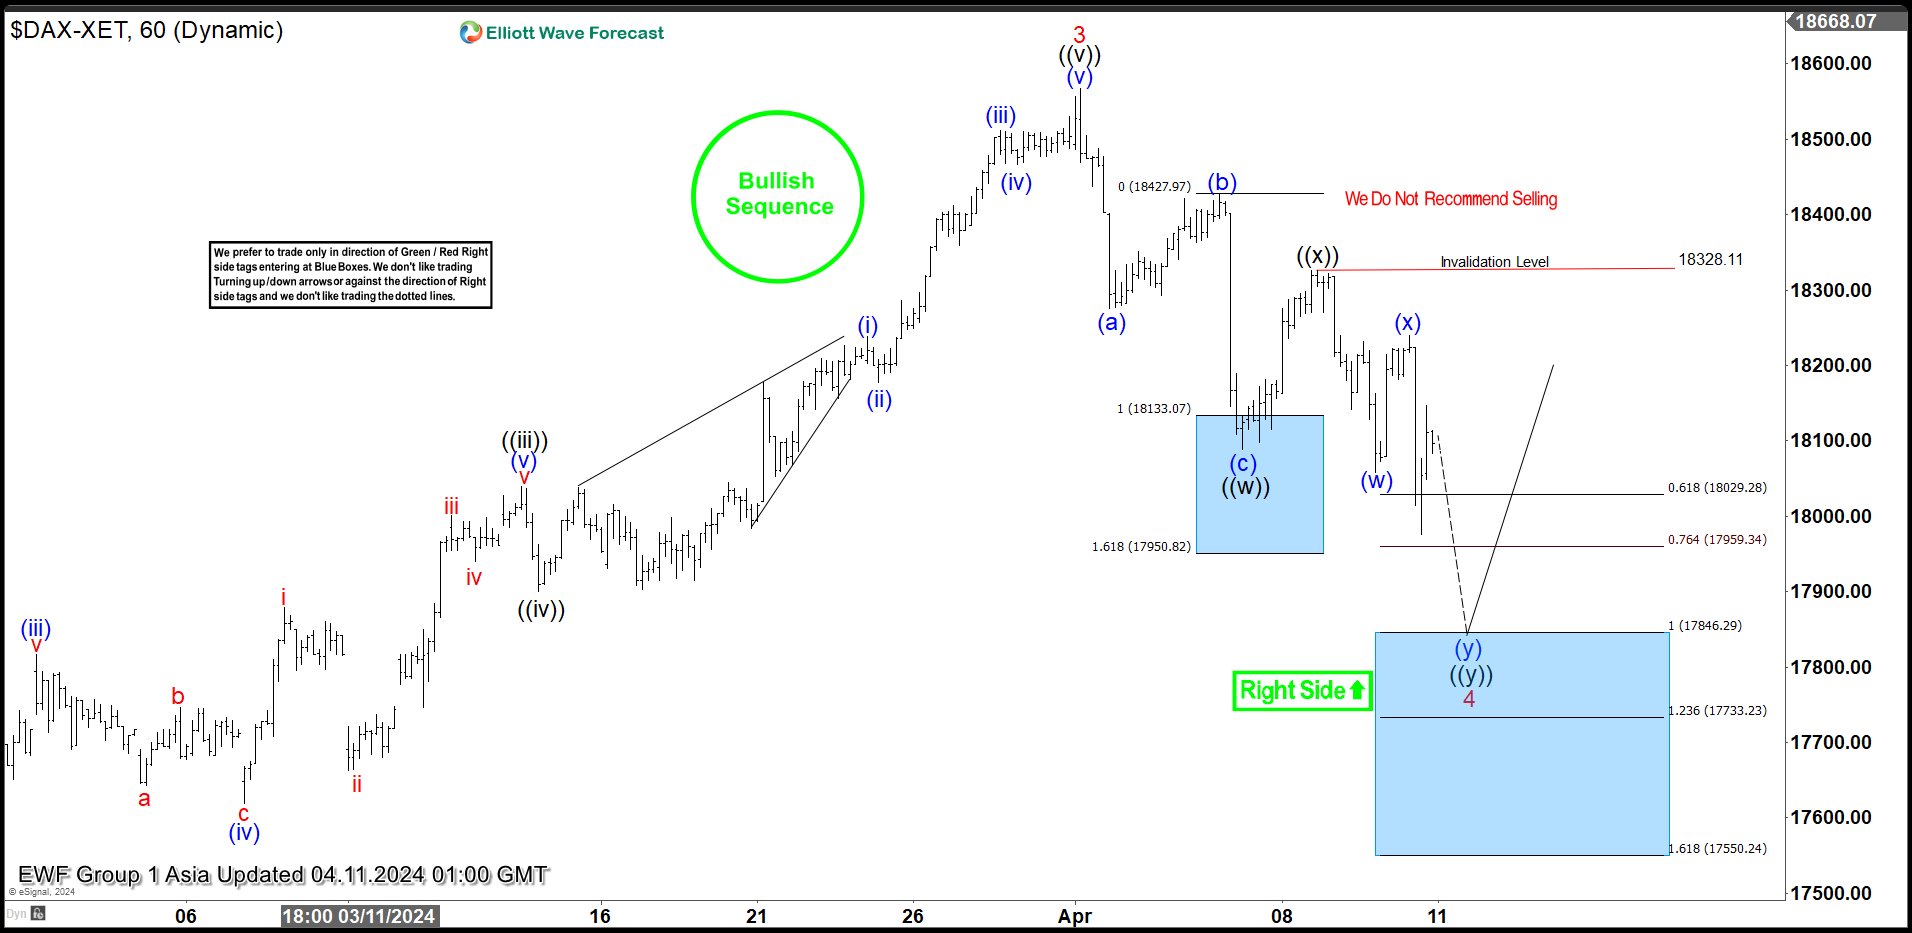
Cycle from 10.23.20223 low in DAX is in progress as an impulse Ellliott Wave structure. Up from there, wave 1 ended at 17003.28 and wave 2 pullback ended at 16345.02. The Index rallied higher again in wave 3 towards 18567.16. Pullback in wave 4 is currently in progress as a double three Elliott Wave structure. Down from wave 3, wave (a) ended at 18275.94 and wave (b) ended at 18427.43. Wave (c) lower ended at 18088.03 which completed wave ((w)) in higher degree. Rally in wave ((x)) ended at 18326.37 and the Index has turned lower again.
Down from wave ((x)), wave (w) ended at 18058.22 and wave (x) ended at 18239.50. The Index turns lower again in wave (y). Expect the Index to extend lower to reach the extreme area from 4.2.2024 high towards 17550.24 – 17733.23. This should complete wave (y) of ((y)) of 4. Afterwards, Index should rally from the blue box in wave 5 higher or rally in 3 waves at least. Near term, while below 18328.11, Index may see further downside to the blue box area.
DAX 60 Minutes Elliott Wave Chart
DAX Elliott Wave Video
https://www.youtube.com/watch?v=vd86nM2Fge0