
Sample Category Title
USD: Powell Speaks on Cutting Interest Rates
Jerome H. Powell, the Federal Reserve chair, stated that the central bank can afford to be patient in deciding when to cut interest rates, citing easing inflation and stable economic growth. Powell emphasized the Fed's independence from political influences, particularly relevant as the election season nears. The Fed had raised interest rates to 5.3 percent to address rapid inflation but may consider lowering them as price increases subside. However, the timing of rate cuts remains uncertain, with officials awaiting further evidence of sustained inflation moderation, likely delaying any action until June or July. Despite criticism, Powell reaffirmed the Fed's commitment to basing decisions on economic factors rather than political considerations.
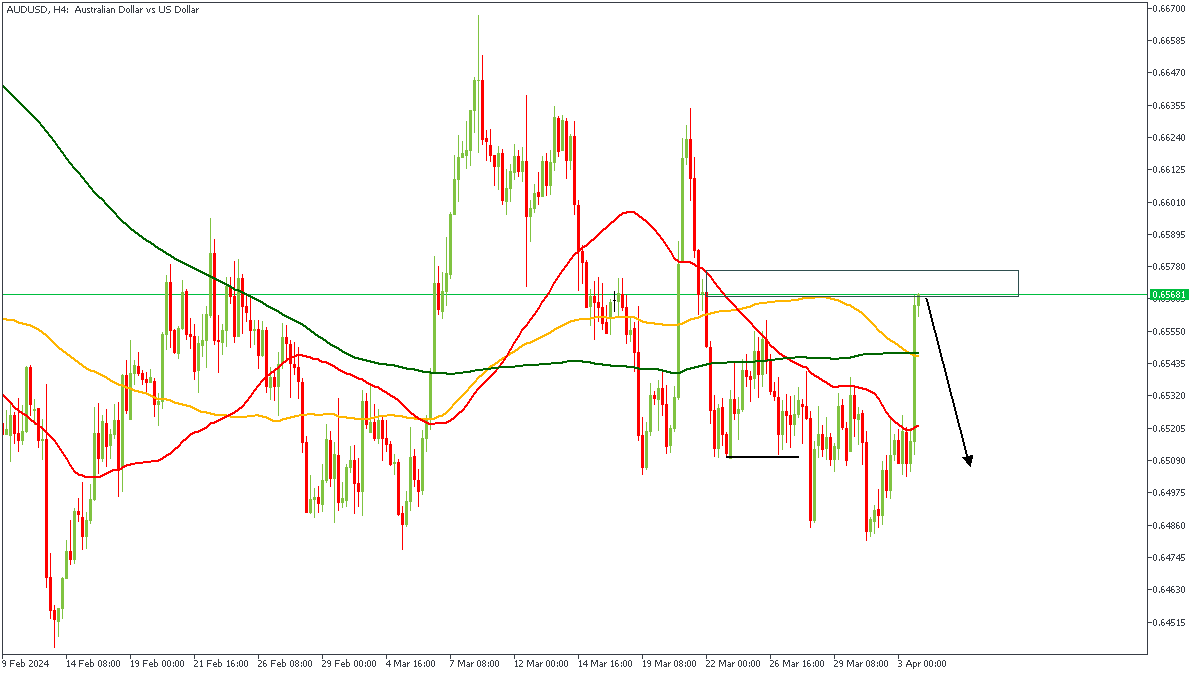
AUDUSD - H4 Timeframe
After the initial break of structure on the 4-hour timeframe of AUDUSD, we’ve seen price make a run for the previous area of supply. This region is crucial because it is a supply zone that is being tested right after a sweep of liquidity. Also, we see the bearish array of the moving averages, as well as the equal lows down below, which could serve as a good level for another run on liquidity. All in all, my sentiment here is bearish.
Analyst’s Expectations:
- Direction: Bearish
- Target: 0.65210
- Invalidation: 0.65781
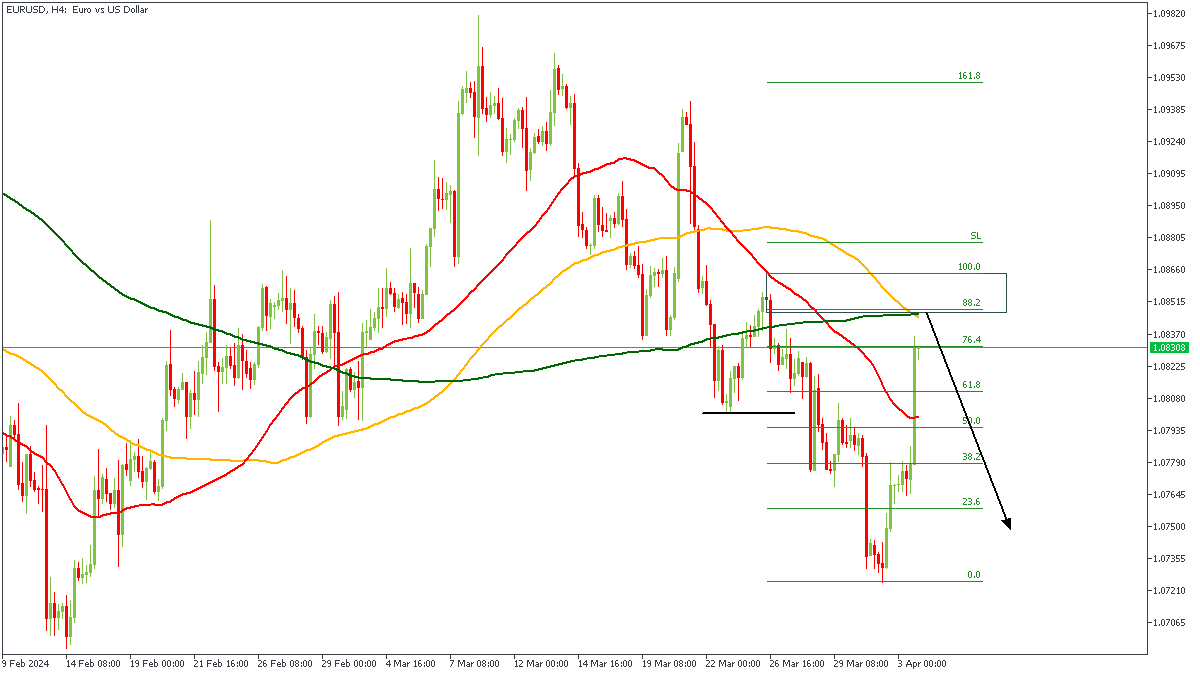
EURUSD - H4 Timeframe
EURUSD recently broke below the previous low, hence, I expect price to make a return to the supply zone that engineered the break of structure. Also, the confluence of the 100 and 200 period moving averages may be considered a viable area of resistance, especially since the moving averages are in a descending order. Finally, the 88% of the Fibonacci retracement, and the rally-base-drop supply zone are the final pieces of the puzzle towards my bearish sentiment.
Analyst’s Expectations:
- Direction: Bearish
- Target: 1.07797
- Invalidation: 1.08657
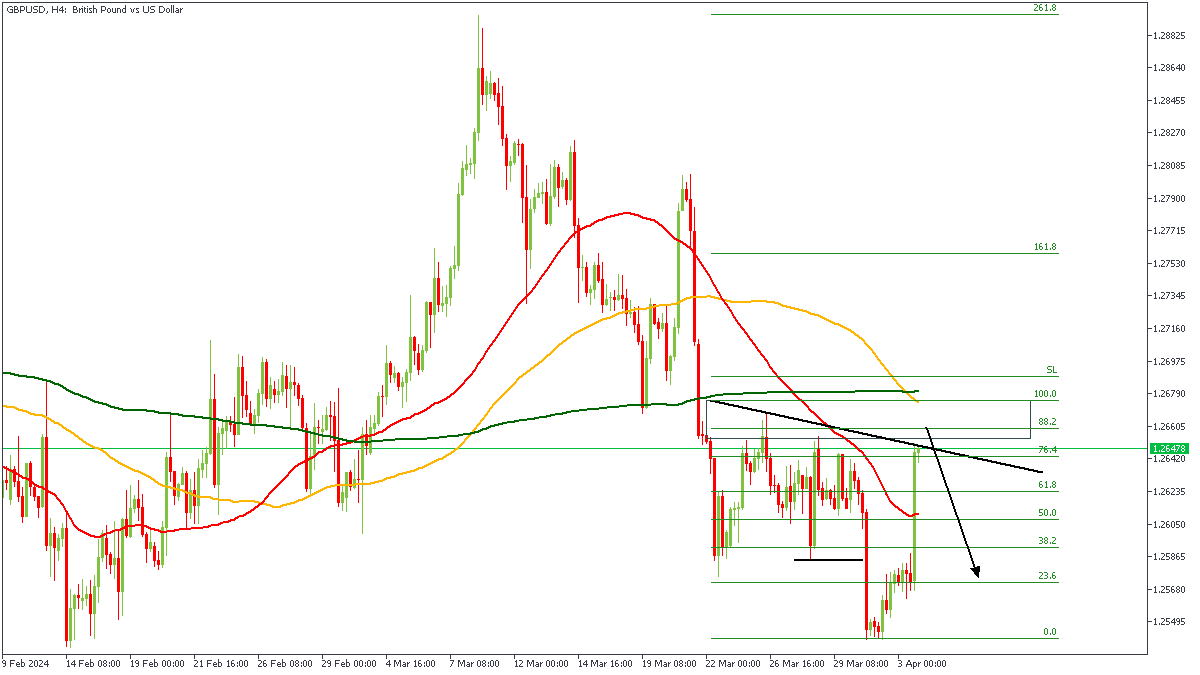
GBPUSD - H4 Timeframe
GBPUSD is currently reflecting the price action on EURUSD, albeit with some slight modification. Here on the 4-hour chart of GBPUSD, we see the initial break of structure, and the race to retest the supply zone that engineered that break. Also, we clearly see the bearish array of the moving averages, the 88% Fibonacci retracement level, trendline resistance, as well as the overlap of the 100 and 200 moving averages with the rally-base-drop supply zone. All these point to the likelihood of a bearish outcome.
Analyst’s Expectations:
- Direction: Bearish
- Target: 1.25897
- Invalidation: 1.26766
CONCLUSION
The trading of CFDs comes at a risk. Thus, to succeed, you have to manage risks properly. To avoid costly mistakes while you look to trade these opportunities, be sure to do your due diligence and manage your risk appropriately.
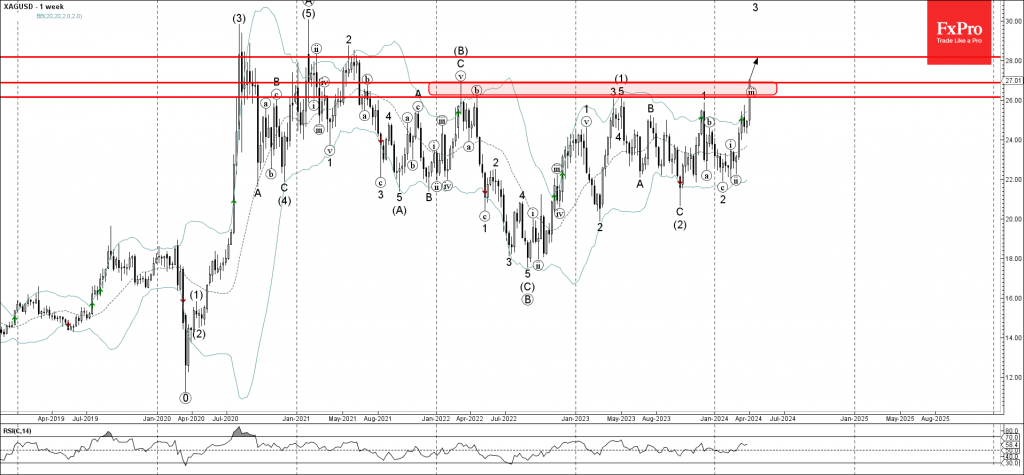
Silver Wave Analysis
- Silver broke major resistance zone
- Likely to rise to resistance level 28.00
Silver under the bullish pressure after the recent breakout of the major resistance zone located between the resistance levels 26.15 and 26.90 (previous yearly highs from 2022 and 2023).
The breakout of the resistance levels 26.15 and 26.90 accelerated the active impulse waves 3 and (3).
Given the clear multiyear uptrend, Silver can be expected to rise further to the next resistance level 28.00 (former strong resistance from 2021).
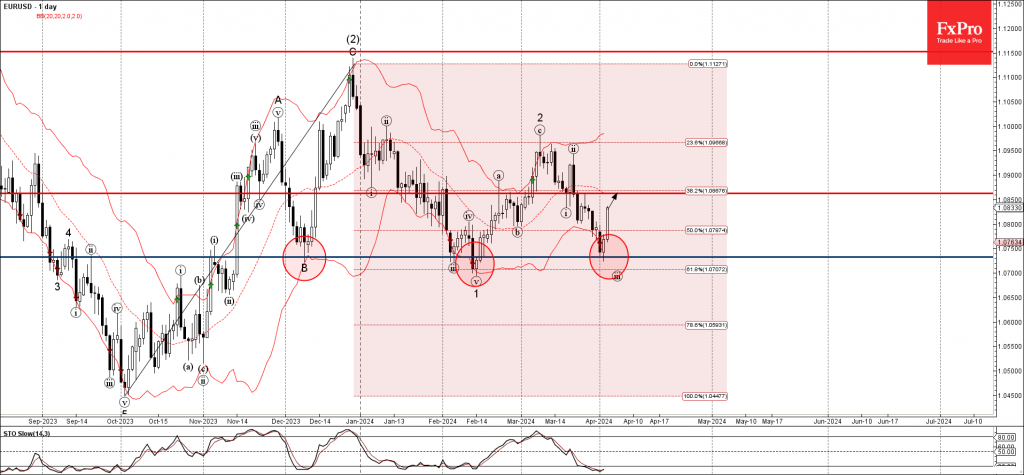
EURUSD Wave Analysis
- EURUSD reversed from key support level 1.0730
- Likely to rise to resistance level 1.0860
EURUSD currency pair recently reversed up from the key support level 1.0730, which has been reversing the pair from the start of December, standing near the lower daily Bollinger Band and the 61.8% Fibonacci correction of the upward impulse from October
The upward reversal from the support level 1.0730 created the daily Japanese candlesticks reversal pattern Piercing Line.
Given the oversold daily Stochastic, EURUSD currency pair can be expected to rise further to the next resistance level 1.0860.
NASDAQ Futures (NQ_F) Is Giving Us a Bounce from the Buying Zone
Hello fellow traders. As our members know , NASDAQ has recently given us plenty of positive buying setups. In this article we’re going to present Elliott Wave charts of NQ_F published in the members area of the website. NASDAQ made a clear 3 waves pull back that has unfolded as Elliott Wave Double Three pattern. It made clear 3 waves down from the February 23rd peak and completed correction right at the Equal Legs zone ( Blue Box Area) . In further text we’re going to explain the Elliott Wave pattern and trading setup.
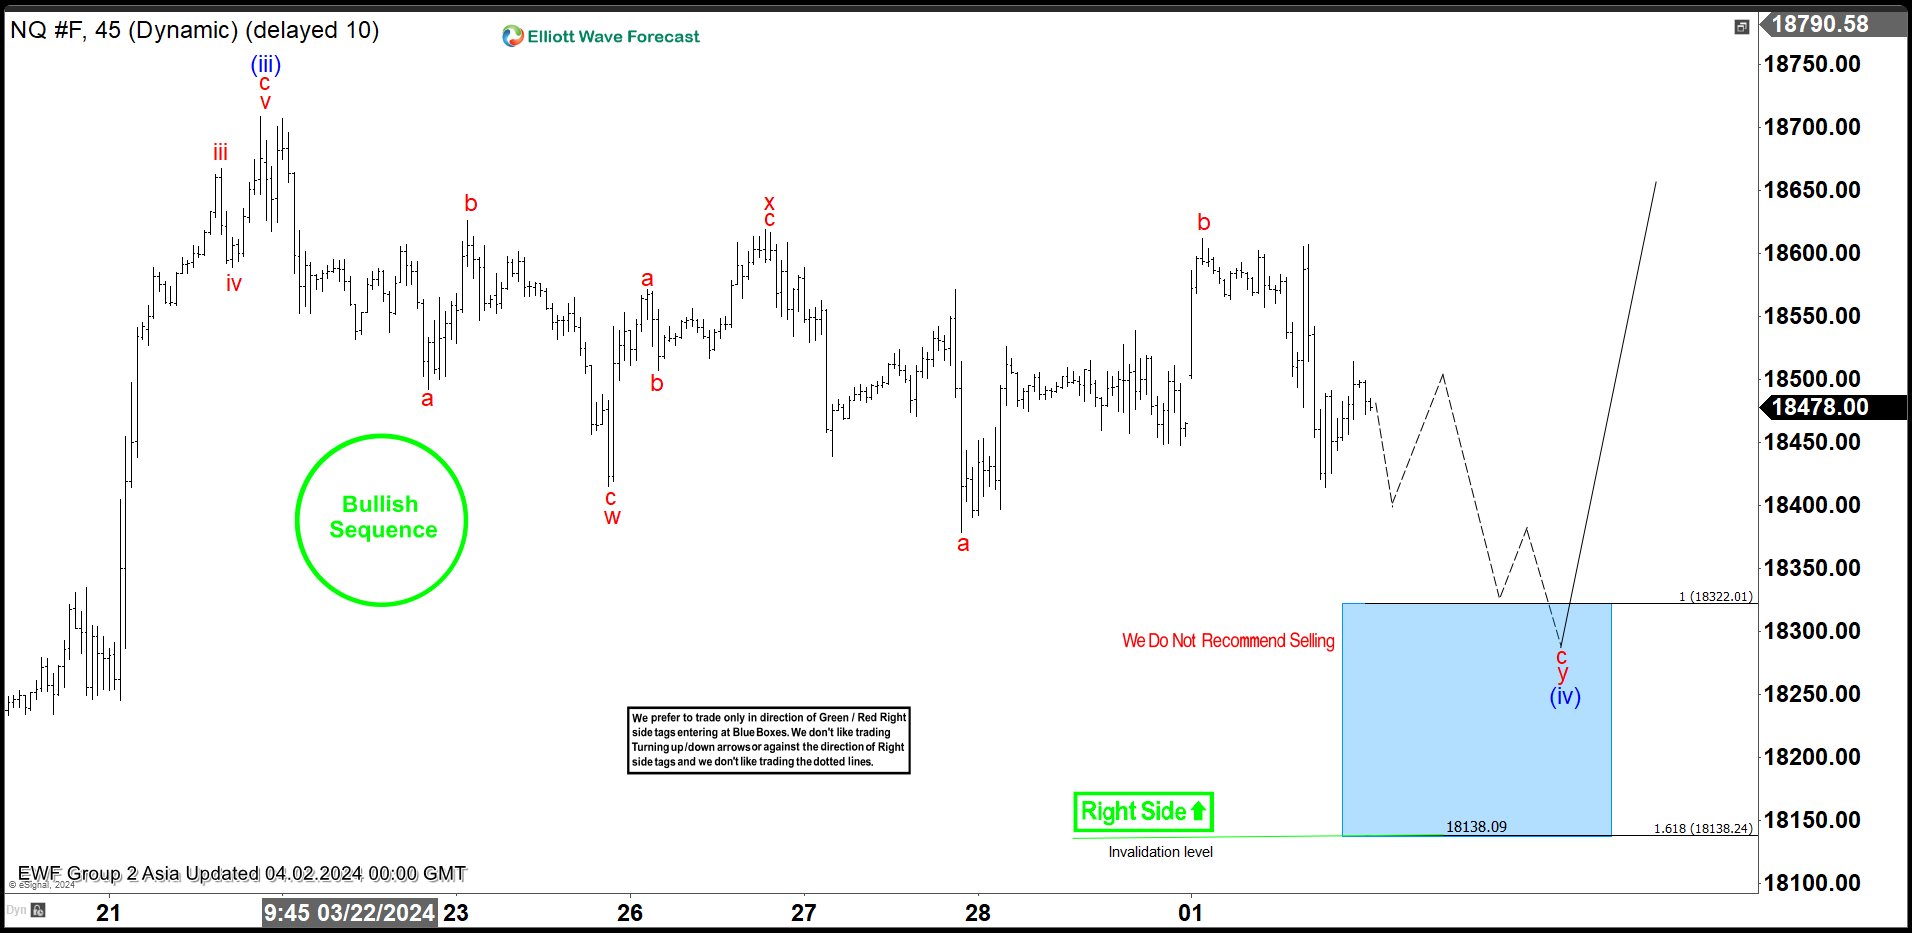
NASDAQ Elliott Wave 1 Hour Asia Chart 04.02.2024
The current view indicates that the intraday pullback is still in progress. We assume that the correction is unfolding as an Elliott Wave Double Three pattern with wxy red labeling. The price structure remains incomplete at the moment, suggesting further downside towards the 18322-18138.2 Blue Box Buying Zone. We don’t recommend selling NASDAQ; instead, we prefer positioning ourselves on the long side from the Blue Box area. Once NQ_F reaches our designated buying zone, we expect an influx of buyers, potentially resulting in a rally towards new highs or a 3-wave bounce.
Official trading strategy on How to trade 3, 7, or 11 swing and equal leg is explained in details in Educational Video, available for members viewing inside the membership area.
Quick reminder on how to trade our charts :
Red bearish stamp+ blue box = Selling Setup
Green bullish stamp+ blue box = Buying Setup
Charts with Black stamps are not tradable. 🚫
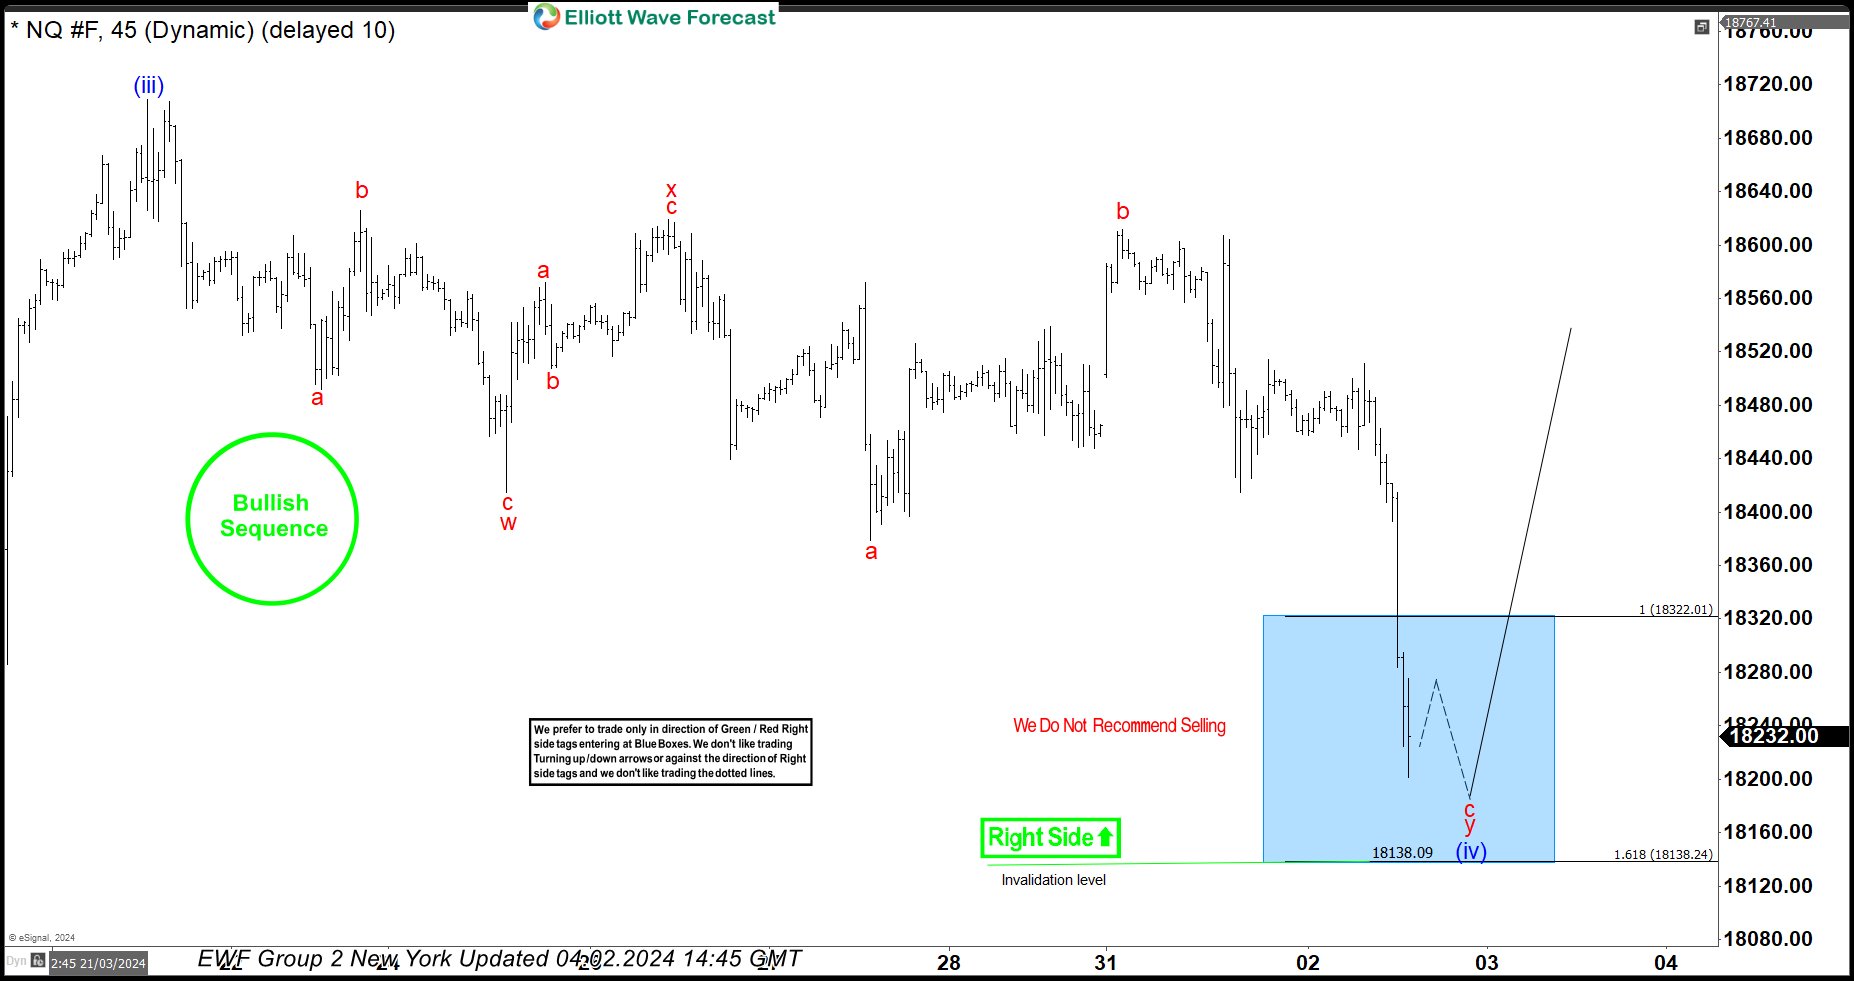
NASDAQ Elliott Wave 1 Hour Chart 04.02.2024
The futures have experienced a drop and have reached our buying zone, the Blue Box: 18322-18138.2. We are entering long positions within the Blue Box against the marked invalidation level. As the main trend is bullish, we expect to see at least a 3-wave bounce from the Blue Box. As soon as the price hits the 50 fibs against the x red connector, we will make positions risk-free and set stop loss at breakeven. A break below the 1.618 Fibonacci extension level, 18138.2, would invalidate the trade.
NASDAQ Elliott Wave 1 Hour Chart 04.02.2024
The NASDAQ futures has found buyers as expected and is showing a very good reaction from the Blue Box Area. We count the pullback (ii) blue completed at the 17828 low. Consequently, any long positions should now be risk-free. We are anticipating a break of the (iii) blue peak to confirm that the next leg up is in progress.
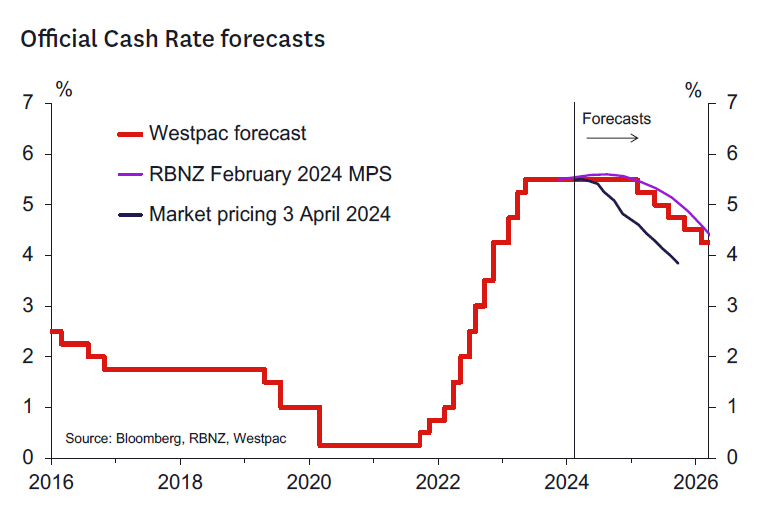
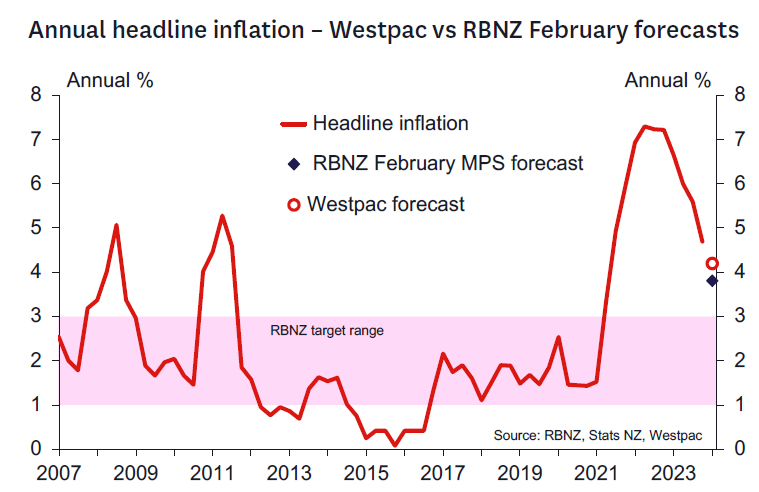
Preview of RBNZ: Nothing to See Here
- We expect the RBNZ will leave the OCR at 5.5% at its April policy review.
- We think the RBNZ will remain comfortable with the forward outlook communicated in the February Monetary Policy Statement.
- GDP growth was slightly weaker than expected – but the impact is very marginal compared to past quarterly forecast misses.
- The inflation outlook still looks challenging – the Q1 CPI seems likely to come in higher than the RBNZ expected back in February.
- Dairy prices are a bit weaker but the lower currency balances this.
- Market views of OCR easing as early as August are unlikely to find support.
RBNZ decision and associated communication.
The information flow has been very light since the February Monetary Policy Statement - hence we don't think the RBNZ's monetary policy stance will have changed much since February. We expect no change in the OCR, with the decision to be accompanied by a relatively short statement that suggests little change in the OCR outlook from that communicated in the February Statement. We expect the RBNZ will:
- Indicate a high level of comfort with the current 5.5% OCR.
- Note that recent economic developments have proceeded broadly as expected.
- Note the increased signs that global interest rates may be moving lower soon.
- But remain concerned about the current high level of inflation and the pace at which it will return to the midpoint of the 1-3% target range.
A more definitive view of the outlook should come in the May Statement when the Monetary Policy Committee (MPC) will have more information on the Government's fiscal stance and when new information from the Q1 CPI and labour market reports will be available. Both those reports will be of critical importance in determining if there is much need for the RBNZ to change its view that the OCR will remain unchanged until early/mid 2024. Markets have taken a more aggressive view on the timing and extent of OCR cuts in recent weeks. Our view is those expectations will be disappointed this time around.
Key developments since the February Monetary Policy Statement.
Relatively little data has come to light since the February Statement to disturb the RBNZ's view on the inflation outlook. The general tone of the data that will have made the RBNZ perhaps slightly more comfortable with the inflation outlook and will have reduced, at the margin, concerns that a further interest rate rise may be required. However, it's also the case that there is little to support the idea that interest ratees can be cut much earlier than the RBNZ previously assumed (early to mid-2025). Key developments have been:
- Slightly weaker Q4 2023 GDP and associated revisions. GDP growth in Q4 was slightly weaker than forecast (-0.1%q/q vs 0% forecast) and cumulative revisions mean that the economy was 0.2% smaller than forecast. This will likely reduce the RBNZ's starting point output gap very modestly.
- Stronger CPI inflation components – the RBNZ forecast a low 0.4% quarterly outcome for the Q1 CPI in its February Statement. By contrast, Westpac's forecast is for a 0.8% q/q outcome, with monthly indicators pointing to a larger lift in international airfares than the RBNZ likely assumed in its forecast. We also think that non-tradables prices will rise by more than the RBNZ has forecast.
- Higher Oil prices – Oil prices are around 7.5% higher than the level assumed for Q2 2024 in the February Statement (Dubai spot oil at USD 80.80) which will lift the RBNZ's near-term CPI forecasts, all else equal.
- Weaker dairy prices – three of the last four GDT auctions have seen weaker dairy prices and the key whole milk powder price is down almost 6% from the high's seen in February. The RBNZ will likely make some adjustment to their export price assumptions on these recent data.
- Weaker terms of trade in Q4 2023 – these data came in notably weaker than expectations, although in large part this reflect timing effects that will likely unwind in coming quarters.
- A lower NZD TWI – the TWI has fallen by around 2.5% since the February Statement and is now around 2% below the H124 level that had been assumed. The lower exchange rate probably broadly balances the impact of the weaker terms of trade and dairy prices on the economic and inflation outlook.
In addition to the softer than expected December quarter GDP, the RBNZ is also likely to acknowledge more recent signs that economic conditions are cooling, such as continued sluggish retail spending and the ongoing fall in consent issuance.
We don't expect the RBNZ will have reached a conclusion on the likely impact of fiscal policy on the outlook. While the fiscal outlook has deteriorated – reflecting both cyclical and structural factors – we expect the RBNZ will await full information from the Budget to determine whether fiscal policy will still exert sufficient downward pressure on growth and inflation over coming years.
Will NFP Report Take June Off the Rate-Cut Map?
- Investors have second thoughts about a Fed rate cut in June
- Dollar benefits from latest market repricing
- Spotlight turns to the NFP data on Friday at 12:30 GMT
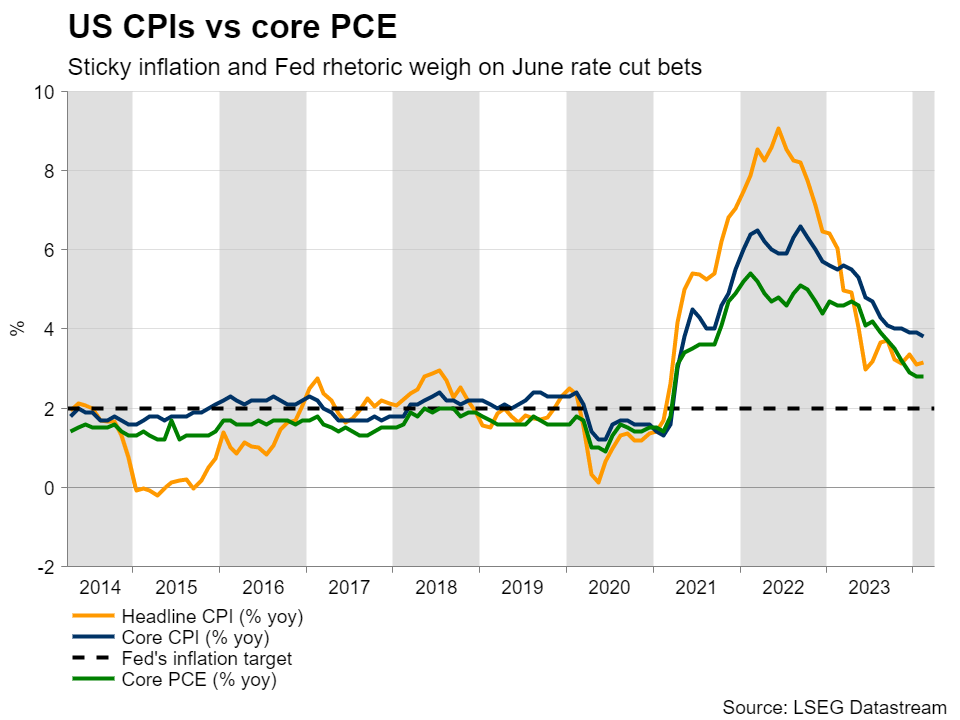
Data and Fed rhetoric weigh on Fed rate cut bets
At its latest gathering, the Fed appeared more dovish than expected, still pointing to three quarter-point rate cuts for 2024. This allowed market participants to add back to their June cut bets, lifting the probability for a 25bps reduction to around 80%.
However, this proved to be a temporary assessment. Last week, Fed Governor Waller said that the Committee is in no rush to start cutting interest rates, a view echoed by Fed Chair Powell on Friday, after the core PCE index came at 2.8% y/y, as it was expected.
This allowed dollar bulls to jump back into the action, adding to their positions on Monday after the ISM manufacturing PMI for March expanded for the first time since September 2022. The prices subindex rose to 55.8 from 52.5, corroborating the outlook painted by the S&P Global flash PMIs for the month, which revealed that selling prices rose at the fastest pace in just under a year.
Combined with the upward revision of the Atlanta Fed GDPNow model to 2.8% from 2.3% for Q1, the latest developments prompted investors to push back again their rate reduction bets According to Fed funds futures, the probability of a first quarter-point reduction in June has dropped to around 65%, while the total number of basis points worth of rate cuts by the end of the year has been decreased to 68.
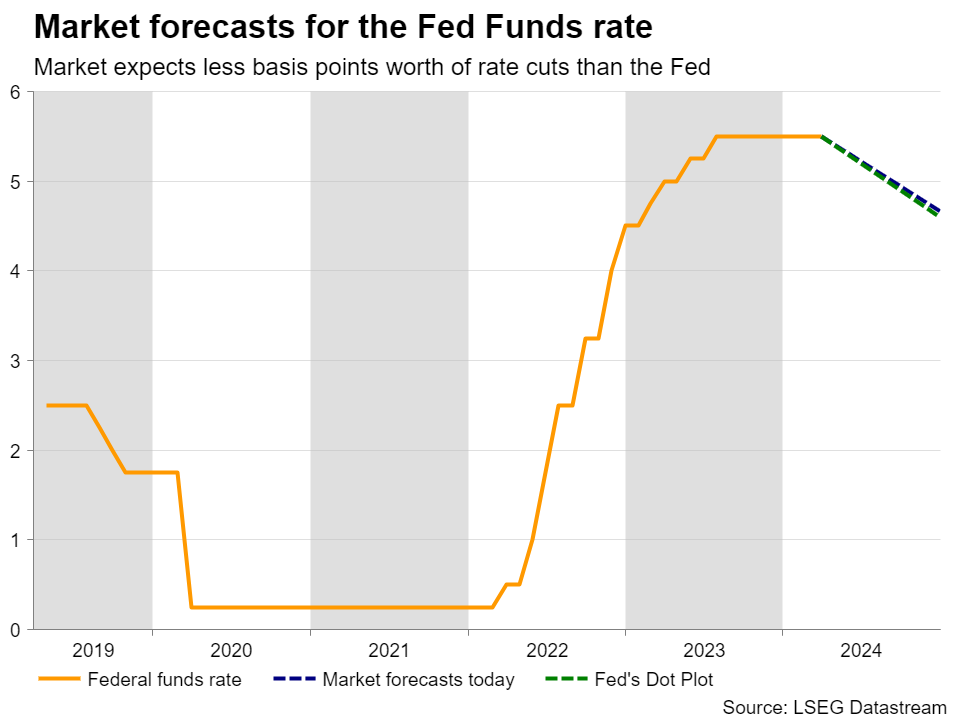
From anticipating around 160bs at the start of the year, the market is now expecting less reductions than the 75bps projected by the Fed itself, which adds downside risks to the dollar in case of disappointing data moving forward.
Will further easing in labor market ring the alarm bells?
With that in mind, the next major event on investors’ agenda may be Friday’s US employment report for March. The unemployment rate is expected to have held steady at 3.9% and nonfarm payrolls are forecast to have slowed to 205k from 275k. That said, the rebound in the employment subindex of the ISM manufacturing PMI tilts the risks to the upside. Average hourly earnings are expected to slow somewhat to 4.1% y/y from 4.3%.
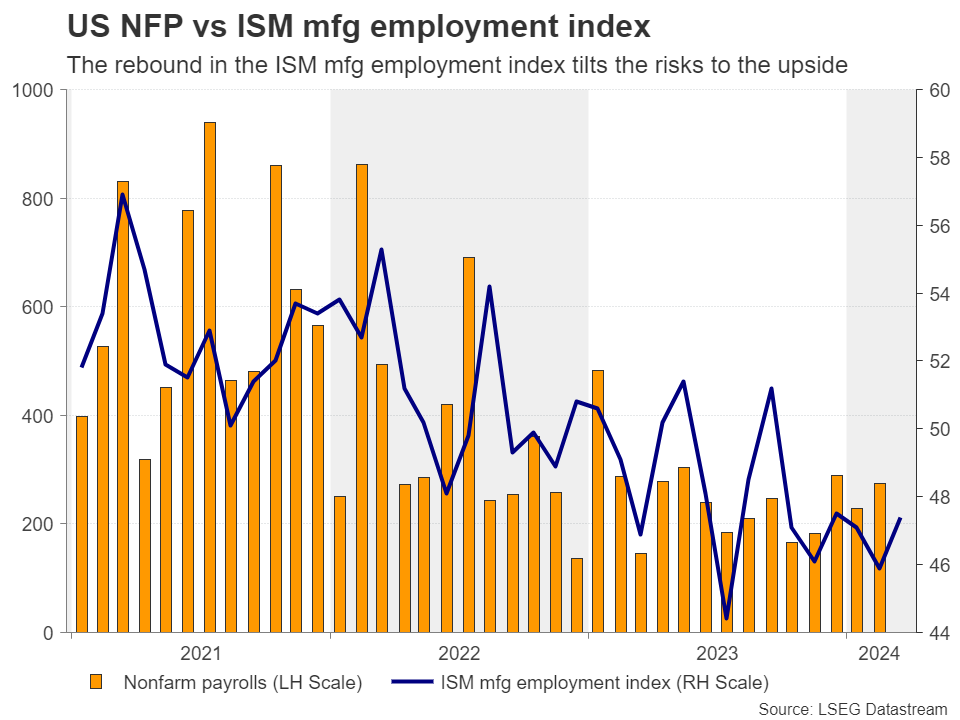
These numbers point to further easing in the labor market, but they are far from suggesting that a rate cut is urgent. After all another month of above 200k jobs is very encouraging for the economy, while a wage growth rate at around 4% is unlikely to help inflation come down faster than previously thought.
Dollar may continue to outperform the euro
The dollar is likely to stay the course north especially against the euro, as according to money markets, a June quarter-point reduction by the ECB is more than fully priced in, while following recent dovish remarks by ECB member Villeroy de Galhau and Stournaras, there is a nearly 20% chance for a cut at the upcoming meeting on April 11.
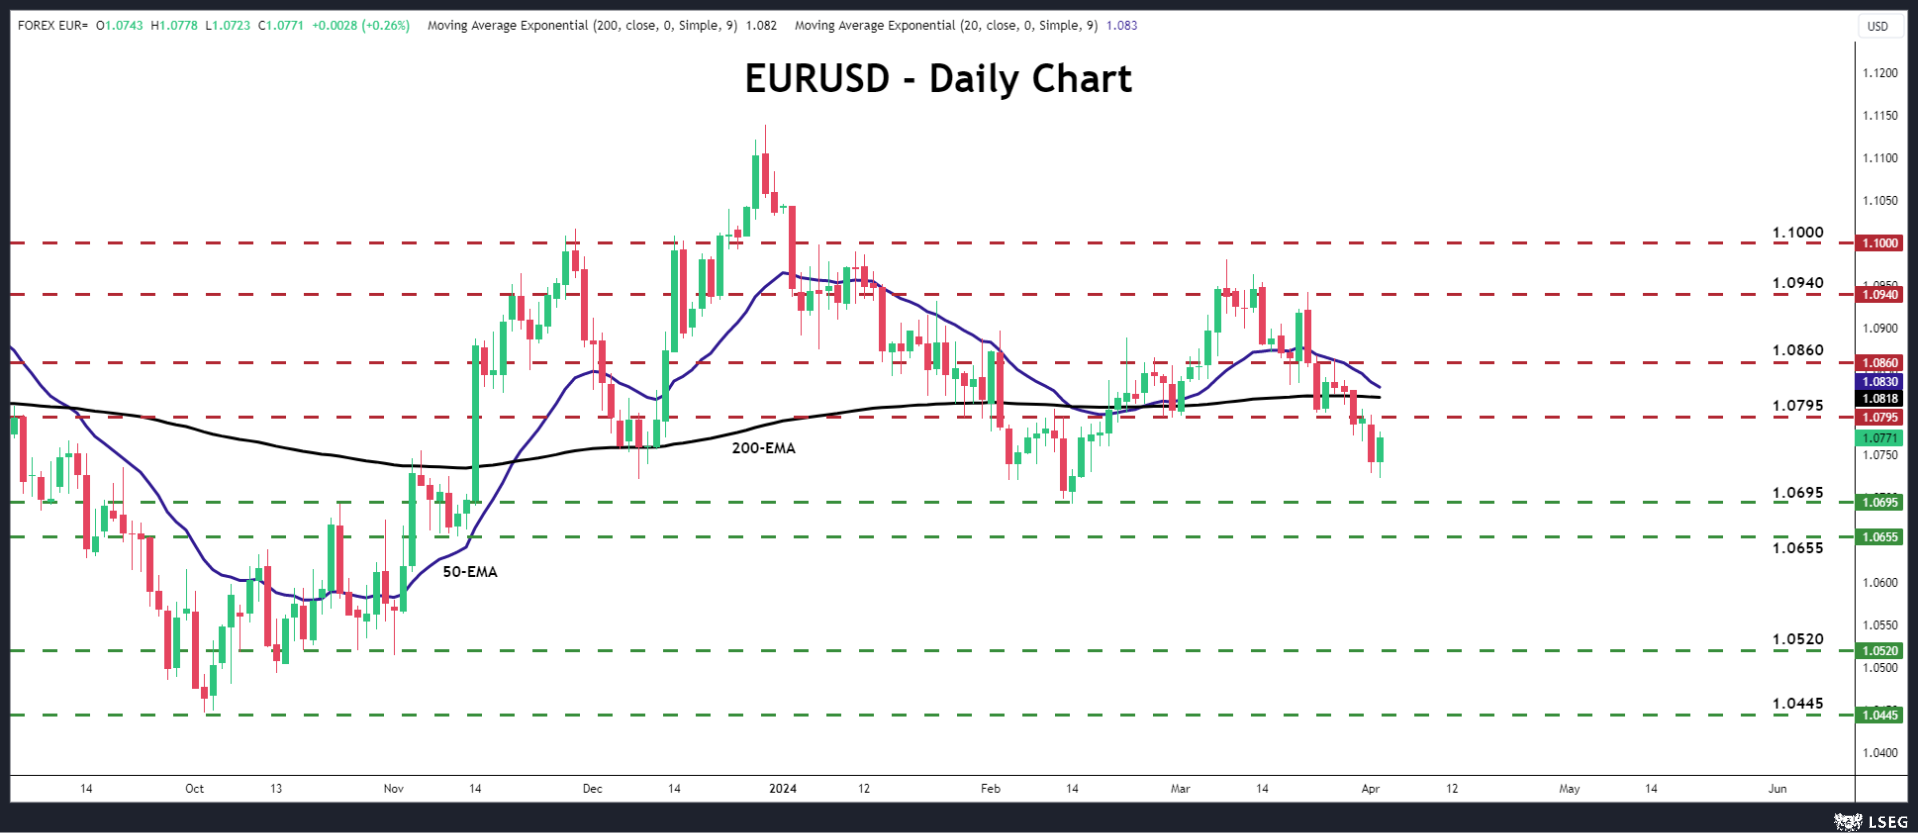
Euro/dollar fell below the key support zone of 1.0795 on Thursday and accelerated its slide this week, headed for the very important area between 1.0655 and 1.0695. A decisive dip below 1.0655 could carry larger bearish implications and perhaps pave the way towards the 1.0520 barrier, marked by the lows of October 26 and November 1.
Nonetheless, in case the jobs report disappoints, the pair may rebound and break back above 1.0795, but for the outlook to start looking brighter, a move all the way above the round number of 1.1000 may be needed.
Sunset Market Commentary
Markets:
EMU Flash March CPI ‘eased’ slightly more than expected from 2.6% Y/Y to 2.4% Y/Y. Core inflation (ex-energy) dropped from 3.1% to 2.9%, the first sub 3% reading since February 2022. Food price inflation slowed further from 3.9% to 2.7%. Energy inflation was still negative (-1.8% Y/Y), but the favorable comparison base is petering out. Industrial goods inflation also slowed further from 1.6% to 1.1%, but services inflation held stable at 4% for the fifth consecutive month. The 0.8% M/M pace at least suggests that (more than) confirmation is needed for (core) inflation to sustainably move to the 2%. A still favourable base effect in April might further reduce headline inflation and provide the ECB the ‘comfort’ that is needed to start with an inaugural 25 bps cut in June. However, as is currently the case in the US, the process might become more bumpy in late spring/early summer. In this respect, the 100 bps of cumulative rate cuts discounted till the end of this year, might still prove to be overly optimistic, especially if the Fed would be forced into less that than three rate cuts envisaged in the March dots. German yields hardly reacted. A tentative correction on yesterday’s sharp rise didn’t go far. German yields currently even add an additional 2 (30-y) to 4 bps (2-y). In the US, ADP private job growth served as a starter before the Services ISM and Fed chair Powell’s speech later today. With a 184k monthly job growth, the labour market still shows no signs of any material deterioration which Powell at the March press conference suggested could serve as a reason for the Fed to consider a pre-emptive rate cut. US yields also gain another 5-7 bps across the curve post ADP. The 2-y yield (4.73%) still trades marginally below the YTD top (4.75%). Longer maturities are forcing the technical break higher (10-y 4.42%, vs 4.35% previous top). US equities (S&P 500 -0.1%) still manage to limit the damage after yesterday’s correction. Brent oil is closing in on the $90/b barrier, adding to inflationary risks.
On FX markets, the dollar (for now) fails to profit for solid US data and higher yields. DXY even loses marginally (104.79). EUR/USD also gains a few ticks (1.078). USD/JPY is the exception to the rule with the pair (151.9) only a whisker away from the 152 area that is rumored to be the line in the sand for the Japanese authorities.
At the time of finishing this report, the US services ISM printed softer than expected with the headline index easing from 52.6 to 51.4. Also price pressures eased substantially from 58.6 to 53.4. Employment improved slightly but remains in contraction territory. (US) yields return a few bps, but the correction remains modest as markets are counting down Fed’s Powell’s speech at the Stanford Business, Government and Society Forum later today.
News & Views:
Hungarian debt agency AKK yesterday published a modification of its funding plan in line with a higher net financing need (HUF 3982bn) from the government. AKK’s total gross issuance need is raised by HUF 1376bn to HUF 11648bn. 39% of this modified plan was completed in Q1. The main changes are a higher HUF institutional issuance intention (+HUF 609bn to HUF 2372bn), more T-bill issuance (EoY stock + HUF 649bn to HUF 1573bn), less HUF retail issuance (-HUF 223bn to HUF 4064bn) and slightly more planned FX financing (+HUF 222bn to HUF 2619bn). The upward revision of the latter is mainly because of stronger demand at January USD and EUR auctions, allowing the debt agency to print €1bn more than planned in December. It suggest that smaller Samurai (JPY) or Panda (CNY) bonds can be expected in H2 2024 with AKK ruling out tapping the USD and EUR markets for the rest of the year. FX project loans (eg EIB) and other types of FX financing (eg private placements) are still a possibility.
The US Energy Department cancelled plans to buy oil for the Strategic Petroleum Reserve amid rising prices. They “keep the taxpayer’s interest at the forefront” and forfeit on purchasing as many as 3 million barrels of oil. The Energy Department is gradually refilling reserves after releasing some 180mn barrels in the wake of the Russian invasion. The currently hold around 363mn barrels compared from almost 600mn at the start of 2022. They will continue to monitor market dynamics with the aim of lifting SPR
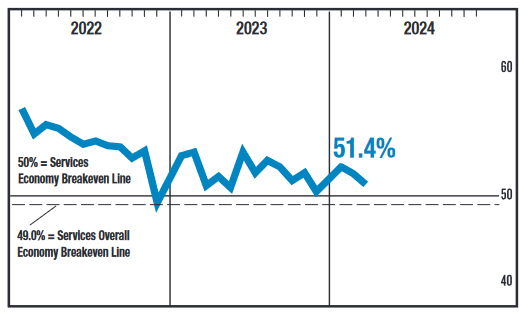
US ISM services falls to 51.4, prices down sharply to 53.4
US ISM Services PMI fell from 52.6 to 51.4 in March, below expectation of 52.8. Business activity/production ticked up from 57.2 to 57.4. New orders fell from 56.1 to 54.4. Employment rose slightly from 48.0 to 48.5. Prices fell sharply from 58.6 to 53.4.
ISM said: "The past relationship between the Services PMI and the overall economy indicates that the Services PMI for March (51.4 percent) corresponds to a 0.8-percent increase in real gross domestic product (GDP) on an annualized basis."
Fed’s Bostic eyes first rate cut in Q4, citing sluggish inflation decline
In a CNBC interview today, Atlanta Fed President suggested that rate cuts could be on the horizon by the end of 2024, contingent on the economy's performance. Bostic outlined a scenario where "continued robustness in GDP, unemployment, and a slow decline of inflation through the course of the year" could warrant a policy adjustment in the fourth quarter.
He also acknowledged the persistence of inflationary pressure into the current year, "hasn't moved very much relative to" levels observed at the end of 2023. "There are some secondary measures in the inflation numbers that have gotten me a bit concerned that things may move even slower," he warned.
"Those are much higher now than they were before and they're starting to trend back to what we saw in the high inflation period," Bostic added. "They're moving away from what we'd like to see. So I've got to make sure that those aren't hiding some extra upward pressure and pricing pressure before I'm going to want to move our policy rate."