Sample Category Title
US Stock Market Awaits the Publication of NFP And Unemployment Data
Important events of this week for investors and traders in the US stock market could be the employment news, which will be published tomorrow at 15:30 GMT+3:
→ non-Farm Payrolls (NFP) report for March. According to CNN, analysts expect nonfarm payrolls to rise by 192,500 in March. NFP for February was 275,000, according to FactSet.
→ data on the unemployment rate (Unemployment Rate). According to ForexFactory, the unemployment rate is expected to remain unchanged at 3.9%.
The state of the labour market is under close scrutiny by the Fed and could provide valuable insight into the prospects for interest rate cuts. The release of the unemployment rate and NFP numbers for March could be an example of what is called "bad news is good news" on Wall Street. After all, if the data shows a deterioration in the labour market, then this will be an argument for the Fed to lower interest rates, which in turn could lead to an increase in the stock market.
Indeed, according to CNN, Fed Chairman Jerome Powell said last week that a weakening labour market would be a reason to cut interest rates.
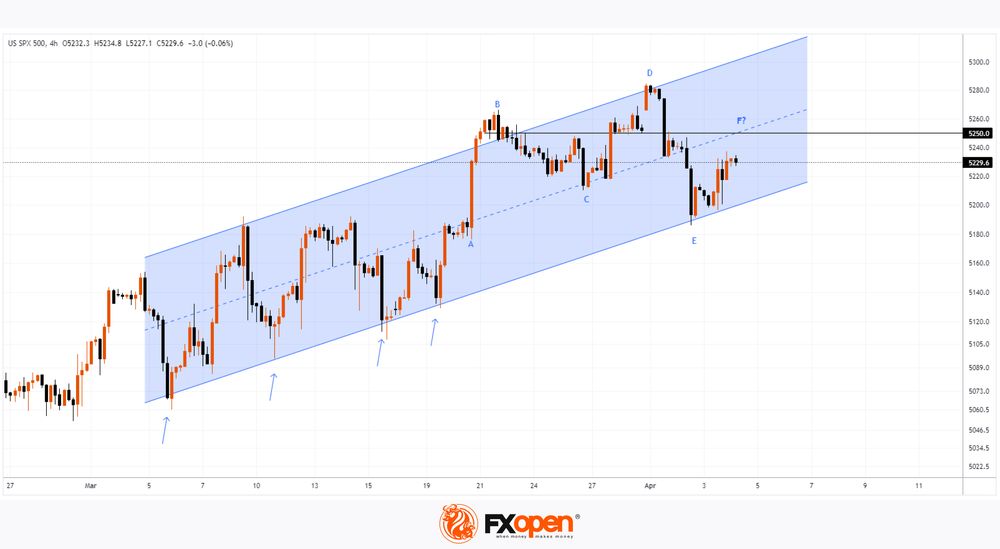
However, the S&P 500 chart shows the price moving within an ascending channel, but showing signs of weakness around the 5,250 level on the 4-hour period:
After a sharp increase in A→B, the price entered a prolonged correction B→C - this may be a sign of a large volume of sell orders near the level of 5,250, which absorbed the bullish impulse A→B.
An attempt to break through the level of 5,250 (price growth to top D) turned out to be a failure, as the price sharply dropped from the upper border of the channel to the lower one. Such progress should be alarming for the bears.
From the point of view of technical analysis of the S&P 500, on the eve of the publication of the NFP report, the price forms a rebound from the lower border of the channel. But by its nature, the rebound does not look dynamic compared to the previous ones (shown by arrows) — the price’s action shows that this time it needs time to approach the median line.
The above arguments provide the basis for the assumption that the publication of the unemployment rate and the NFP report for March can become drivers of price movement, at which it will form an F top.
Wherein:
→ the tops of B-D-F can form a bearish head and shoulders pattern;
→ the median line of the ascending channel and the level of 5,250 will act as resistance for the bulls.
Trade global index CFDs with zero commission and tight spreads. Open your FXOpen account now or learn more about trading index CFDs with FXOpen.
This article represents the opinion of the Companies operating under the FXOpen brand only. It is not to be construed as an offer, solicitation, or recommendation with respect to products and services provided by the Companies operating under the FXOpen brand, nor is it to be considered financial advice.
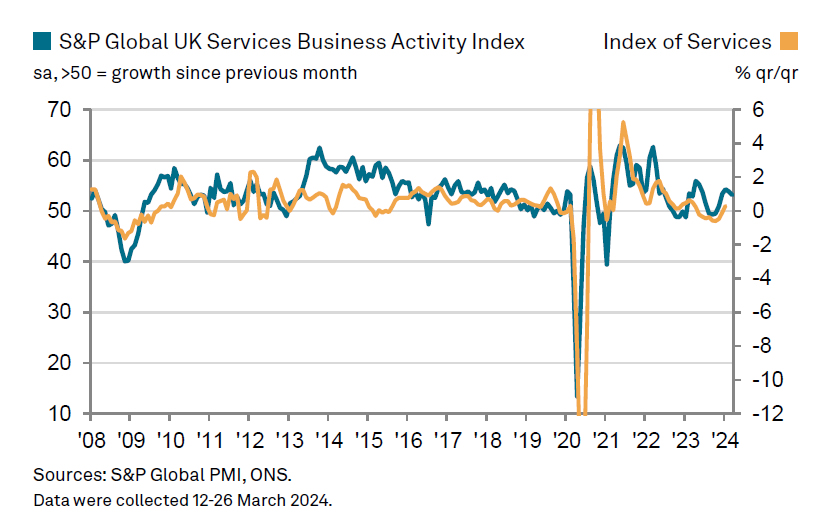
UK PMI Services finalized at 53.1, inflation pressures persist
UK PMI Services was finalized at 53.1 in March, down from February's 53.8. PMI Composite was finalized at 52.8, down from prior month's 53.0.
Tim Moore, Economics Director at S&P Global Market Intelligence, said, "The solid growth rate achieved in March reinforces the view that a rebound in service sector performance is helping the UK economy to pull out of last year's shallow recession."
Meanwhile, Input prices have continued to rise sharply, with inflation rates only slightly below their six-month average. The primary factors contributing to the uptick in input costs include higher salary payments and increased transportation bills.
The rate at which prices charged by service providers have increased slowed to its lowest point since September 2023. Despite this deceleration, the index remains well above its long-term trend, signaling enduring inflationary pressures within the UK's domestic economy.
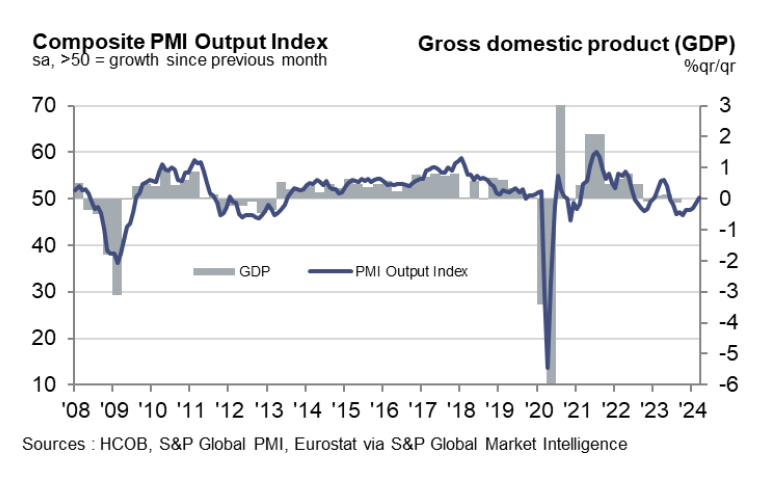
Eurozone PMI services finalized at 51.5, gradually finding its footing
Eurozone PMI Services was finalized at 51.5 in March, up from February's 50.2, a 9-month high. PMI Composite was finalized at 50.3, up from prior month's 49.2, a 10-month high.
Cyrus de la Rubia, Chief Economist at Hamburg Commercial Bank, said the service sector is "gradually finding its footing." He further highlighted the importance of wage growth outpacing inflation, enhancing households' purchasing power and supporting the service sector's revival. However, he tempered expectations by noting, "a full-fledged boom is not on the horizon."
Despite economic challenges, service providers have continued to expand their workforce. Moreover, business expectations within the service industry have soared to their highest in over two years, surpassing the long-term average.
Meanwhile, March witnessed a slight deceleration in inflation regarding both costs and sales prices, a development likely to be viewed favorably by ECB. Despite this positive sign, de la Rubia cautioned against premature conclusions about a turning trend in inflation, maintaining the forecast that interest rate cuts are more likely in June than in April.
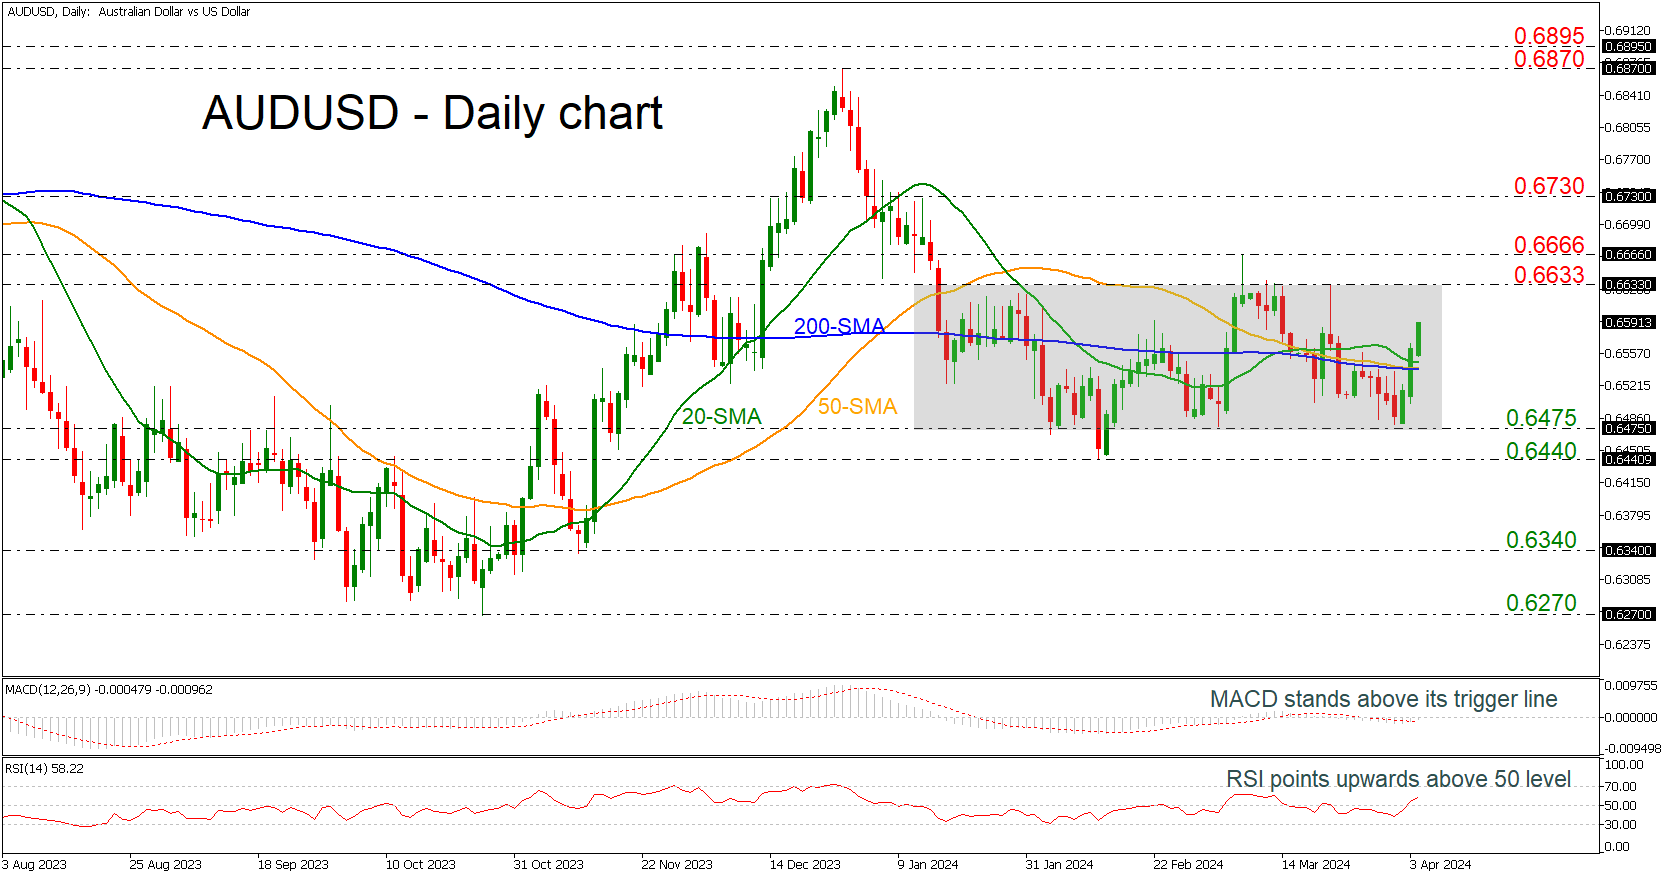
AUDUSD Continues the Bounce Off 0.6475 Mark
- AUDUSD holds within trading range
- Prices rise above SMAs
- RSI indicates more gains
AUDUSD is surging after the rebound off the 0.6475 support level, surpassing the simple moving averages (SMAs) and extending its move towards the 0.6633 barrier, which is acting as the upper boundary of a short-term sideways channel.
According to technical oscillators, the MACD is holding marginally above its trigger line and near the zero level with weak momentum, while the RSI is pointing upwards, crossing above its neutral threshold of 50.
If buying interest persists and the market jumps above the strong 0.6633 resistance, the pair could touch the 0.6666 barrier, taken from the bullish spike from March 8. Above this level, the price could move towards the 0.6730 resistance and any movements higher could brighten the outlook.
On the other hand, a decline below the SMAs could drive the price until the lower boundary of the range at 0.6475 and the 0.6440 support. Steeper declines could endorse the longer-term bearish outlook at 0.6340.
In a nutshell, AUDUSD has been developing within a consolidation area of 0.6475-0.6633 over the last three months, lacking a clear direction in the short-term.
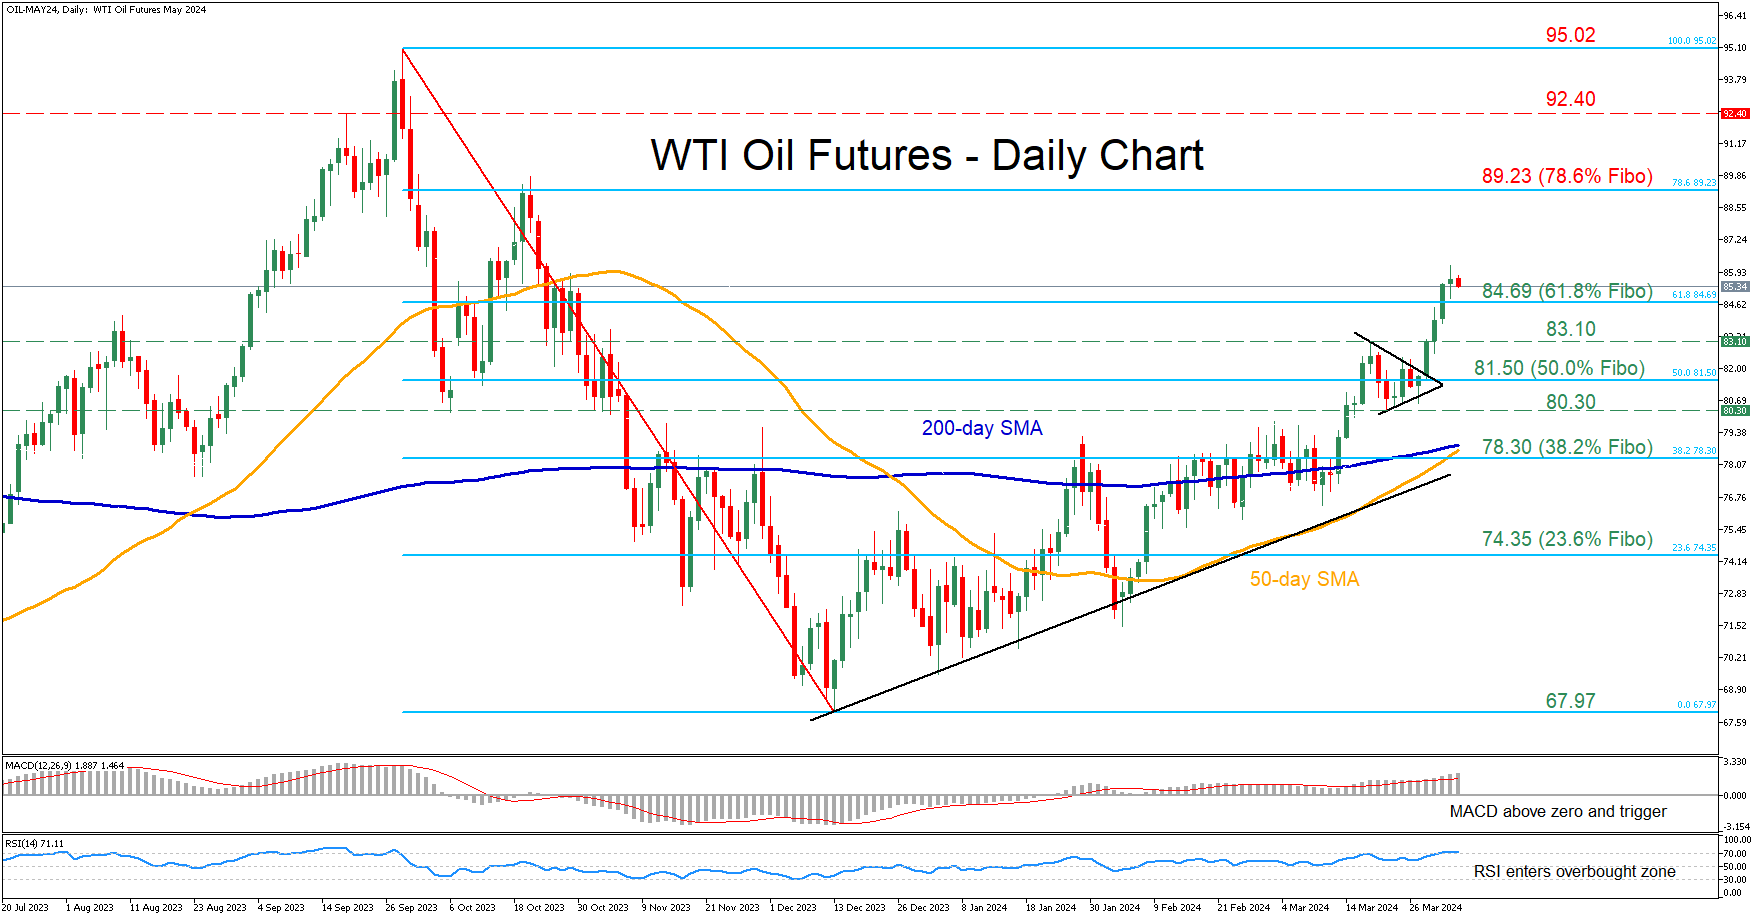
WTI Futures Surge to a 5-month High
- WTI futures in a steady advance since early December
- Posted a fresh 5-month peak before paring some gains
- Oscillators point to overbought conditions
WTI oil futures (May delivery) have been in a slow but constant recovery from their December bottom of 67.97, posting a fresh five-month peak of 86.20 on Wednesday. Meanwhile, the 50-day simple moving average (SMA) is positively closing the gap with the 200-day SMA, where an upside violation could ignite more gains.Should the advance resume, there is no prominent resistance until 89.23, which is the 78.6% Fibonacci retracement of the 95.02-67.97 downleg and a region that acted as resistance in October 2023. Jumping above that zone, the price may challenge the October 2023 resistance of 92.40. Even higher, the 2023 peak of 95.02 might prevent further advances.
Alternatively, bearish actions could send the price lower to test the 61.8% Fibo of 84.69. A violation of that region could pave the way for the March resistance of 83.10 ahead of the 50.0% Fibo of 81.50. Further retreats could then come to a halt at the March support of 80.30.
In brief, WTI futures’ rebound accelerated following the breakout move from the pennant structure in late March, resulting in consecutive fresh five-month peaks. However, the risk of a pullback is growing given that technical indicators are warning of an overstretched advance.
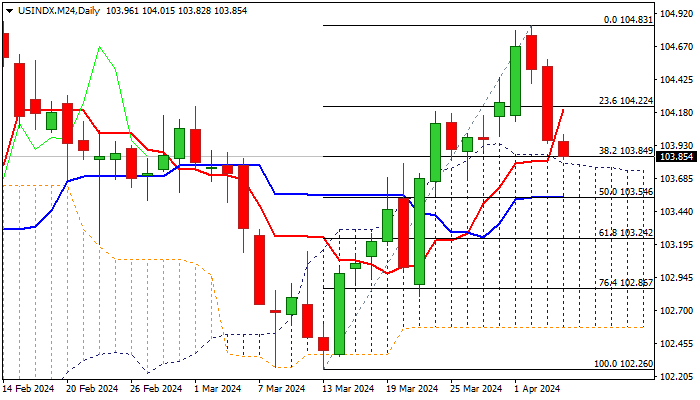
Dollar Index: Remains at the Back Foot Ahead of Key US Data
The dollar index remains in red for the third straight day and extend pullback from new multi-week high (104.83).
Fresh bears pressure pivotal supports at 103.84/80 (Fibo 38.2% of 102.26/104.83 / top of thick daily Ichimoku cloud), with more obstacles seen at 103.60/40 zone (converging 20/55/200DMA’s / 50% retracement).
Firm break of these supports would further weaken near term structure and risk deeper drop. Conversely, ability to hold above these levels would point to a healthy correction and keep near-term bias with bulls.
Daily studies are still in a predominantly bullish mode, however, south heading 14-d momentum warns of existing downside risk if the indicator breaks into negative territory.
Traders await the release of remaining reports from US labor sector (weekly jobless claims today and NFP on Friday) which will complete the picture of the condition in the sector in March and provide more evidence for the Fed, as bets for the first rate cut in June remain high.
On the other hand, the latest remarks from Fed Chair Powell partially cooled the expectations, as he reiterated the stance that policymakers will be guided by economic data.
Res: 104.01; 104.20; 104.57; 104.83.
Sup: 103.80; 103.50; 103.24; 103.00.
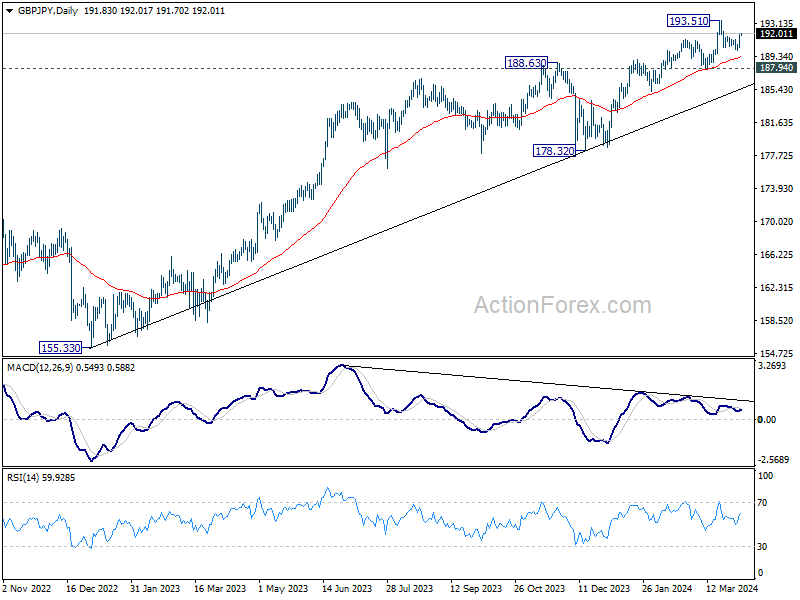
GBP/JPY Daily Outlook
Daily Pivots: (S1) 190.93; (P) 191.44; (R1) 192.45; More.....
Break of 191.65 minor resistance suggests that GBP/JPY's pullback from 193.51 has completed at 190.02 already. Intraday bias is back on the upside for retesting 193.51 first. Firm break there will resume larger up trend. For now, further rally is expected as long as 190.02 support holds, in case of retreat.
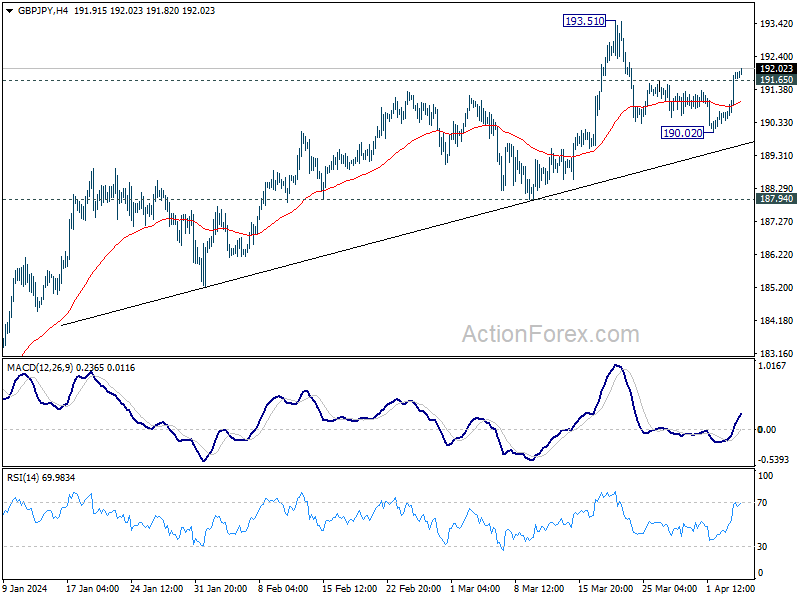
In the bigger picture, current rally is part of the up trend from 123.94 (2020 low), and is in progress for long term resistance (2015 high). Break of 187.94 support is needed to be the first sign of medium term topping. Otherwise, outlook will remain bullish in case of retreat.
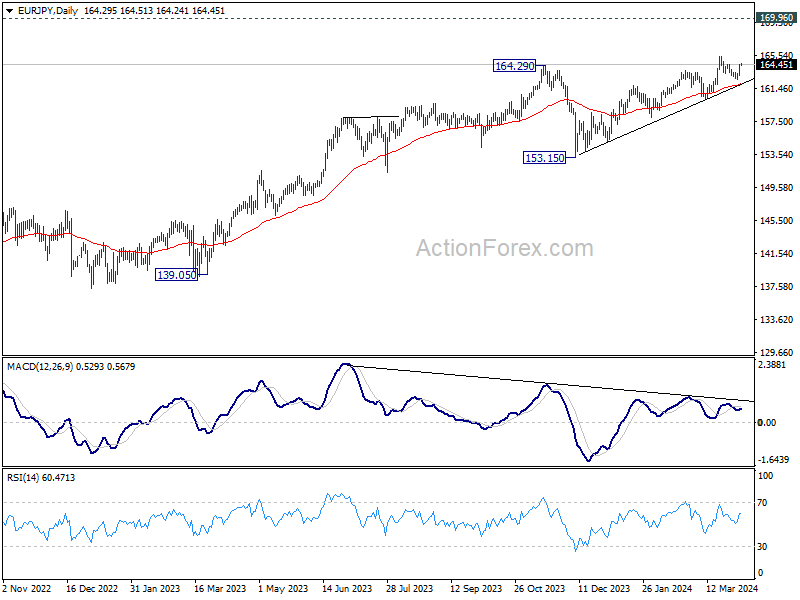
EUR/JPY Daily Outlook
Daily Pivots: (S1) 163.51; (P) 163.96; (R1) 164.85; More...
Breach of 164.40 resistance argues that EUR/JPY's pull back from 165.33 has completed at 162.59 already. Intraday bias is back on the upside for retesting 165.33. Firm break there will resume larger up trend. For now, further rally will remain in favor as long as 162.59 support holds, in case of retreat.
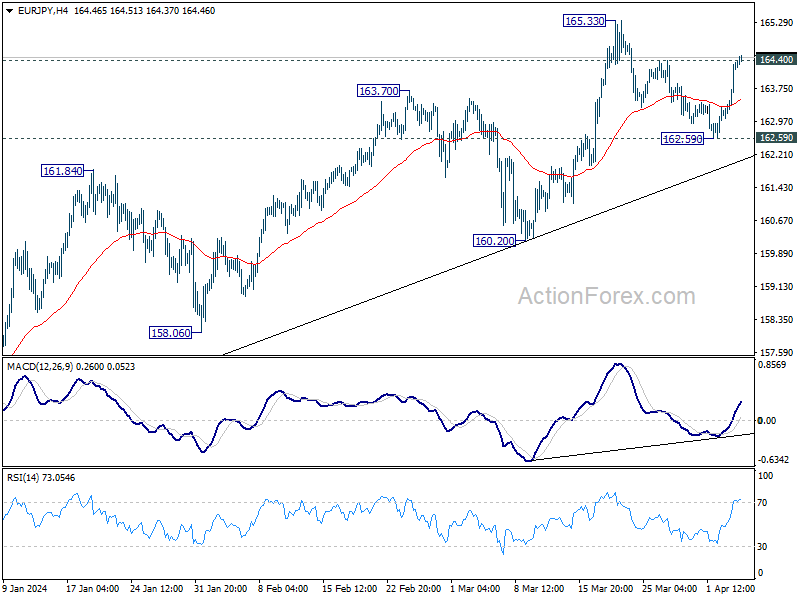
In the bigger picture, current rally is part of the up trend from 114.42 (2020 low), which is still in progress. Next target is 169.96 (2008 high). Break of 160.20 support is needed to be the first sign of medium term topping. Otherwise, outlook will stay bullish in case of retreat.
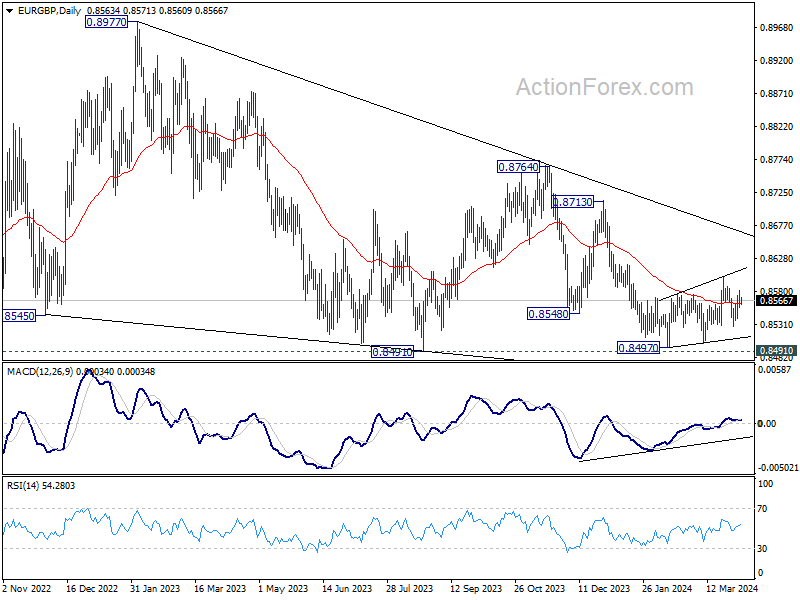
EUR/GBP Daily Outlook
Daily Pivots: (S1) 0.8553; (P) 0.8568; (R1) 0.8579; More...
Intraday bias in EUR/GBP remains neutral at this point. On the downside, firm break of 0.8529 support will argue that the corrective recovery from 0.8497 has completed at 0.8601. Intraday bias will be back on the downside for retesting 0.8497 low next. On the upside, break of 0.8601 will resume the rebound instead.
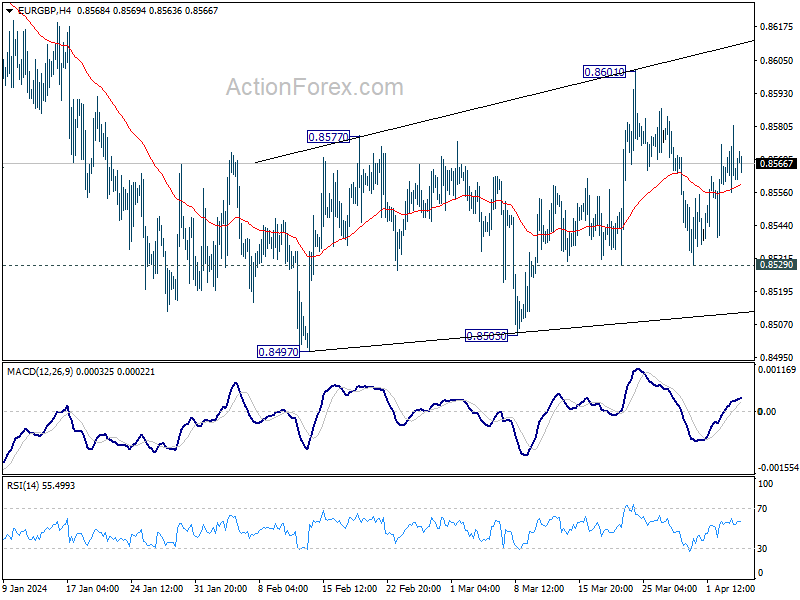
In the bigger picture, there is no clear sign that down trend from 0.9267 has completed, despite loss of downside momentum as seen in D MACD. As long as 0.8713 resistance holds, the down trend will remain in favor to resume through 0.8491 low at la later stage.
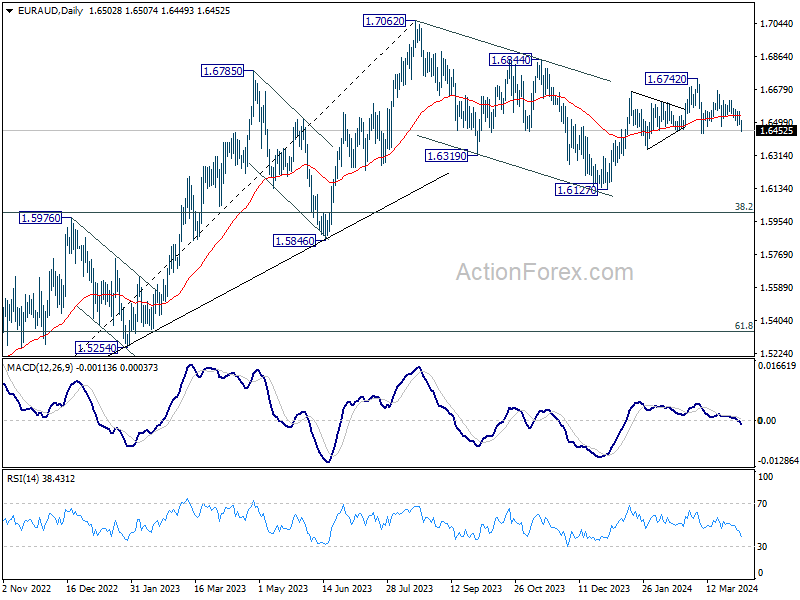
EUR/AUD Daily Outlook
Daily Pivots: (S1) 1.6474; (P) 1.6519; (R1) 1.6548; More..
Immediate focus is now on 1.6439 support in EUR/AD with current fall. Firm break there will argue that whole rebound from 1.6127 has completed, and turn near term outlook bearish for this support again. Nevertheless, strong rebound from current level, followed by break of 1.6561 minor resistance, will turn bias back to the upside for retesting 1.6742.
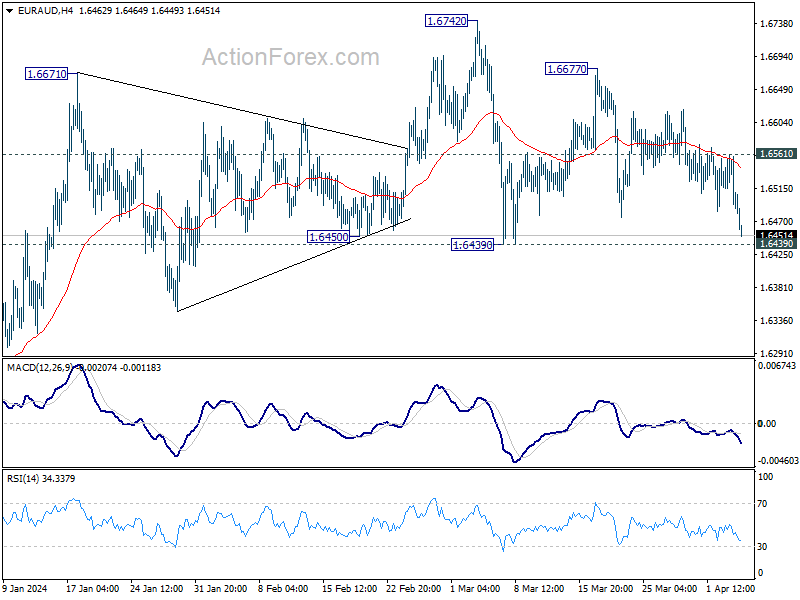
In the bigger picture, fall from 1.7062 medium term top is seen as a correction to the up trend from 1.4281 (2022 low). Break of 1.6844 resistance will argue that this up trend is ready to resume through 1.7062 high. In case of another fall, strong support should be seen around 1.5846 and 38.2% retracement of 1.4281 to 1.7062 at 1.6000 to bring rebound.