Sample Category Title
USDJPY Hovers Beneath 152 Ceiling as Bulls Refuse to Give Up
- USDJPY remains stuck within 151-152 range
- Neutral trend looks safe for now
- But strong support keeps bullish forces alive
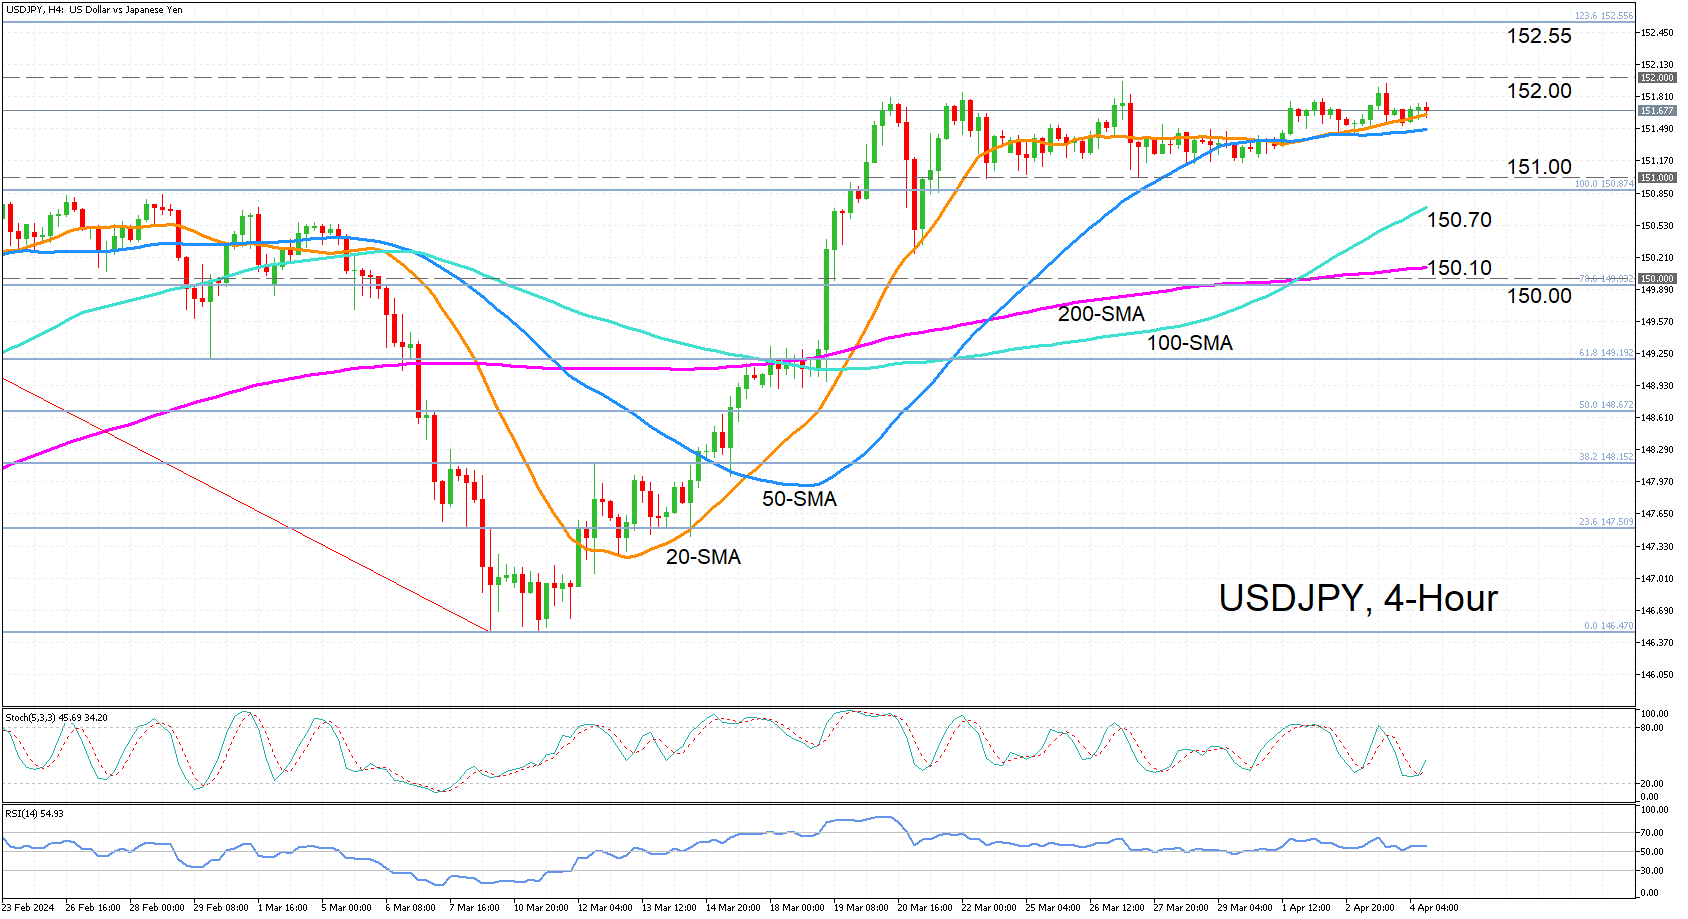
USDJPY has been gradually inching higher after dropping near the floor of the sideway range at the end of March to briefly touch 151.01. Prices made it all the way to 151.94 on Wednesday before easing again.
However, with both the 20- and 50-day simple moving averages (SMA) lurking below the price action, there is still a possibility of a fresh attempt to break above the 152.00 ceiling in the near term. Looking at the momentum indicators, the stochastic oscillator is sending positive signals in the four-hour chart, as the %K line has crossed above the %D line. The RSI is somewhat more neutral as it remains flat, but it managed to hold above the 50 level after the latest dip.
Should the positive momentum gather more traction, the bulls will likely again target the 152.00 handle. A successful break above it would bring the 123.6% Fibonacci extension of the early February-March downleg at 152.55 into view. Further gains would turn attention to the 161.8% Fibonacci of 153.60.
However, if the bears manage to defend the 152.00 level in the coming days, a sharp pullback would become inevitable. The 151.00 floor would become the first major test in the negative scenario, with the 100-day SMA offering further support at 150.70, after which the 200-day SMA would come into scope at 150.10. A drop below the psychologically important level of 150.00 would shift the short-term risk to the downside.
In brief, USDJPY still stands a chance of hitting fresh 34-year highs. But the longer it lingers within its current sideways range without breaching the upper bound, the more likely that it will reverse lower at some point.
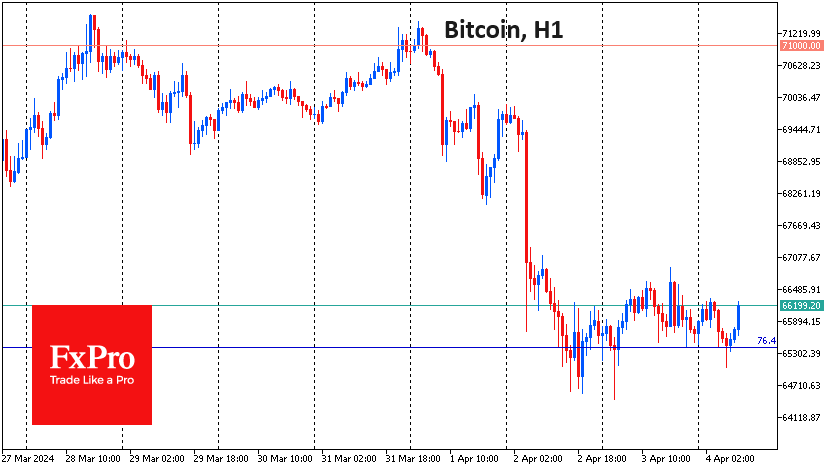
BTCUSD Pauses Pullback But Still Under Pressure
- BTCUSD halts its retreat and recoups some losses
- But momentum indicators remain tilted to the downside
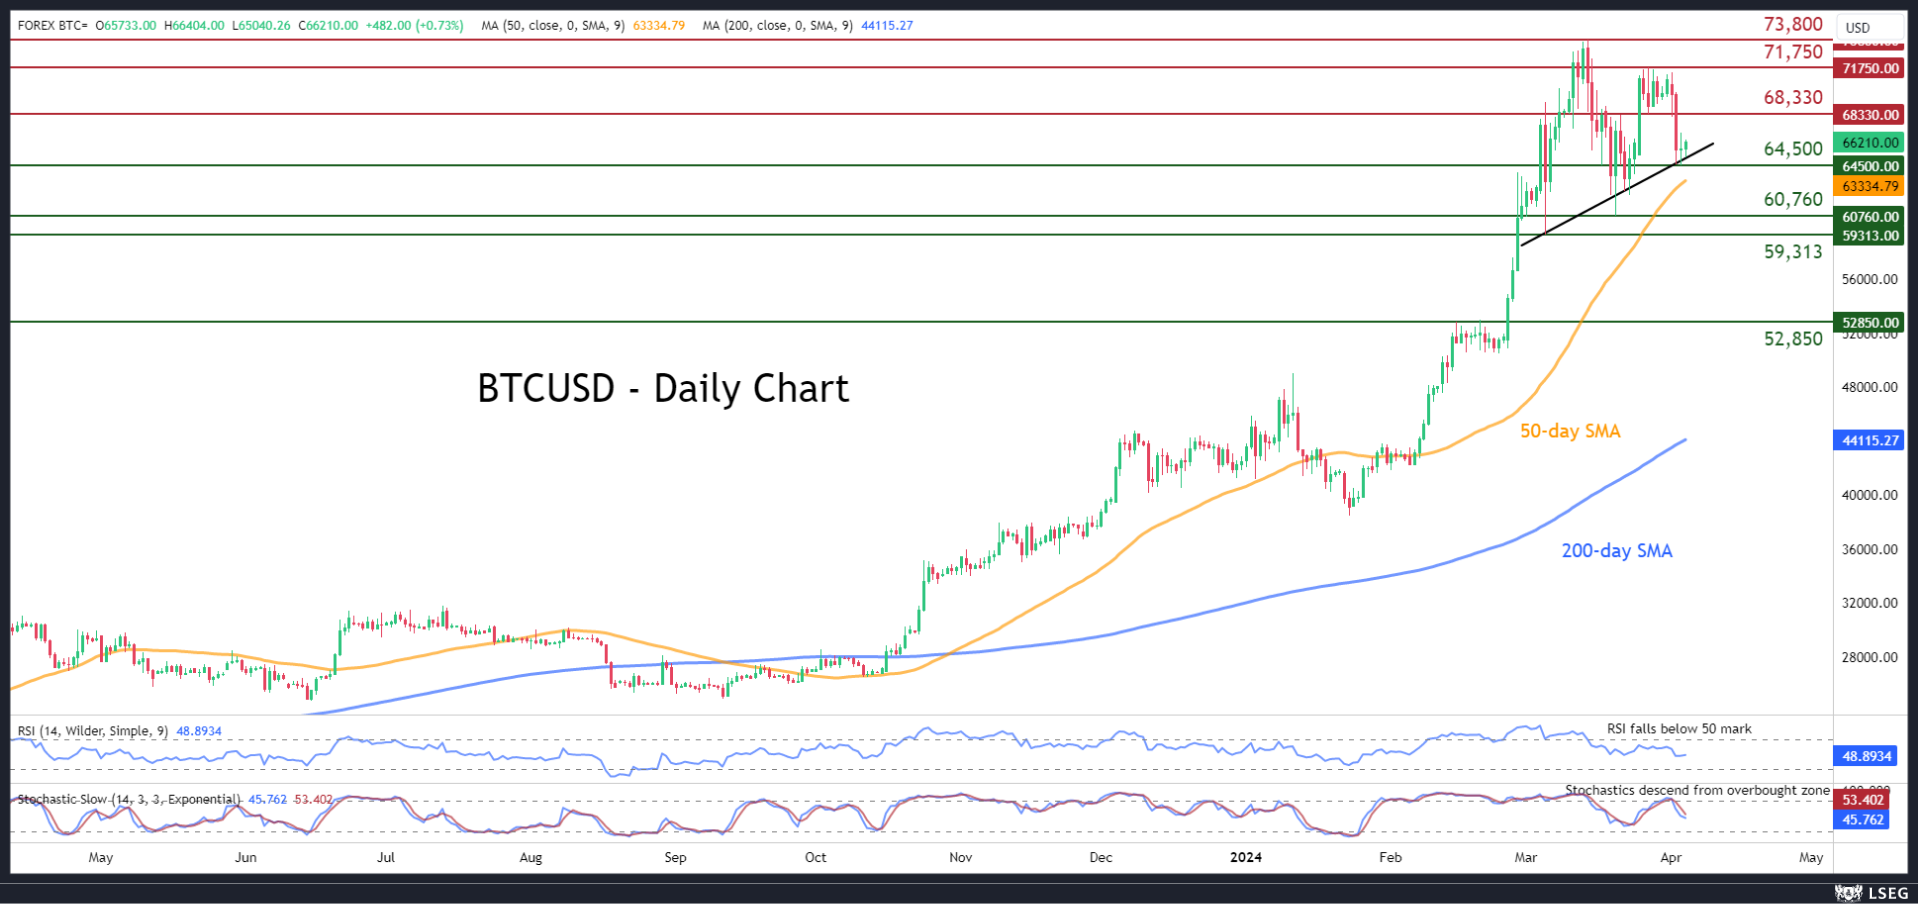
BTCUSD (Bitcoin) experienced a strong pullback following its repeated inability to conquer the 71,750 hurdle. Although the price seems to be finding its footing in the last couple of sessions supported by a short-term ascending trendline, near-term risks remain tilted to the downside.
If bearish pressures persist, Bitcoin could revisit its recent support of 64,500. Further declines could then cease at the March deflection point of 60,760. Even lower, the March bottom of 59,313 may act as the next line of defence.
Alternatively, should the price move higher after its recent bounce, the March support of 68,300 could serve as initial resistance. A break above that region could pave the way for the March resistance region of 71,750. Failing to halt there, the price may ascend to retest its all-time high of 73,800.
In brief, BTCUSD appears to have put an end to its latest slide, but it is clearly not out of the woods just yet. That being said, a downside violation of the short-term ascending trendline might accelerate the recent pullback.
Gold Rally Turns Golden After Another Record
- Gold unlocks fresh all-time high
- Bullish wave could stabilize, but perhaps temporarily
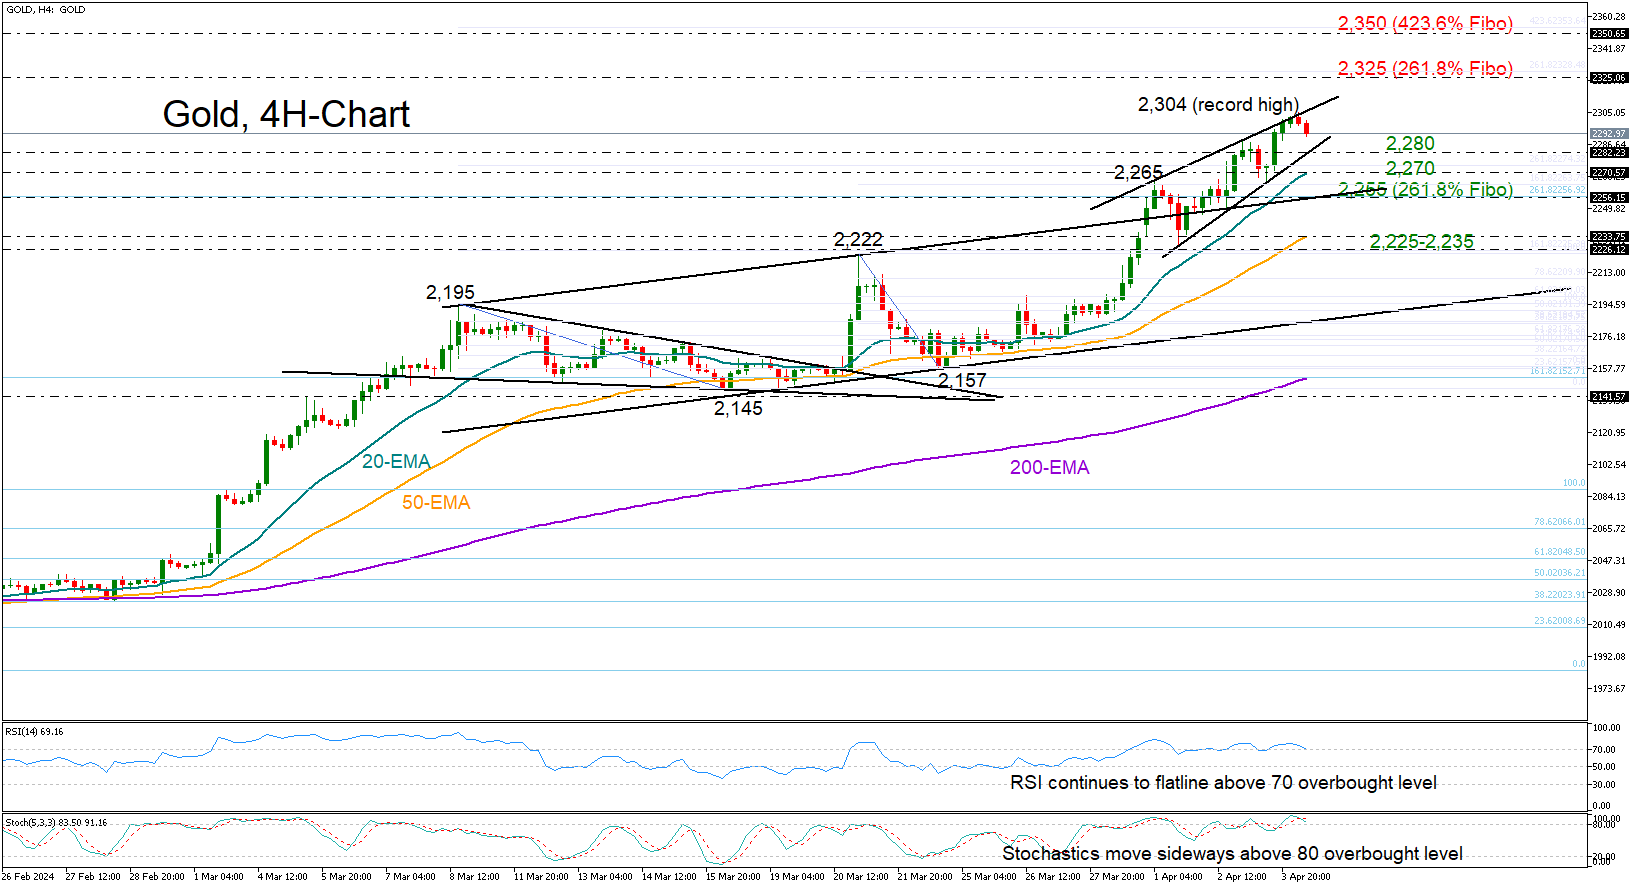
Gold has been in an uninterrupted record rally over the past week, ticking to a new high of 2,304 before losing some steam early on Thursday.
While investors continue to debate the longevity of the bullish wave as the rate cut scenario remains a hot topic in the US, it is possible that some profit taking could occur. The pause near the short-term resistance line and the overbought signals coming from the RSI and stochastic oscillator endorse that case.
If the current weakness lingers, the price could retrace to the support trendline at 2,280. The 20-period exponential moving average (EMA) at 2,270 and the support-turned-into-resistance trendline at 2,255 will be closely monitored before the spotlight turns to the 50-period SMA and the 2,225 constraining zone. An extension lower would neutralize the short-term positive outlook.
Should the bull run resume above 2,300, the 261.8% Fibonacci extension of the 2,222-2,157 pullback at 2,325 could be the next obstacle. The 423.6% Fibonacci extension of the 2,195-2,145 downfall at 2,350 might attempt to stop the rally ahead of the 2,400 psychological level.
To sum up, the technical picture indicates an overstretched rally, but the market’s upward structure remains strong, suggesting that any potential pullback would be a normal part of the positive trend.
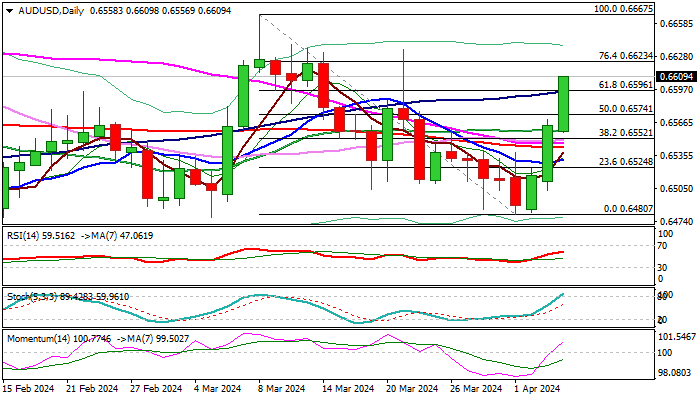
AUD/USD: Strong Recovery Cracks Pivotal Barriers at 0.6600 Zone
AUDUSD rallies for the third straight day, lifted by weaker US dollar and downbeat US services PMI data (released on Wednesday).
Bulls cracked pivotal 0.6600 resistance zone (double-Fibo/100DMA/round-figure), trading at these levels for the first time since Mar 21.
Improved picture on daily chart (momentum broke into positive territory and MA’s turned to bullish setup) contributes to positive outlook, with break and close above 0.6600 zone to open way for possible full retracement of 0.6667/0.6480 bear-leg.
However, overbought conditions warn that current rally may slow for consolidation, with bullish near-term bias to remain in play while the price action stays above broken daily Kijun-sen/50% retracement (0.6570).
Res: 0.6623; 0.6634; 0.6656; 0.6667.
Sup: 0.6596; 0.6570; 0.6552; 0.6537.
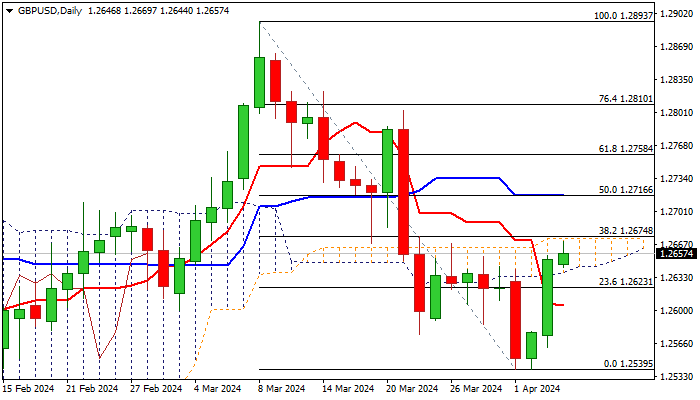
GBP/USD: Slight Bullish Bias Above 200-DMA But Thin Daily Cloud Still Significant Obstacle
Cable extends recovery from 1.2540 double bottom (Apr 1 / 2 lows) and pressuring significant barrier at 1.2674 (daily cloud top / Fibo 38.2% of 1.2893/1.2539), as bulls regained traction after a false break below pivotal 200DMA support (1.2586).
Near-term action is expected to keep slight bullish bias while holding above 200DMA, though sustained break above 1.2674 pivot is needed to confirm fresh bullish signal, after thin daily cloud capped a number of attempts higher.
Daily studies lack clear direction signal as MA’s are in mixed setup, RSI in sideways mode and holding in a neutral zone, while 14-d momentum is heading north but still in the negative territory.
Weaker dollar continues to underpin pound, but possibility of recovery stall on repeated failure to break through daily cloud, which would keep the downside at risk, should not be ignored.
Res: 1.2674; 1.2716; 1.2758; 1.2803.
Sup: 1.2638; 1.2586; 1.2539; 1.2518.
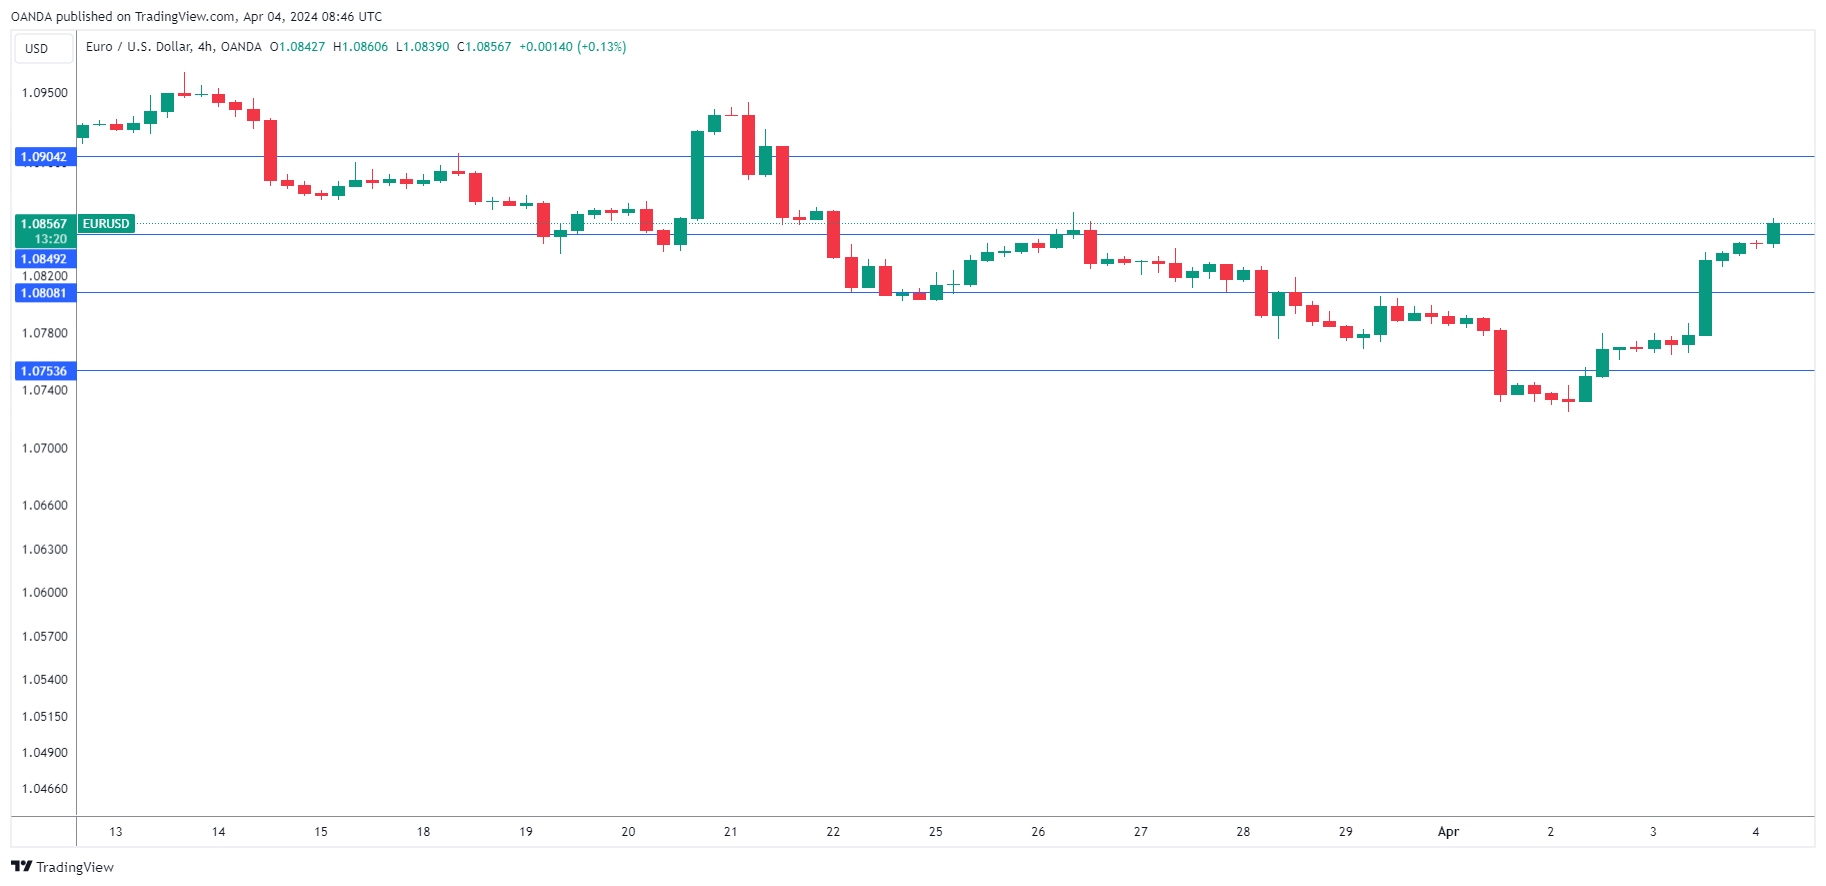
EUR/USD Extends Gains as Euro Services PMIs Improve
The euro is on a bit of a roll and has pushed slightly higher on Thursday. In the European session, EUR/USD is trading at 1.0857, up 0.19%. The euro is up for a third straight day and has climbed 0.8% since Monday.
Eurozone and German services PMIs accelerate
Business activity improved across the eurozone in March. The eurozone services PMI rose to 51.5, up from 50.2 in February. The German reading improved to a revised 50.1, up from 48.3 in February. This marks the first expansion in Germany’s services sector in six months. Spain, France and Italy all showed stronger expansion in March. The 50.0 line separates contraction from expansion.
The services sector has carried the eurozone economy as manufacturing continues to decline. The eurozone has managed to avoid a recession, but the economy remains fragile. At the same time, inflation has been falling faster than expected, and European Central Bank policy makers have the tough task of determining the appropriate time to start cutting the deposit rate, which is currently at a record high 4%.
The markets are anticipating a rate cut in June and some ECB members have publicly stated that they support such a move. ECB member Robert Holzmann, considered a hawk on rate policy, said on Wednesday that he isn’t against a June cut but would want to see more data before making a decision. Holzmann added that if the ECB lowers rates in June and the Federal Reserve stays on the sidelines, this would reduce the effectiveness of the ECB lowering its deposit rate.
In the US, employment numbers are in focus, with nonfarm payrolls on Friday. The markets are expecting a drop to 200,000 in March, compared to 275,000 a month earlier. Unemployment claims will be released later today and are not expected to show much change. The market estimate stands at 214,000, compared to the previous reading of 210,000.
EUR/USD Technical
- EUR/USD is testing resistance at 1.0849. Above, there is resistance at 1.0904
- 1.0808 and 1.0753 are providing support
Relatively Calm Bitcoin
Market picture
The crypto market rolled back another 0.9% in 24 hours to a capitalisation of $2.48 trillion – the lowest in a week and a half. Bitcoin reversed by the same amplitude, while there was no uniformity in dynamics among the top coins. Ethereum was unchanged for the day, remaining at $3300, Solana lost 3.1%, Dogecoin fell another 4%, BNB rose 4.2%, and Toncoin strengthened 0.3%. The Cryptocurrency Fear and Greed Index rolled back to 70, its lowest since 14 February.
Bitcoin ended Wednesday where it started the day, trading at $65.5K. Enthusiasts continue to buy back the first cryptocurrency on dips closer to $65K. On the other hand, Bitcoin’s inability to rise is alarming, although the day before, we saw a weaker dollar and stronger stock indices, which is fuelling risk appetite.
The cryptocurrency market’s lagging performance can easily be attributed to accumulated overbought conditions and wariness ahead of the monthly labour market report. At the same time, we regard the current weakness as consolidation within the bull market, almost excluding the risks of a long-term reversal.
News background
Spot trading volume on cryptocurrency exchanges reached $2.5 trillion in March, The Block calculated. That’s the highest since November 2021. The record of $4.1 trillion was set in May 2021. The total trading volume of BTC futures contracts in March rose 86% to $2.5 trillion.
According to data compiled by Bloomberg, March was a record-breaking month in terms of spot bitcoin-ETF trading volume. The figure nearly tripled from the previous month, from $42bn to $111bn. According to SoSoValue, three exchange-traded funds from Grayscale (GBTC), BlackRock (IBIT) and Fidelity (FBTC) continue to dominate trading volume. Meanwhile, total outflows from GBTC have reached $15bn since launch.
The crypto market can expect an outflow of liquidity due to the renewed appeal of gold with speculative investors, suggested Eric Balchunas, an ETF expert at Bloomberg.
A US government-controlled wallet with 30,174 BTC initiated a transfer of about 2000 BTC to the Coinbase Prime platform address. Experts have allowed the sale of assets. Presumably, this is part of the assets seized from the Silk Road darknet marketplace.
MN Trading founder Michael van de Poppe said that “at the peak of bullish momentum”, bearish narratives like the sale of bitcoins by US authorities have a “huge impact” on investor sentiment.
Regulatory questions directed to the SEC often need to be answered, suggesting a decline in the Commission’s genuine engagement with the public, said Hester Pearce, the agency’s commissioner.
Brent Oil Price Reaches Its Highest Since October 2023
The Brent oil chart today shows that the price has exceeded USD 89 per barrel — this is the highest level since the end of October 2023.
Reasons for strong demand for oil:
→ The OPEC+ meeting ended this week. Exporting countries maintained their policy of limiting oil production unchanged.
→ Ukrainian drone attacks on oil refineries in Russia.
→ Latest data on the strength of the US economy.
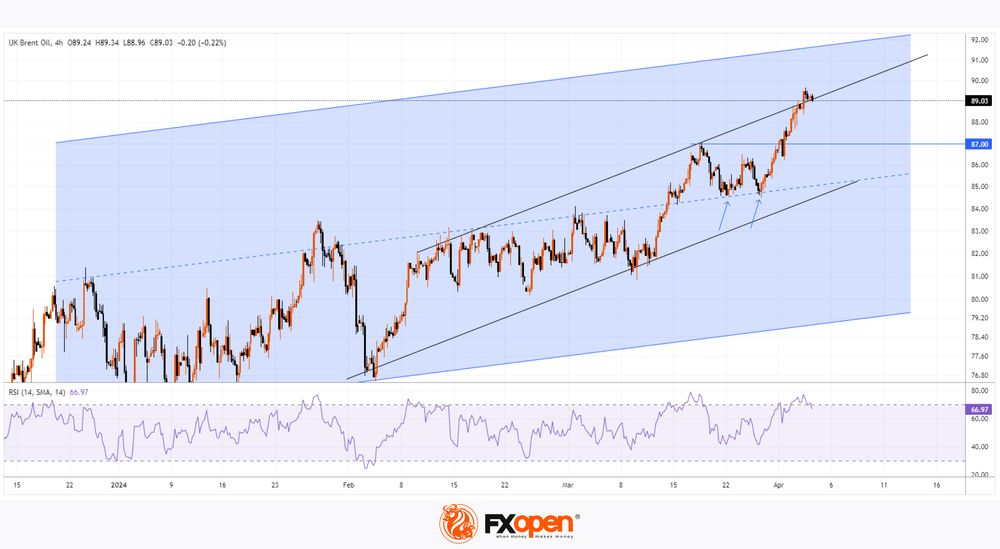
Technical analysis of the Brent market shows that:
→ The price moves within the ascending channel (shown in blue), which originates back in 2023.
→ Increased demand in the spring of 2024 led to the fact that the Brent price rose into the upper half of the blue channel and formed a steeper growth trajectory (shown by black lines).
→ The median line of the blue channel acted as support (shown by arrows).
The upper limit of the blue channel is around USD 92 per barrel of Brent and it is possible that the price may reach these values in the next 1-2 months.
However, the prerequisites for a correction are not currently in place after an increase of more than 5% over the last 5 trading sessions:
→ the RSI indicator indicates overbought;
→ the price is at the upper black line.
If a correction scenario is realized in the market, the Brent price may drop to the $87 level, which previously acted as resistance.
Start trading commodity CFDs with tight spreads. Open your trading account now or learn more about trading commodity CFDs with FXOpen.
This article represents the opinion of the Companies operating under the FXOpen brand only. It is not to be construed as an offer, solicitation, or recommendation with respect to products and services provided by the Companies operating under the FXOpen brand, nor is it to be considered financial advice.
US Stock Market Awaits the Publication of NFP And Unemployment Data
Important events of this week for investors and traders in the US stock market could be the employment news, which will be published tomorrow at 15:30 GMT+3:
→ non-Farm Payrolls (NFP) report for March. According to CNN, analysts expect nonfarm payrolls to rise by 192,500 in March. NFP for February was 275,000, according to FactSet.
→ data on the unemployment rate (Unemployment Rate). According to ForexFactory, the unemployment rate is expected to remain unchanged at 3.9%.
The state of the labour market is under close scrutiny by the Fed and could provide valuable insight into the prospects for interest rate cuts. The release of the unemployment rate and NFP numbers for March could be an example of what is called "bad news is good news" on Wall Street. After all, if the data shows a deterioration in the labour market, then this will be an argument for the Fed to lower interest rates, which in turn could lead to an increase in the stock market.
Indeed, according to CNN, Fed Chairman Jerome Powell said last week that a weakening labour market would be a reason to cut interest rates.
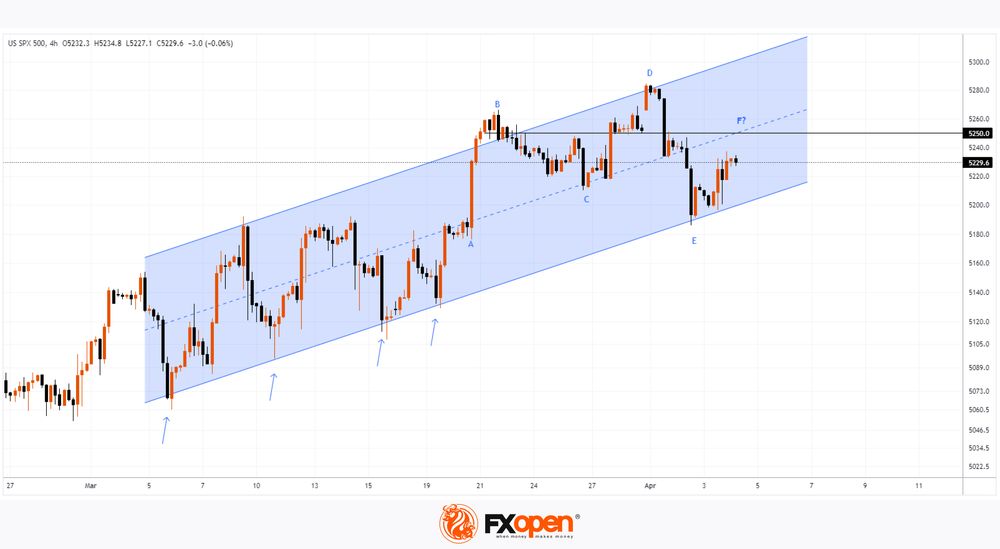
However, the S&P 500 chart shows the price moving within an ascending channel, but showing signs of weakness around the 5,250 level on the 4-hour period:
After a sharp increase in A→B, the price entered a prolonged correction B→C - this may be a sign of a large volume of sell orders near the level of 5,250, which absorbed the bullish impulse A→B.
An attempt to break through the level of 5,250 (price growth to top D) turned out to be a failure, as the price sharply dropped from the upper border of the channel to the lower one. Such progress should be alarming for the bears.
From the point of view of technical analysis of the S&P 500, on the eve of the publication of the NFP report, the price forms a rebound from the lower border of the channel. But by its nature, the rebound does not look dynamic compared to the previous ones (shown by arrows) — the price’s action shows that this time it needs time to approach the median line.
The above arguments provide the basis for the assumption that the publication of the unemployment rate and the NFP report for March can become drivers of price movement, at which it will form an F top.
Wherein:
→ the tops of B-D-F can form a bearish head and shoulders pattern;
→ the median line of the ascending channel and the level of 5,250 will act as resistance for the bulls.
Trade global index CFDs with zero commission and tight spreads. Open your FXOpen account now or learn more about trading index CFDs with FXOpen.
This article represents the opinion of the Companies operating under the FXOpen brand only. It is not to be construed as an offer, solicitation, or recommendation with respect to products and services provided by the Companies operating under the FXOpen brand, nor is it to be considered financial advice.
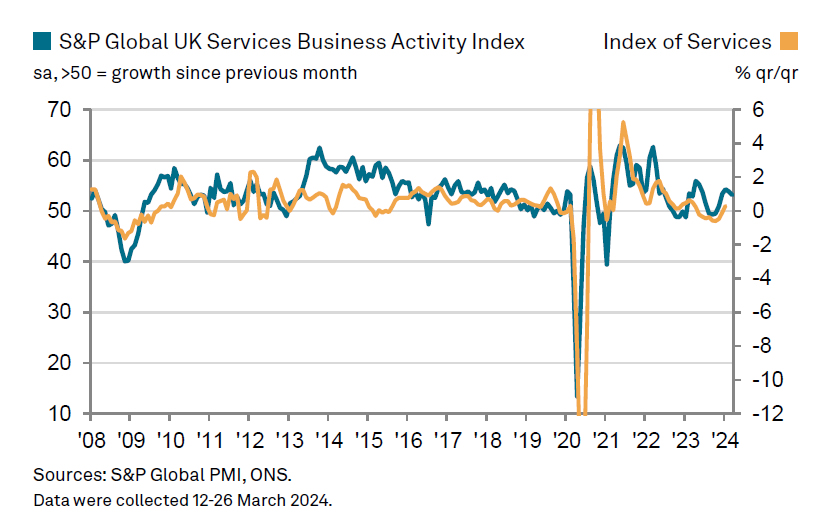
UK PMI Services finalized at 53.1, inflation pressures persist
UK PMI Services was finalized at 53.1 in March, down from February's 53.8. PMI Composite was finalized at 52.8, down from prior month's 53.0.
Tim Moore, Economics Director at S&P Global Market Intelligence, said, "The solid growth rate achieved in March reinforces the view that a rebound in service sector performance is helping the UK economy to pull out of last year's shallow recession."
Meanwhile, Input prices have continued to rise sharply, with inflation rates only slightly below their six-month average. The primary factors contributing to the uptick in input costs include higher salary payments and increased transportation bills.
The rate at which prices charged by service providers have increased slowed to its lowest point since September 2023. Despite this deceleration, the index remains well above its long-term trend, signaling enduring inflationary pressures within the UK's domestic economy.