Sample Category Title
Bitcoin Perfect Reaction Higher From Blue Box Area
In this technical blog, we will look at the past performance of the 1-hour Elliott Wave Charts of Bitcoin ticker symbol: $BTCUSD. We presented to members at the elliottwave-forecast. In which, the rally from the 11 September 2023 low is unfolding as an impulse structure. Showing a higher high sequence favored more upside extension to take place. Therefore, we advised members not to sell the crypto & buy the dips in 3, 7, or 11 swings at the blue box areas. We will explain the structure & forecast below:
Bitcoin 1-Hour Elliott Wave Chart From 3.18.2024
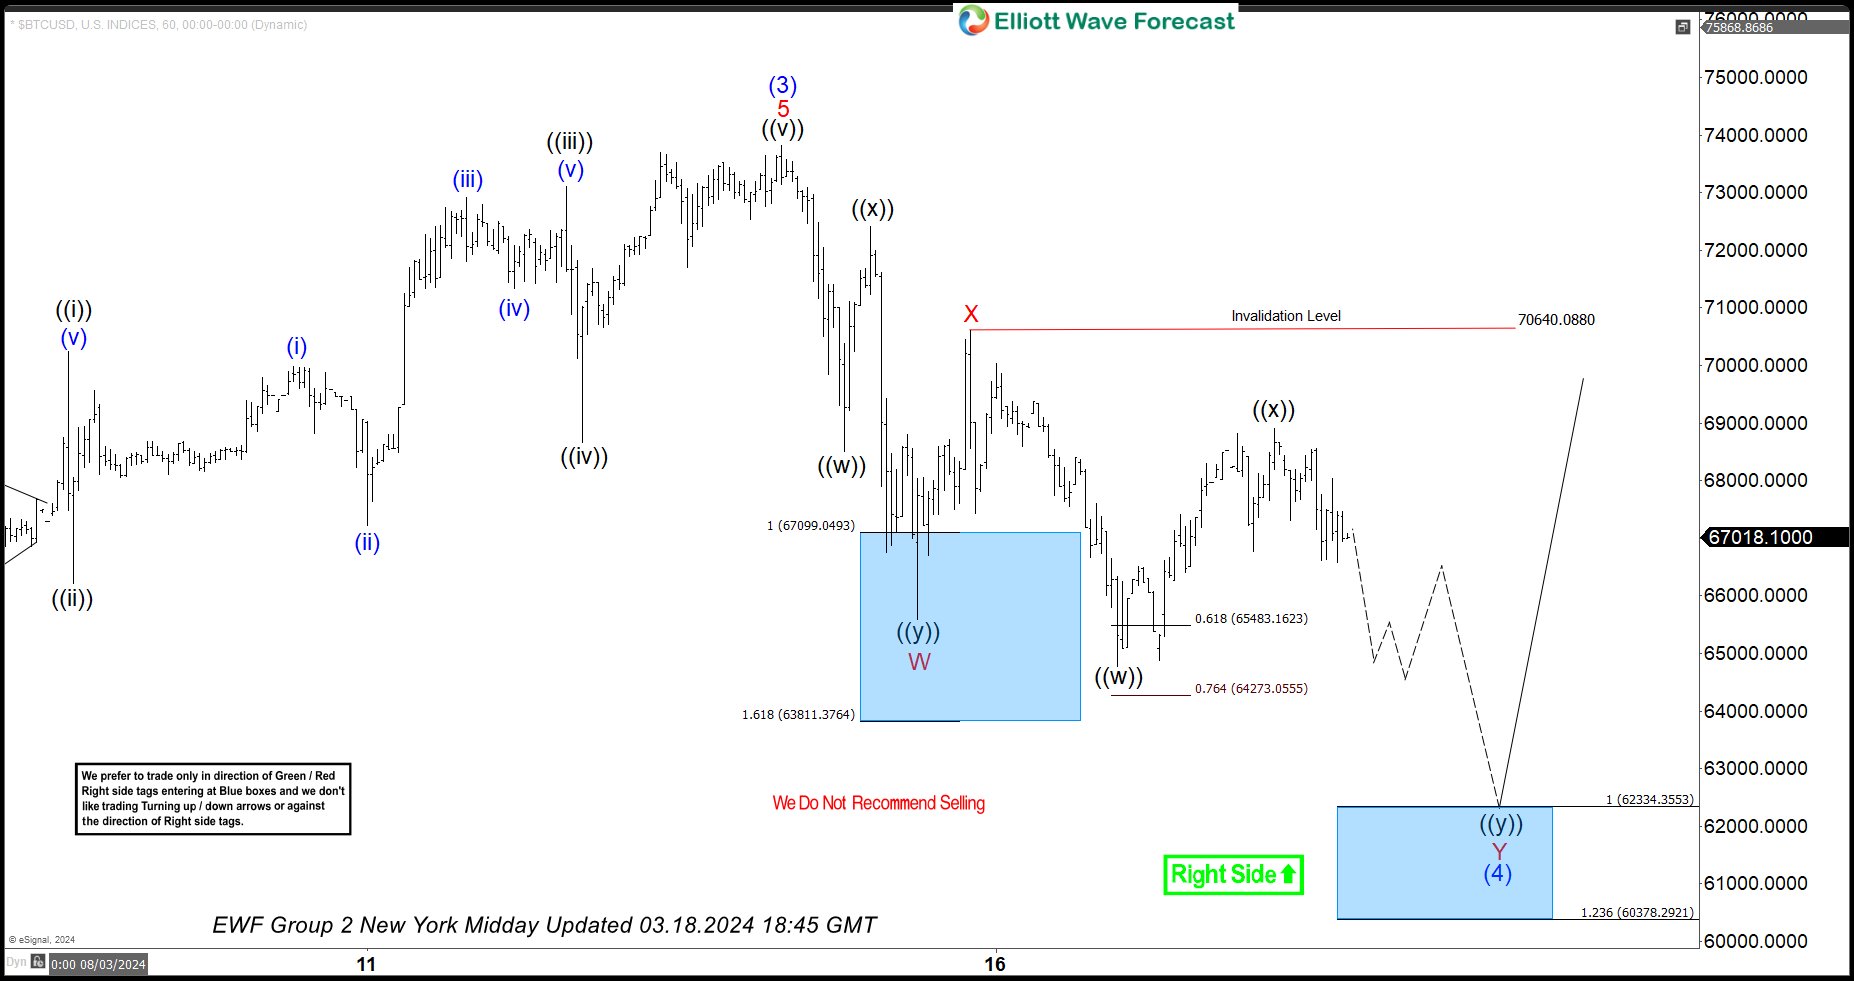
Here’s the 1-hour Elliott wave chart from the 3/18/2024 NY Midday update. In which, the short-term cycle from the 1/23/2024 low ended in wave (3) at $73814 high. Down from there, the BTCUSD made a pullback in wave (4) to correct that cycle. The internals of that pullback unfolded as Elliott wave double three structure where wave W ended at $65595 low. Wave X bounce ended at $70640 high and wave Y managed to reach the blue box area at $62334- $60378. From there, buyers were expected to appear looking for the next leg higher or for a 3 wave bounce minimum.
BTCUSD Latest 1-Hour Elliott Wave Chart From 3.26.2024
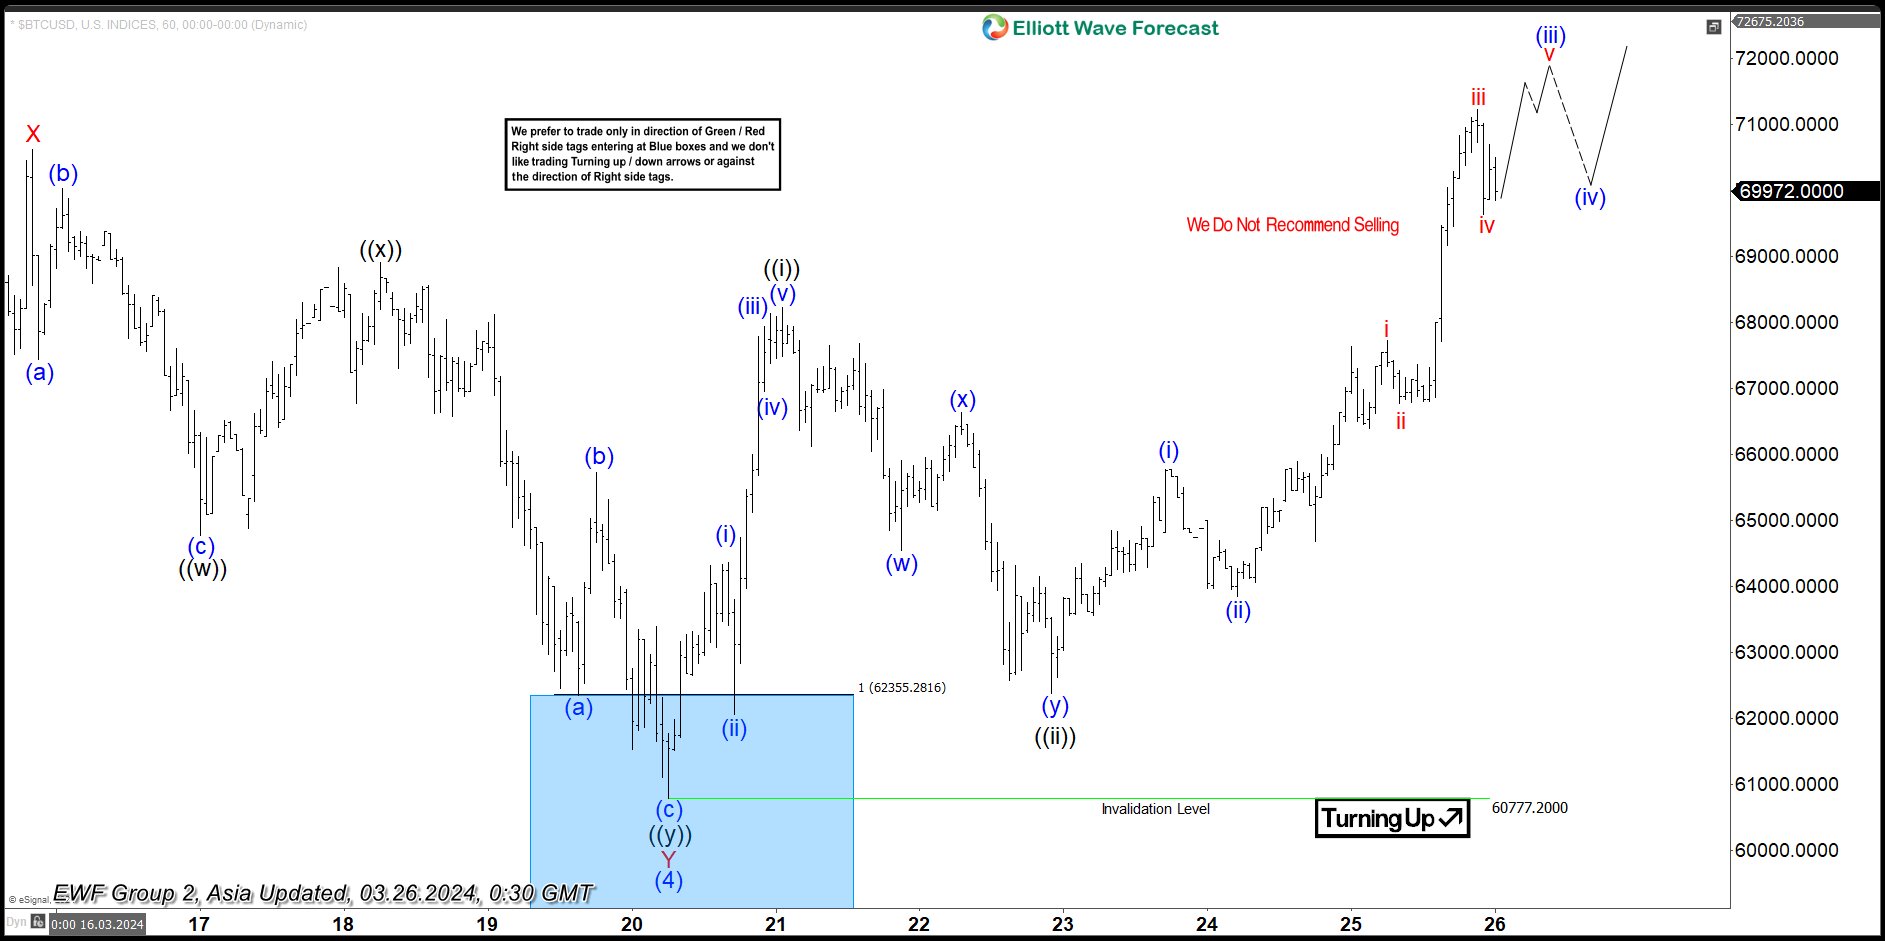
This is the latest 1-hour Elliott wave Chart from the 3/26/2024 Asia update. In which the Bitcoin is showing a reaction higher taking place, right after ending the double correction within the blue box area. Allowed members to create a risk-free position shortly after taking the long position at the blue box area. However, a break above $73814 high is still needed to confirm the next extension higher towards $73822- $76901 & avoid a double correction lower.
Gold (XAUUSD) Looking to Do Larger Degree Correction
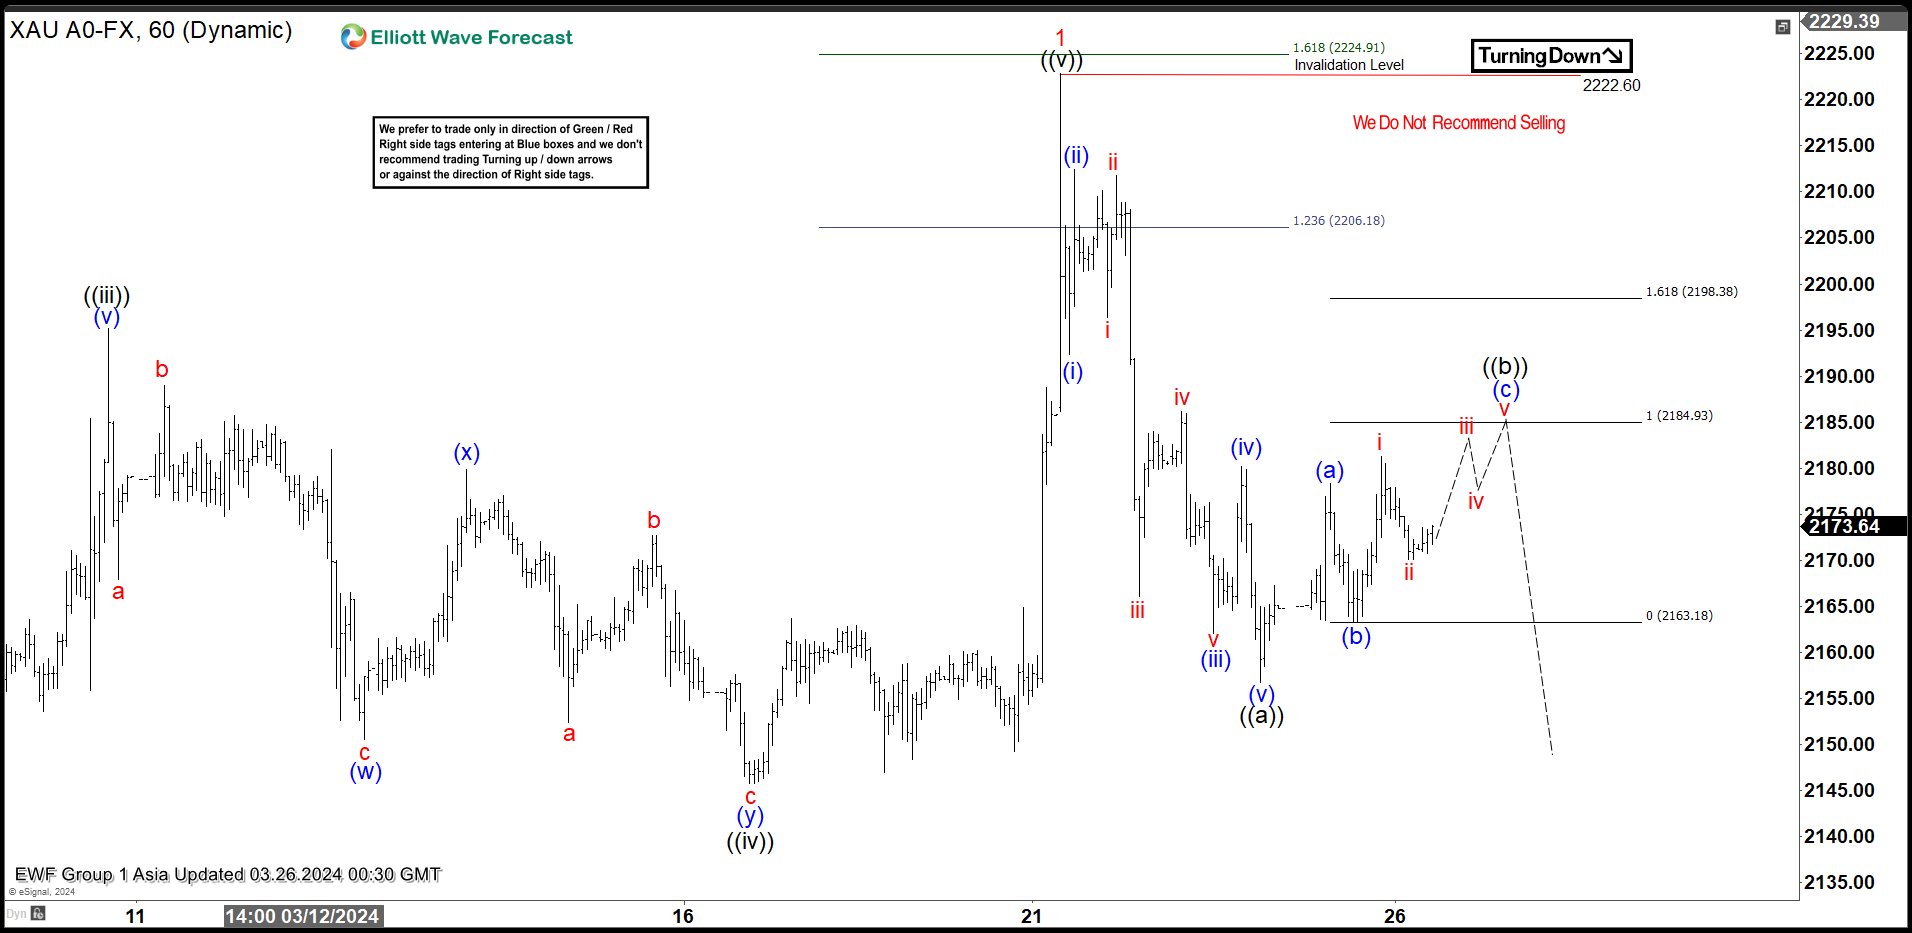
Short Term Elliott Wave view in Gold (XAUUSD) suggests that Gold ended the cycle from 12.13.2023 low. Rally from 12.13.2023 low unfolded as an impulse. Up from there, wave ((i)) ended at 2088.48 and dips in wave ((ii)) ended at 1984.37. The metal then resumed higher in wave ((iii)) towards 2195.15 as the 1 hour chart below shows. Pullback in wave ((iv)) unfolded as a double three Elliott Wave structure. Down from wave ((iii)), wave (w) ended at 2150.45 and wave (x) ended at 2179.81. Wave (y) lower ended at 2145.70 which completed wave ((iv)).
Final leg wave ((v)) ended at 2222.91 which completed wave 1 in higher degree. The metal is now in larger degree wave 2 pullback to correct cycle from 12.13.2023 low. The pullback unfolded as a zigzag Elliott Wave structure. Down from wave 1, wave (i) ended at 2192.3 and wave (ii) ended at 2212.45. Wave (iii) lower ended at 2162, wave (iv) ended at 2180.13, and wave (v) lower ended at 2156.7 which completed wave ((a)) in higher degree. Wave ((b)) unfolded as a zigzag structure. Up from wave ((a)), wave (a) ended at 2178.29 and wave (b) ended at 2163.2. Expect wave (c) of ((b)) to end at 2184.9 – 2198 before the metal turns lower. As far as pivot at 2222.92 high stays intact, expect rally to fail in 3, 7, 11 swing for further downside.
Gold (XAUUSD) 60 Minutes Elliott Wave Chart
XAUUSD Elliott Wave Video
https://www.youtube.com/watch?v=_AtRQ6a541A
FTSE 100 to Benefit from Improved Commodity Appetite
The week kicked off with a pause in the equity rally on both sides of the Atlantic Ocean. Nikkei index is mostly flat on Tuesday and the yen consolidates above 151 following yesterday’s threat from a Japanese official about a potential intervention to stop excessive bleeding in the yen. The Japanese will likely intervene if the USDJPY surpasses the 152 level.
Elsewhere, the dollar index gave back field yesterday as new homes sales unexpectedly fell in February. A $66bn US 2-year bond auction, on the other hand, saw a tepid demand, the yield settled near 4.50%. The 2-10 year of the US yield curve remains inverted for the longest stretch on record. But there is no recession in sight just yet; the US expected to print a 3% growth last quarter, down from near 5% printed a quarter before. The Federal Reserve’s (Fed) massive balance sheet and the huge government spending explain why the higher yields never slowed the US economy. Friday’s core PCE print – the Fed’s favourite gauge inflation – may print a 0.3% monthly rise and a stable 2.8% yearly rise. But at this point, I’ve come to conclude that nothing will derail the Fed cut expectations. And the fact that the Fed will, on top of it, slow the pace of its QT is soothing for risk sentiment. The S&P 500 opened the week slightly lower, we could see some profit taking before the long Easter weekend, market volatility remains low.
Apple’s AI battle
Apple is offered near $170 per share despite chatter that the company could team up with the Chinese Baidu – the Chinese equivalent of Google that’s also active in AI, in hope to boost its iPhone sales in China. Broadly speaking, Apple’s effort to catch up with the AI developments through partnerships is interesting. If the company nails the right partnerships and gets the right offer on their devices, investors could tolerate the lack of in-house AI developments. But the problem is that, when you rely on tools developed by others, you accept that competition could also get them. In the particular case of Apple, the Korean Samsung has already got its smartphones powered by Baidu, therefore it will be hard for
Apple to stand out with the same offering.
But zooming out of Apple, the next phase of the AI should be the extension of the benefits from the companies that power the AI tools – like semiconductors and data centers – to companies that implement the AI models and grow their business on it. Apple could fall in this second category, if it finds the right partnerships and the right strategy. For now, investors remain skeptical.
Improved commodity appetite to boost FTSE 100
A period of loosening policies will likely support the equity valuations beyond the Big Tech, back bond valuations, but also commodities. Rebound in Western manufacturing, Chinese stimulus and geopolitical risks should back copper, aluminum, gold and oil. Copper futures trade with a 20% discount from the pandemic peak on COMEX, while gold consolidates near $2170 per ounce, close to the ATH levels reached earlier this month. US crude on the other hand is back above the $82pb, as bulls eye a further advance to $85pb mark in the continuation of the actual positive trend. Trend and momentum indicators remain supportive of a further rise, and we are not yet close to overbought conditions. I also think that AI investors should enlarge their scope to energy necessary to fuel powerful AI computations. And the name of the controversial uranium is being pronounced timidly by some investors and analysts. The uranium futures have got a significant boost since the war in Ukraine started, and despite the efforts to shift toward alternative and clean energy sources, like wind and solar, none offers a sufficiently large scale to satisfy humanity’s increasing hunger for energy, except uranium.
If commodities perform well, the British FTSE 100 – heavy in energy and mining stocks – should also see a boost. The index rebounded more than 3% since last week, as some investors divest from the US and European stocks that trade near record to invest in British blue-chips that trade with around 50% discount to their Western peers. The FTSE 100 is relatively cheap, it offers an interesting exposure to commodities and the index could claim a fresh high, above the 8000p mark, if appetite for commodities continues to rise on the back of a softer outlook for global central banks and persistent geopolitical tensions.
Focus on US and Swedish Data Today
In focus today
From the US, durable goods orders are due for release for February and Conference Board will release its consumer confidence survey for March. Consumer confidence has improved gradually over the winter as slower inflation supports real incomes.
In Sweden we get producer and import price index for February and the Economic Tendency Survey from NIER. The latest survey showed a significant drop in companies' expected sales. It will be interesting to see if the decrease persists. This is especially important in relation to expected selling prices for the sticky service inflation that is still marginally higher than levels that are consistent with the inflation target of 2%.
The Hungarian central bank will announce its rate decision today. We expect a rate cut of 75bps from 9.00% to 8.25%.
Economic and market news
What happened yesterday
In the US, Fed's Cook (voter) said that the Fed needed to have a cautious approach to policy easing. Bostic (voter) again stated that he expects only one rate cut in 2024, which he also said on Friday.
In Japan, authorities in Japan are not holding their silence as they try to 'verbally manage' the weak currency, which likely has surprised them after the BoJ rate hike last week. USD/JPY has consolidated above 151. Masato Kanda from the Ministry of Finance said that he is clearly seeing speculative moves in the foreign exchange market and is prepared to act.
In Russia, the government has ordered companies to reduce oil output in the second quarter as previously indicated. Output is set to be cut by 471,000 barrels per day to ensure they meet the production target agreed upon in the OPEC+.
Russian President Putin acknowledged that the terrorist attack on a concert hall near Moscow last week was carried out by Islamic militants, but still signalled that he thinks Ukraine played a role in the attack.
The UN Security Council demanded an immediate ceasefire between Israel and Hamas in Gaza and the release of all hostages. The US abstained from voting, which allowed the UN resolution to be passed.
Equities: Global equities started the week lower with Europe and small caps being the bright spots. With very few macroeconomic headlines, it was not a surprise to see a quiet start to the week, which is shortened by holidays. There is discussion among investors if Fed will be able to deliver the cut suggested by the dot plots last week. Investors feel challenged not so much by the job market or demand-side, but rather the inflation outlook. The next big test will come later this week when the PCE numbers are due. In US yesterday Dow -0.4%, S&P 500 -0.3%, Nasdaq -0.3%, and Russell 2000 +0.1%. Asian markets are mostly higher this morning together with US futures while European futures are marginally lower.
FI: Global bond yields rose yesterday on the back of a string of more hawkish comments from various Federal Reserve members. There are few tap auctions in the EGB market today. Germany is tapping in two green bonds. One is the old 5Y OBL, but now a 1Y bond (OBL 04/25), while the other is the 10Y Green Bund (DBR 02/33). Netherlands is tapping up to EUR 2bn in the 5Y benchmark. The green premium in the 10Y German benchmark is very small, while it some 4-5bp in the short-dated bond and 1bp in the long.
FX: In a relatively quiet start to the week the most notable development in FX markets has been the stabilisation in the CNY amid the Chinese authorities adjusting the USD/CNY fixing lower for the second consecutive session. As argued in yesterday's edition this seemed an important near-term condition for USD weakness and EUR/USD did indeed move towards the 1.0850 mark in yesterday's session. The SEK has been among the underperformers ahead of the Riksbank meeting while both EUR/NOK and EUR/GBP were close-to-unchanged on the day in yesterday's session.
EUR/USD Daily Outlook
Daily Pivots: (S1) 1.0812; (P) 1.0827; (R1) 1.0852; More...
Intraday bias in EUR/USD remains neutral for consolidation s above 1.0801 temporary low. Risk will stay on the downside as long as 55 4H EMA (now at 1.0862) holds. Below 1.0801 will resume the fall from 1.0980 to retest 1.0694 first. Break there will resume the decline from 1.1138 and target 100% projection of 1.1138 to 1.0694 from 1.0980 at 1.0536.
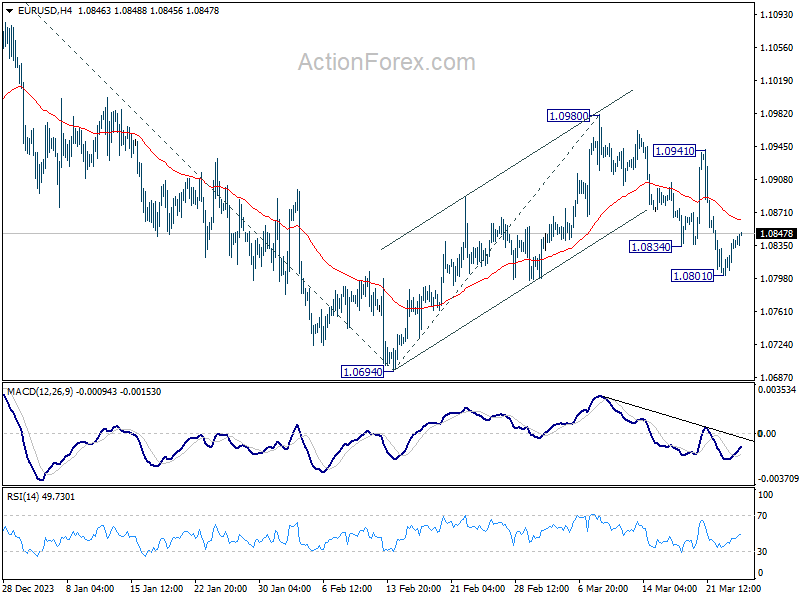
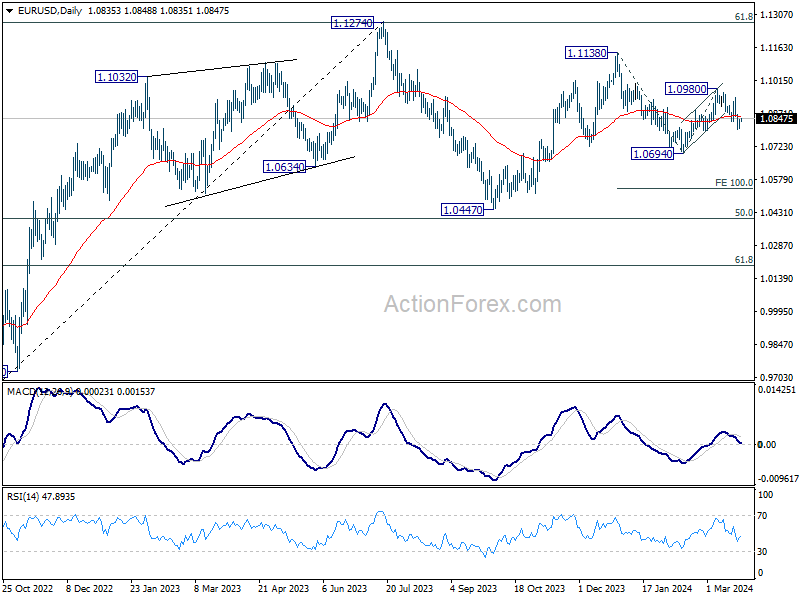
In the bigger picture, price actions from 1.1274 are viewed as a corrective pattern to rise from 0.9534 (2022 low). Rise from 1.0447 is seen as the second leg. While further rally could cannot be ruled out, upside should be limited by 1.1274 to bring the third leg of the pattern. Meanwhile, sustained break of 1.0694 support will argue that the third leg has already started for 1.0447 and possibly below.
USD/JPY Daily Outlook
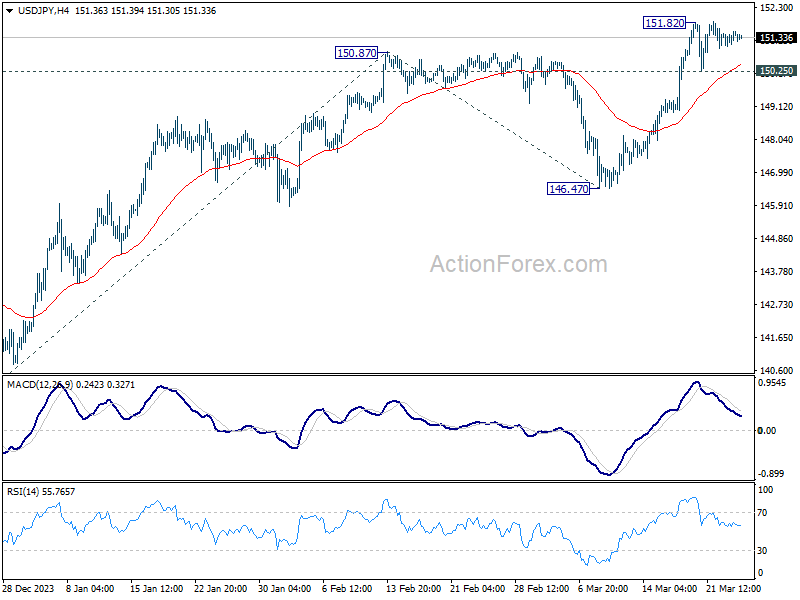
Daily Pivots: (S1) 151.13; (P) 151.35; (R1) 151.64; More...
Intraday bias in USD/JPY remains neutral as consolidation from 151.82 is still extending. Further rally is expected as long as 150.25 support holds. On the upside, decisive break of 151.93 key resistance will confirm long term up trend resumption. Next near term target will be 61.8% projection of 140.25 to 150.87 from 146.47 at 153.03. However, firm break of 150.25 will turn bias back to the downside for deeper pullback.
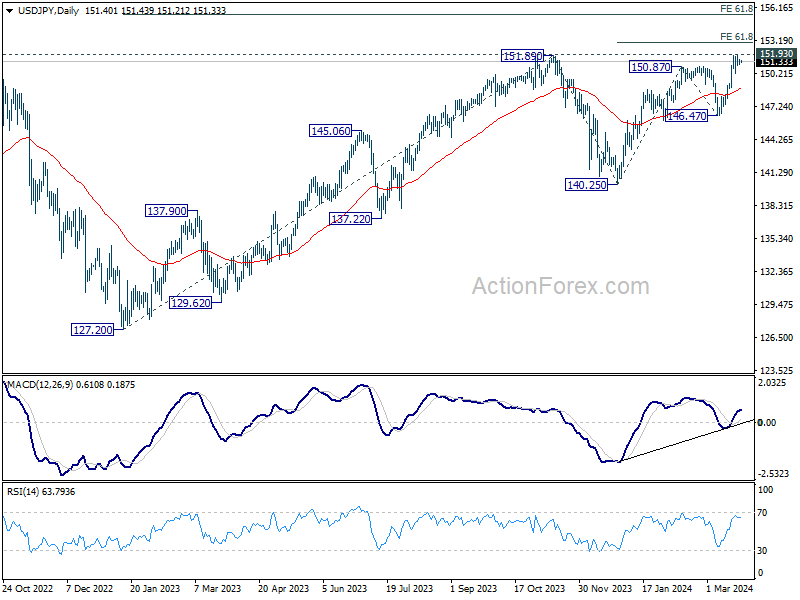
In the bigger picture, correction from 151.87 (2023) high could have completed at 140.25 already. Rise from 127.20 (2023 low), as part of the long term up trend, is probably ready to resume. Decisive break of 151.93 resistance (2022 high) will confirm this bullish case. Next medium term target will be 61.8% projection of 127.20 to 151.89 from 140.25 at 155.20. This will remain the favored case as long as 146.47 support holds, in case of another pullback.
GBP/USD Daily Outlook
Daily Pivots: (S1) 1.2602; (P) 1.2627; (R1) 1.2663; More...
Intraday bias in GBP/USD remains neutral as consolidations from 1.2574 is extending. Risk will stay on the downside as long as 55 4H EMA (now at 1.6905) holds. Below 1.2574 will resume the fall from 1.2892 to 1.2517 structural support first. Decisive break there will suggest that rise from 1.2036 has completed at 1.2892 already, and turn near term outlook bearish.
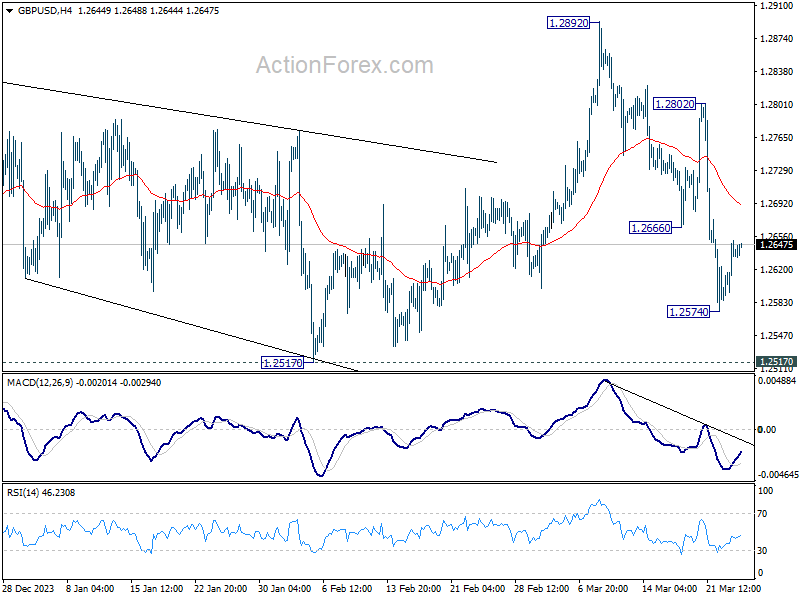
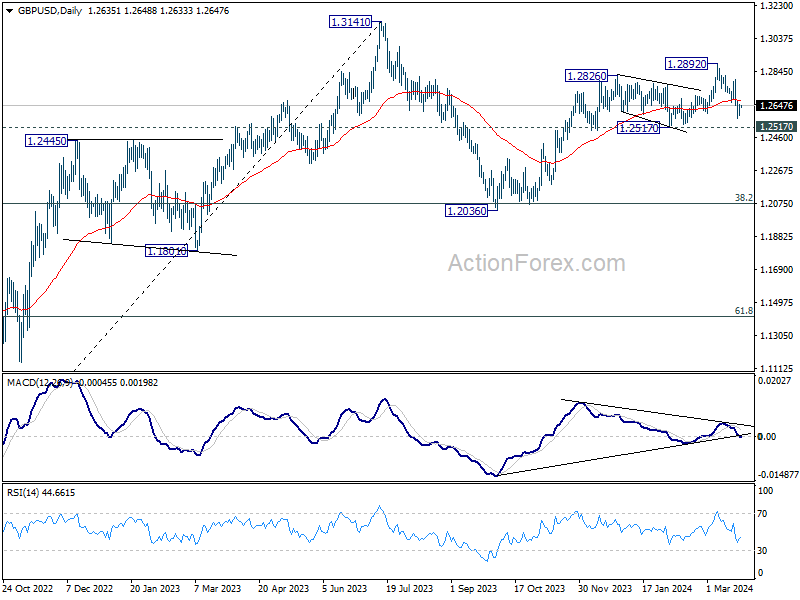
In the bigger picture, price actions from 1.3141 medium term top are seen as a corrective pattern to up trend from 1.0351 (2022 low). Rise from 1.2036 is seen as the second leg, which might still be in progress. But upside should be limited by 1.3141 to bring the third leg of the pattern. Meanwhile, break of 1.2517 support will argue that the third leg has already started for 38.2% retracement of 1.0351 (2022 low) to 1.3141 at 1.2075 again.
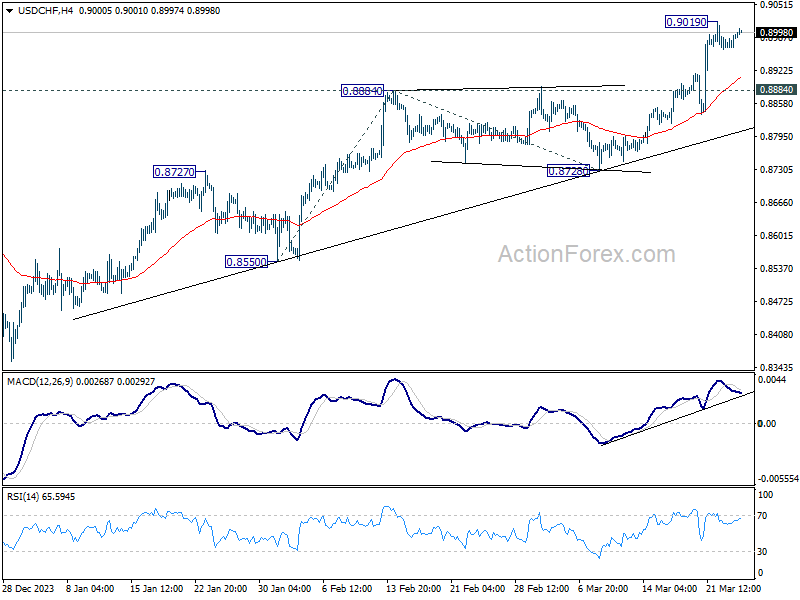
USD/CHF Daily Outlook
Daily Pivots: (S1) 0.8977; (P) 0.8986; (R1) 0.9004; More....
USD/CHF is staying in consolidation below 0.9019 temporary top and intraday bias stays neutral. Another retreat might be seen but downside should be contained by 0.8884 resistance turned support to bring rebound. Break of 0.9019 will resume larger rally from 0.8332. Next target is 100% projection projection of 0.8550 to 0.8884 from 0.8728 at 0.9062.
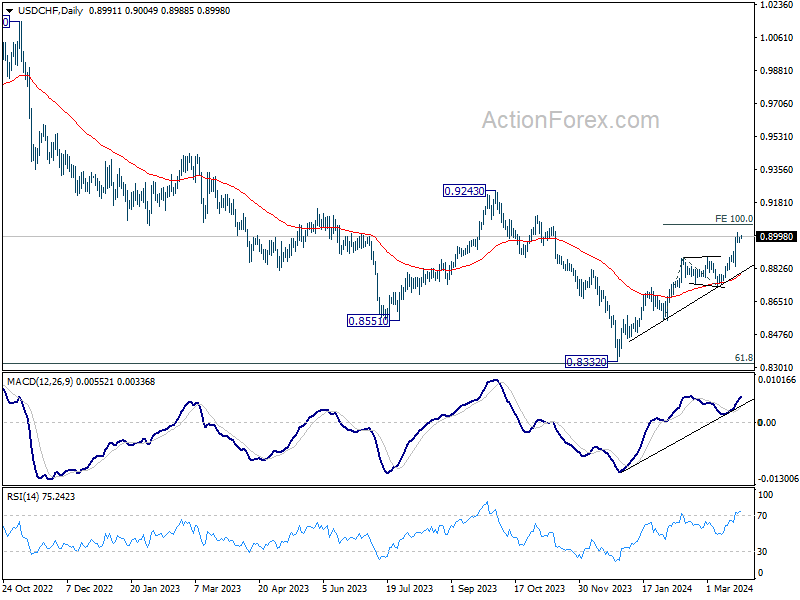
In the bigger picture, price actions from 0.8332 medium term bottom as tentatively seen as developing into a corrective pattern to the down trend from 1.0146 (2022 high). Further rise would be seen as long as 0.8728 support holds. But upside should be limited by 0.9243 resistance, at least on first attempt.
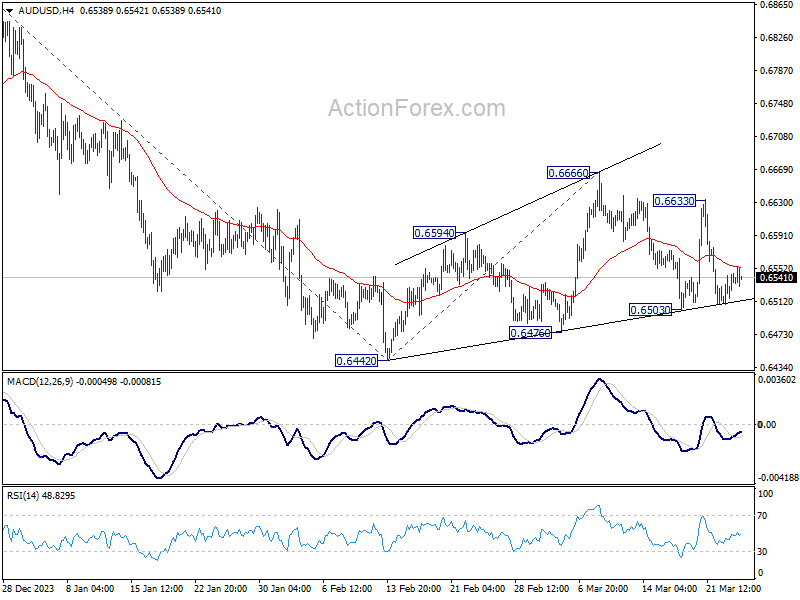
AUD/USD Daily Report
Daily Pivots: (S1) 0.6518; (P) 0.6532; (R1) 0.6555; More....
Intraday bias in AUD/USD remains neutral for the moment. Break of 0.6503 support will indicate that larger fall from 0.6870 is ready to resume, and turn bias to the downside for 0.6442 low. For now, risk will stay on the downside as long as 0.6633 resistance holds, in case of recovery.
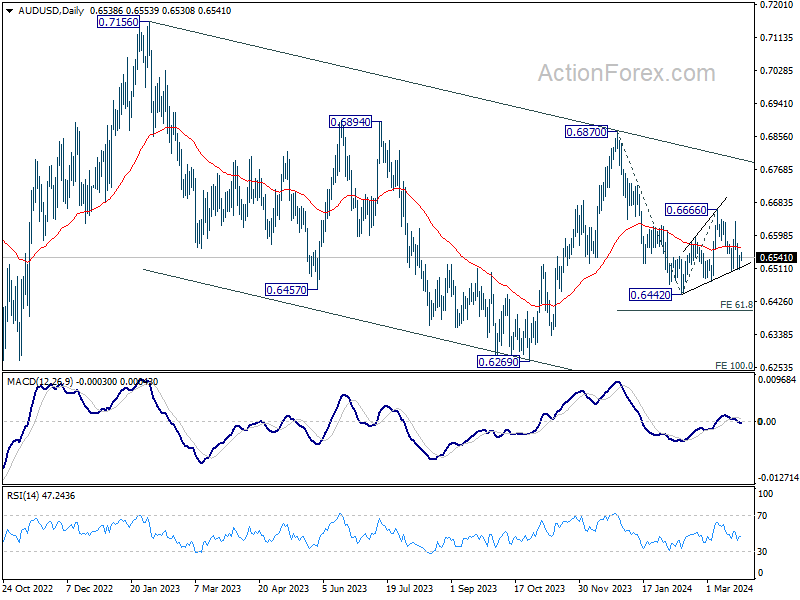
In the bigger picture, price actions from 0.6169 (2022 low) are seen as a medium term corrective pattern to the down trend from 0.8006 (2021 high). Fall from 0.7156 (2023 high) is seen as the second leg, which might still be in progress. Overall, sideway trading could continue in range of 0.6169/7156 for some more time. But as long as 0.7156 holds, an eventual downside breakout would be mildly in favor.
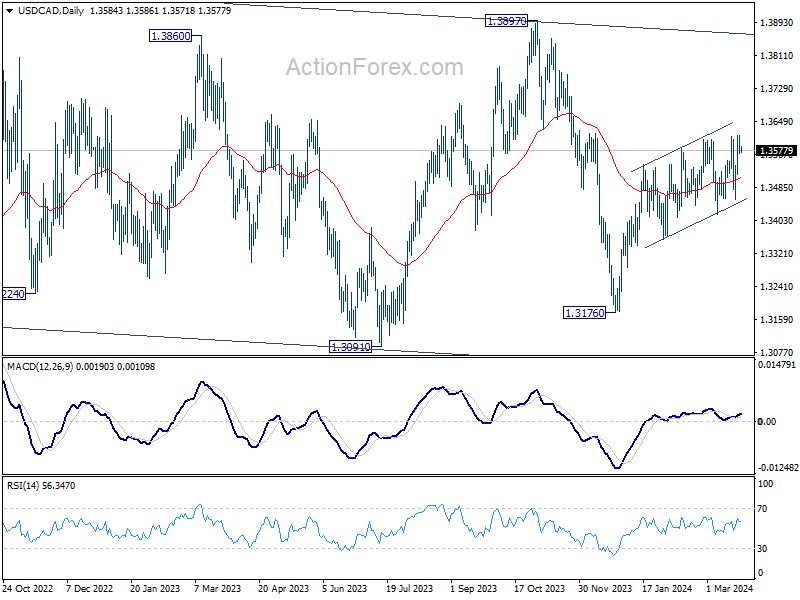
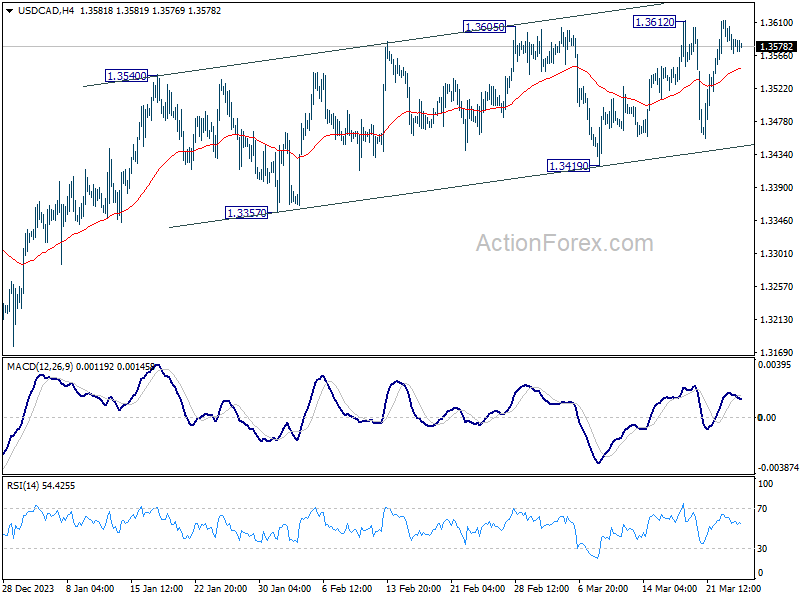
USD/CAD Daily Outlook
Daily Pivots: (S1) 1.3567; (P) 1.3590; (R1) 1.3610; More...
Intraday bias in USD/CAD remains neutral with focus on 1.3612 resistance. Decisive break there will resume whole rise from 1.3176 towards 1.3897 resistance. On the downside, firm break of 1.3419 support will argue that rebound from 1.3176 has completed. Near term outlook will be turned bearish for 1.3357 support first.
In the bigger picture, price actions from 1.3976 (2022 high) are viewed as a corrective pattern only. In case of another fall, strong support should emerge above 1.2947 resistance turned support to bring rebound. Overall, larger up trend from 1.2005 (2021 low) is still expected to resume through 1.3976 at a later stage.