
Sample Category Title
GBP/JPY Daily Outlook
Daily Pivots: (S1) 190.54; (P) 191.15; (R1) 191.94; More.....
GBP/JPY is extending consolidation below 193.51 and intraday bias remains neutral. Outlook will stay bullish as long as 187.94 support holds. On the upside, break of 193.51 will resume larger up trend to 61.8% projection of 178.32 to 191.29 from 187.94 at 195.95, which is close to 195.86 long term resistance.
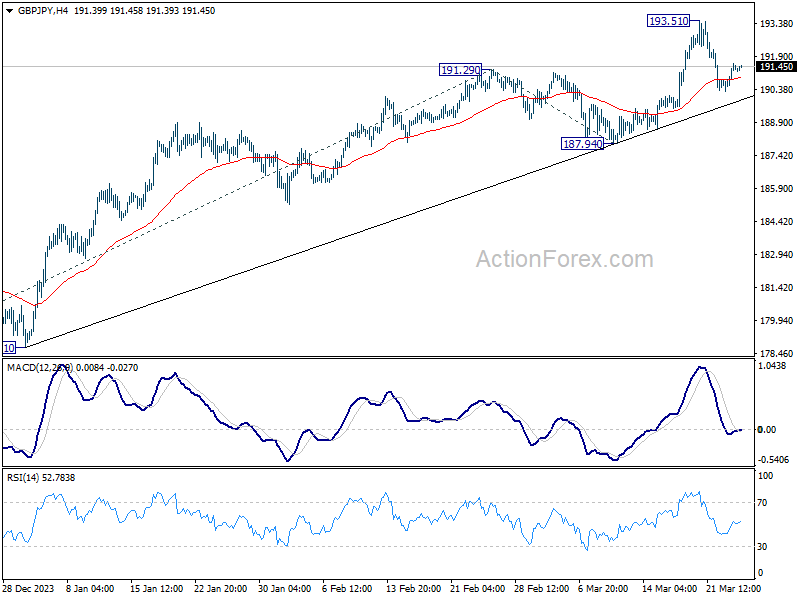
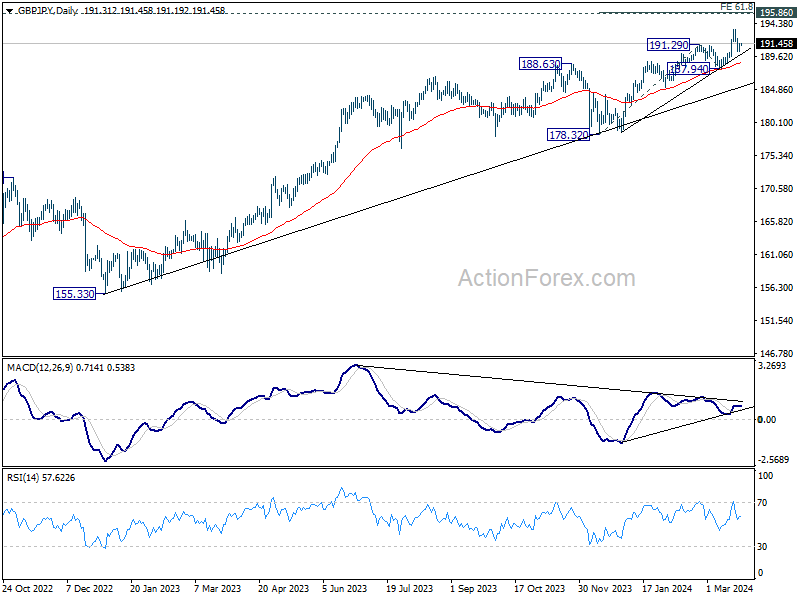
In the bigger picture, current rally is part of the up trend from 123.94 (2020 low), and is in progress for long term resistance (2015 high). Break of 187.94 support is needed to be the first sign of medium term topping. Otherwise, outlook will remain bullish in case of retreat.
EUR/JPY Daily Outlook
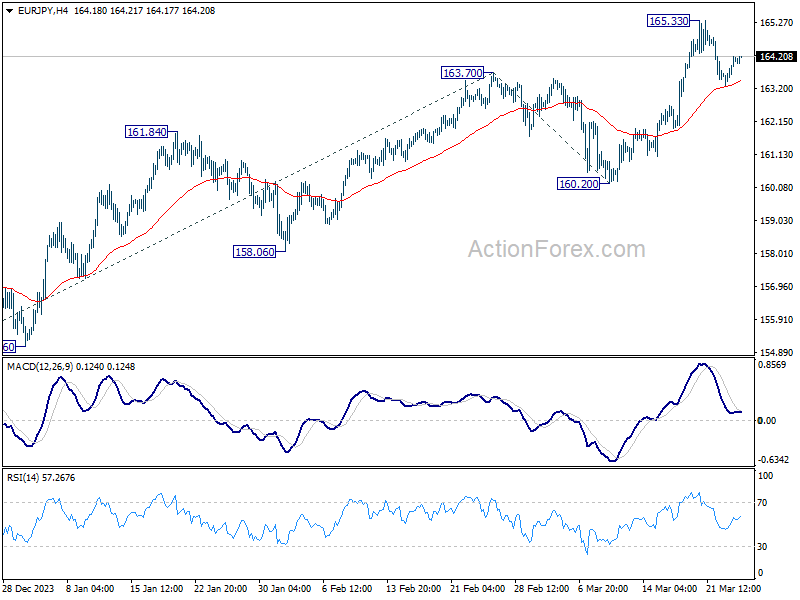
Daily Pivots: (S1) 163.54; (P) 163.88; (R1) 164.43; More...
EUR/JPY is staying in consolidation from 165.33 and intraday bias remains neutral. Downside of current retreat should be contained by 55 4H EMA (now at 163.41) to bring rebound. On the upside, break of 165.33 will resume larger up trend to 61.8% projection of 153.15 to 163.70 from 160.20 at 166.71. However, sustained break of 55 4H EMA will turn bias to the downside for deeper fall to 160.20 support instead.
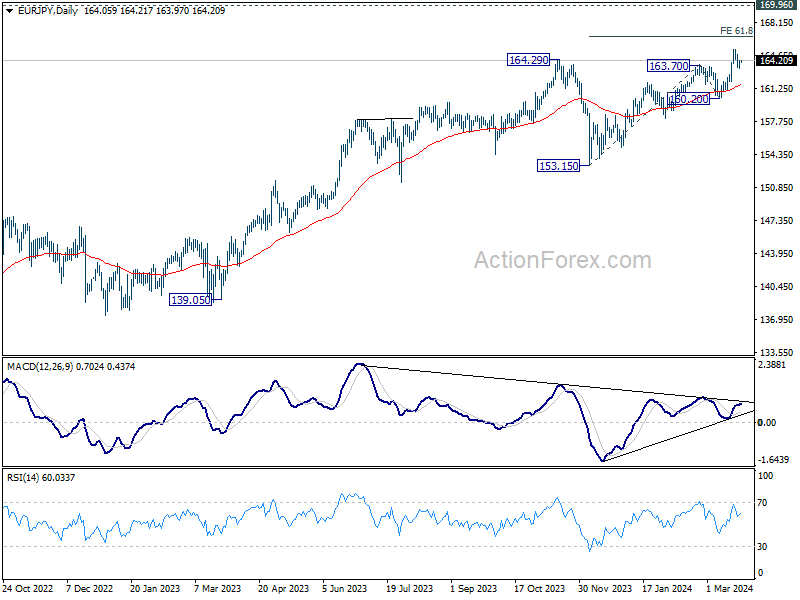
In the bigger picture, current rally is part of the up trend from 114.42 (2020 low), which is still in progress. Next target is 169.96 (2008 high). Break of 160.20 support is needed to be the first sign of medium term topping. Otherwise, outlook will stay bullish in case of retreat.
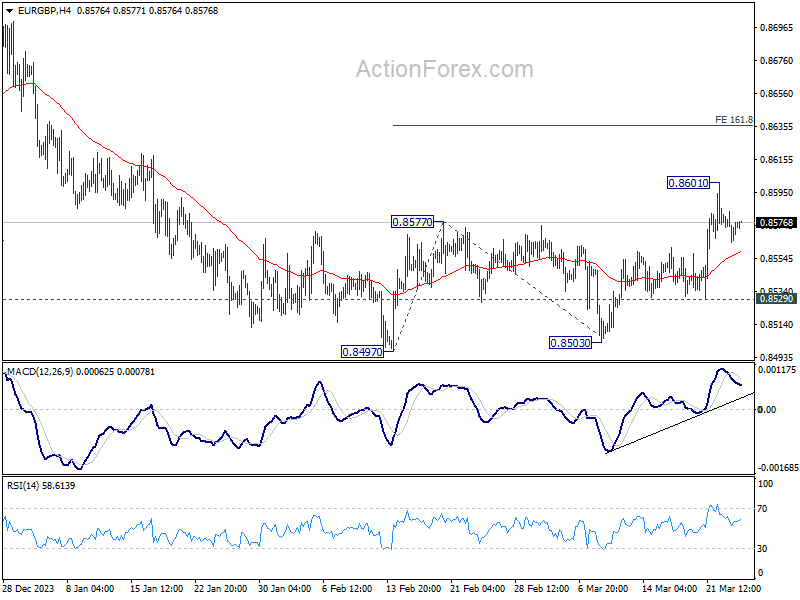
EUR/GBP Daily Outlook
Daily Pivots: (S1) 0.8567; (P) 0.8576; (R1) 0.8586; More...
Intraday bias in EUR/GBP is turned neutral with current retreat. But further rise will remain in favor as long as 0.8529 minor support holds. Rebound from 0.8497 is seen as at least correcting the fall from 0.8764. Above 0.8601 will target 161.8% projection of 0.8497 to 0.8577 from 0.8503 at 0.8632.
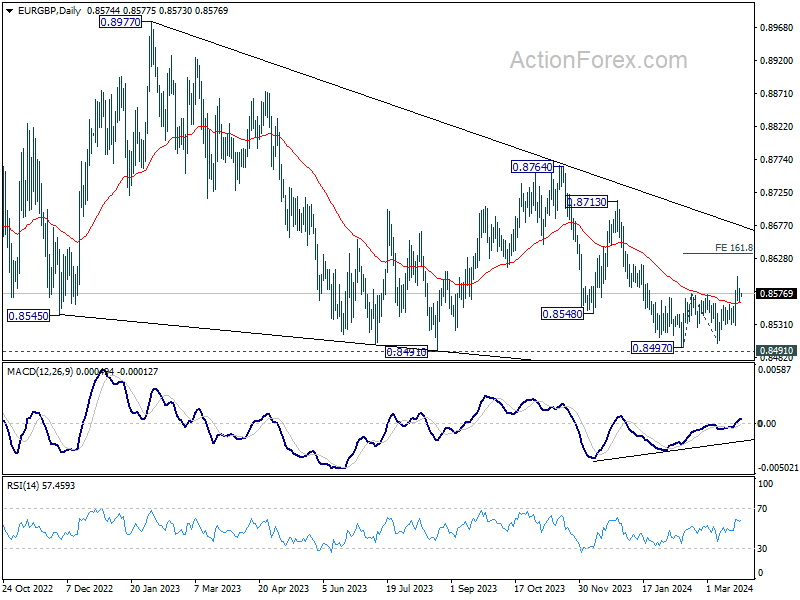
In the bigger picture, there is no clear sign that down trend from 0.9267 has completed, despite loss of downside momentum as seen in D MACD. As long as 0.8713 resistance holds, the down trend will remain in favor to resume through 0.8491 low at la later stage.
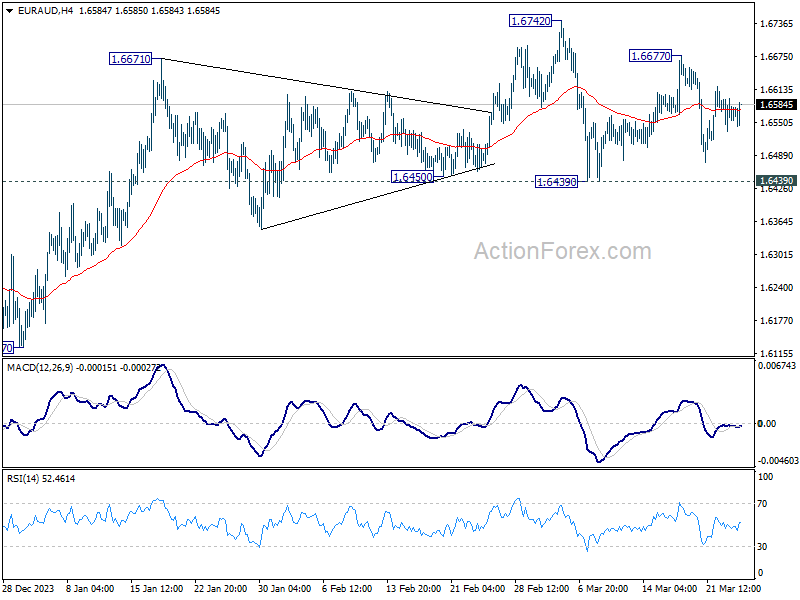
EUR/AUD Daily Outlook
Daily Pivots: (S1) 1.6538; (P) 1.6569; (R1) 1.6602; More...
Range trading continues in EUR/AUD and intraday bias remains neutral at this point. Near term outlook will stay cautiously bullish as long as 1.6439 support holds. On the upside, above 1.6677 will target 1.6742 first. Decisive break there will resume whole rise from 1.6127 and target 1.6844 resistance next.
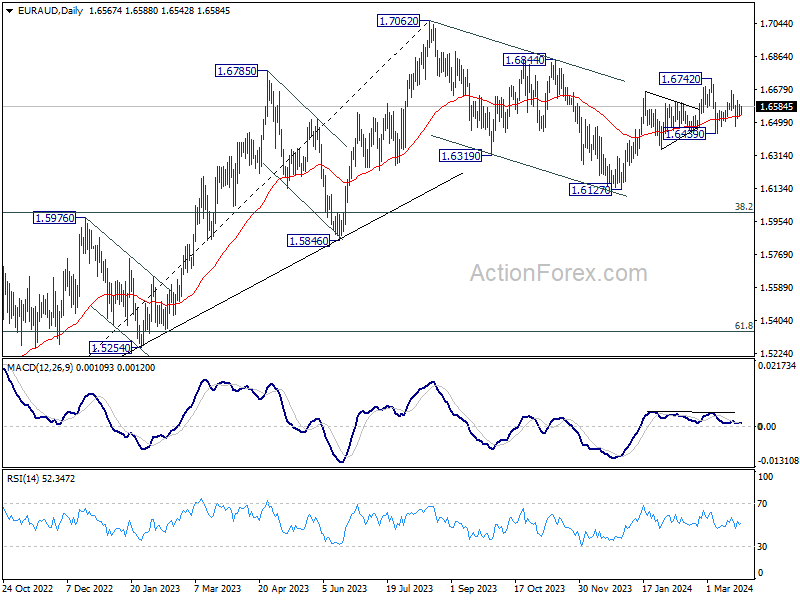
In the bigger picture, fall from 1.7062 medium term top is seen as a correction to the up trend from 1.4281 (2022 low). Break of 1.6844 resistance will argue that this up trend is ready to resume through 1.7062 high. In case of another fall, strong support should be seen around 1.5846 and 38.2% retracement of 1.4281 to 1.7062 at 1.6000 to bring rebound.
EUR/CHF Daily Outlook
Daily Pivots: (S1) 0.9710; (P) 0.9729; (R1) 0.9767; More..
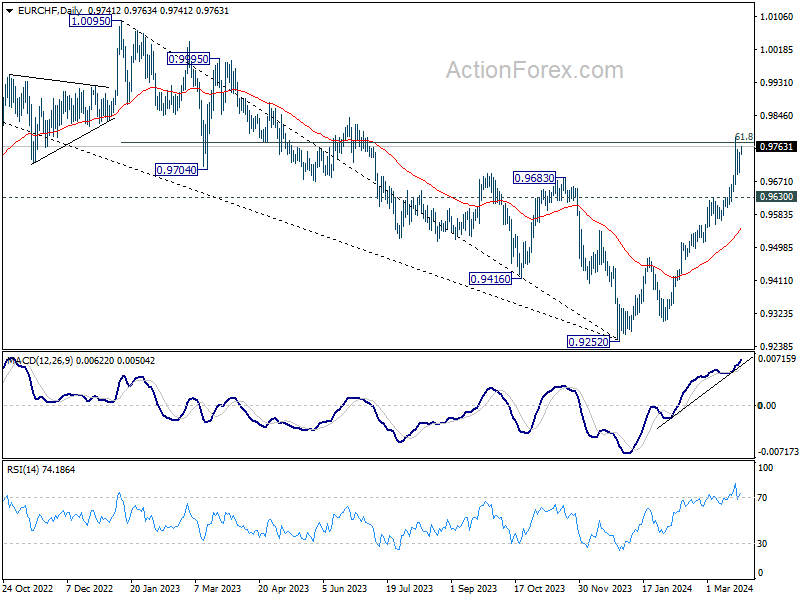
EUR/CHF is staying below 0.9786 temporary top despite today's recovery. Intraday bias remains neutral and more consolidations could be seen. but downside of retreat should be contained by 0.9630 resistance turned support to bring rebound. On the upside, above 0.9786 will resume the rally from 0.9252 towards 1.0095 resistance next.
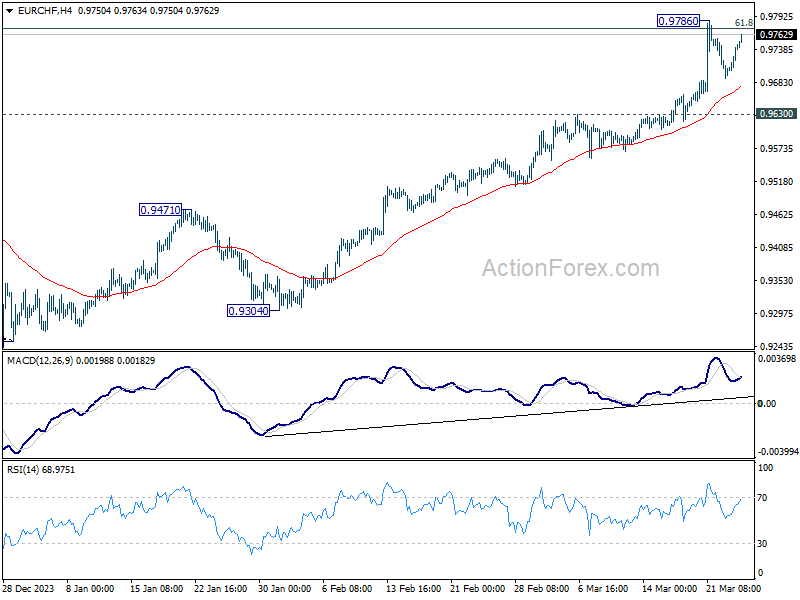
In the bigger picture, a medium term bottom should be in place at 0.9252 already, on bullish convergence condition in W MACD. Rise from there would now target 38.2% retracement of 1.2004 (2018 high) to 0.9252 (2023 low) at 1.0303, even as a correction to the down trend from 1.2004. This will remain the favored case as long as 55 D EMA (now at 0.9535) holds.
Swiss Franc Dips in Muted Trade, Bitcoin Eyes Uptrend Resumption
Swiss Franc traded broadly lower in Asian session today, amidst a backdrop of general market inactivity with all other major pairs and crosses staying inside Monday's range. Still, it remains to be seen whether the Franc's sell-off could extend beyond last week's lows, a downturn initiated by SNB's unexpected rate cut.
Meanwhile, Euro and Sterling appears to be benefitting slightly from buying against Swiss Franc. But Aussie is slightly stronger Australian despite weak consumer sentiment data. These contrast the softer performance of Dollar and Yen alongside Franc.
As European session presents limited data, with German Gfk consumer sentiment being an exception, market participants are shifting their focus towards the US, where upcoming durable goods orders and consumer confidence data may inject some much-needed volatility into the markets.
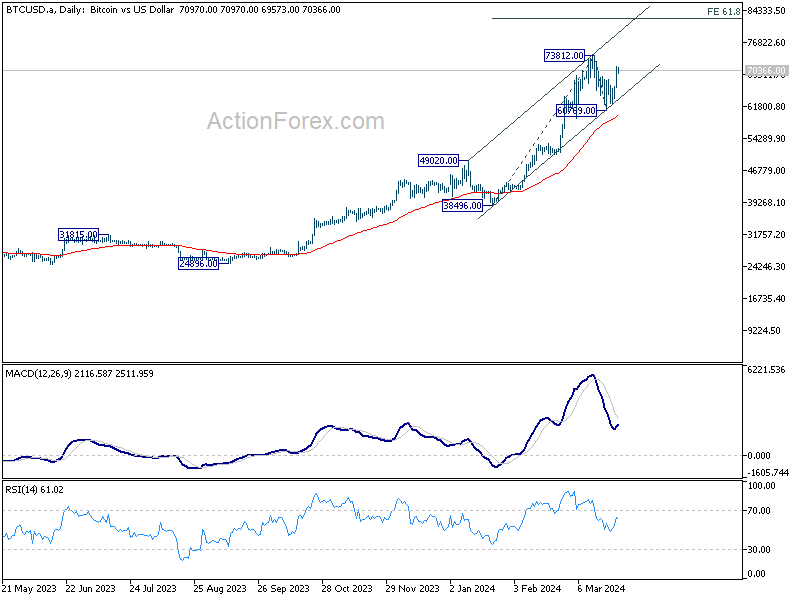
Technically, Bitcoin is back above 70k handle with this week's strong rebound. The development argues that correction from 73812 might have completed at 60769 already, after drawing support from medium term channel. Next focus is 73812 high and firm break there will pave the way to 61.8% projection of 38496 to 73812 from 60769 at 82594.
In Asia, at the time of writing, Nikkei is down -0.14%. Hong Kong HSI is up 0.25%. China shanghai SSE is down -0.52%. Singapore Strait Times is up 0.91%. Japan 10-year JGB yield is up 0.0060 at 0.742. Overnight, DOW fell -0.41%. S&P 500 fell -0.31%. NASDAQ fell -0.27%. 10-year yield rose 0.035 to 4.253.
Fed's Bostic eyes single rate cut in 2024, credits robust economy
Atlanta Fed President Raphael Bostic reiterated his anticipation just one interest-rate reduction within this year. Also, the first cut could happen later than previously envisioned, as Fed can "afford to be patient" as long as the economy holds up.
Bostic's noted that as long as the economic indicators—such as GDP growth, employment rates, and business activity—remain robust, "I'm not in a hurry to get inflation down to 2%."
"If it continues on a trajectory, I'm happy with that," he added.
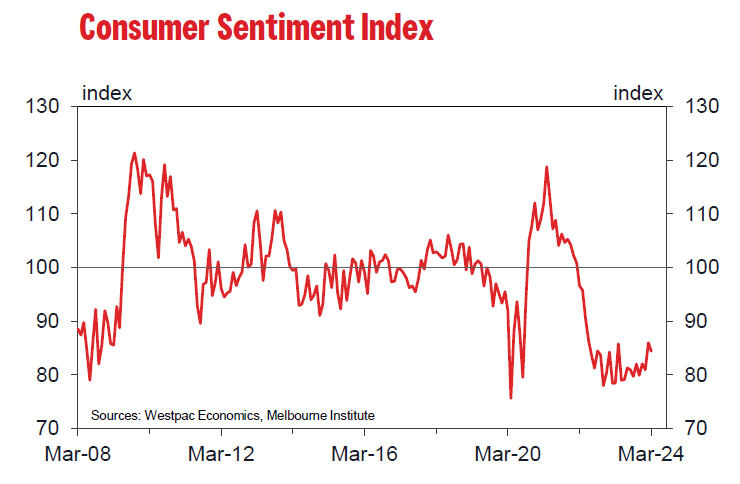
Australia's Westpac consumer sentiment dips -1.8% mom, RBA triggers sharp decline
In March, Westpac Consumer Sentiment Index in Australia dropped by -1.8% mom to 84.4. This downturn is attributed to renewed concerns about the near-term economic outlook, with fears regarding inflation and interest rate hikes only easing marginally.
The survey revealed a significant shift in sentiment in responses to the RBA's latest policy decision. Sentiment scores were markedly higher at 94.9 for those surveyed before the decision, compared to a lower 79.3 for those surveyed afterwards.
The persistence of consumer concerns, notably regarding inflation and interest rates, was evident. Many had harbored hopes for a more reassuring update from RBA on these fronts. Yet, the central bank's governor did not entirely dismiss the prospect of additional rate hikes. This stance likely contributed to dampening consumer sentiment, as individuals grappled with the implications for personal finances and economic conditions at large.
Looking ahead
Germany Gfk consumer sentiment is the only feature in European session. Later in the day, US will release durable goods orders, hour price index and consumer confidence.
EUR/CHF Daily Outlook
Daily Pivots: (S1) 0.9710; (P) 0.9729; (R1) 0.9767; More..
EUR/CHF is staying below 0.9786 temporary top despite today's recovery. Intraday bias remains neutral and more consolidations could be seen. but downside of retreat should be contained by 0.9630 resistance turned support to bring rebound. On the upside, above 0.9786 will resume the rally from 0.9252 towards 1.0095 resistance next.
In the bigger picture, a medium term bottom should be in place at 0.9252 already, on bullish convergence condition in W MACD. Rise from there would now target 38.2% retracement of 1.2004 (2018 high) to 0.9252 (2023 low) at 1.0303, even as a correction to the down trend from 1.2004. This will remain the favored case as long as 55 D EMA (now at 0.9535) holds.
Economic Indicators Update
| GMT | Ccy | Events | Actual | Forecast | Previous | Revised |
|---|---|---|---|---|---|---|
| 23:30 | AUD | Westpac Consumer Confidence Mar | -1.80% | 6.20% | ||
| 23:50 | JPY | Corporate Service Price Index Y/Y Feb | 2.10% | 2.00% | 2.10% | |
| 07:00 | EUR | Germany Gfk Consumer Confidence Apr | -27.8 | -29 | ||
| 12:30 | USD | Durable Goods Orders Feb | 1.30% | -6.20% | ||
| 12:30 | USD | Durable Goods Orders ex-Trans Feb | 0.40% | -0.40% | ||
| 12:30 | USD | Durable Goods Orders ex Defense Feb | 1.30% | -7.40% | ||
| 13:00 | USD | S&P/CS Composite-20 HPI Y/Y Jan | 6.20% | 6.10% | ||
| 13:00 | USD | Housing Price Index M/M Jan | 0.20% | 0.10% | ||
| 14:00 | USD | Consumer Confidence Mar | 107.2 | 106.7 |
Technical Outlook and Review
DXY:
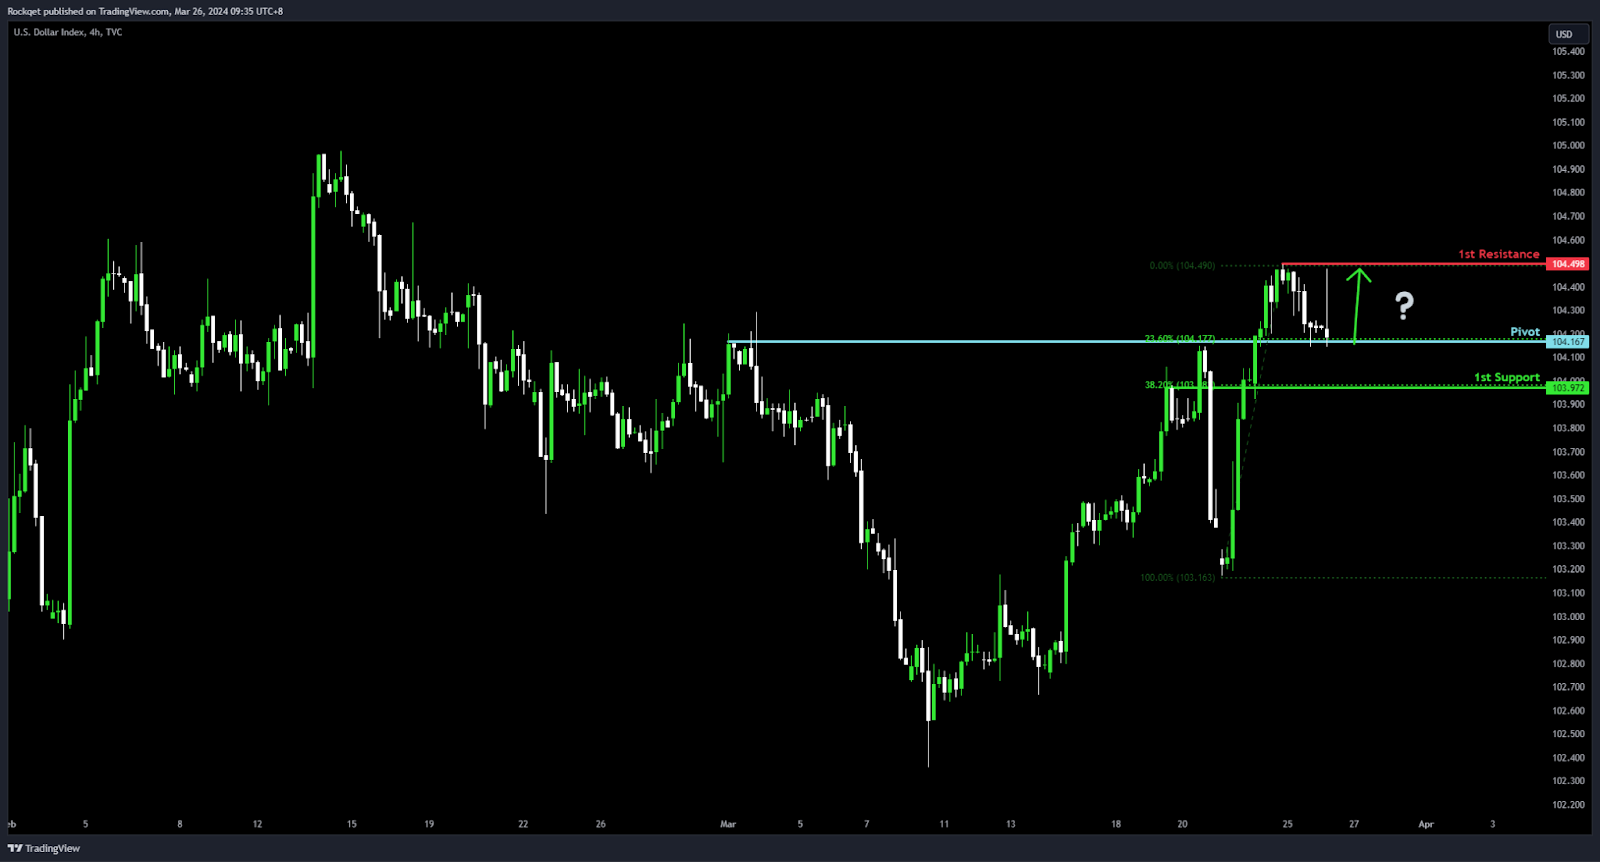
Potential Direction: Bullish
Overall momentum of the chart: Bullish
Price could potentially make a Bullish bounce off pivot and head towards 1st resistance
Pivot: 104.16
Supporting reasons: Acts as an Overlap support and aligns with a 23.60% Fibonacci Retracement, providing a strong base for potential upward movements.
1st support: 103.92
Supporting reasons: Offers Pullback support at a 38.20% Fibonacci Retracement level, representing a key area where previous buying interest has successfully countered downward trends
1st resistance: 104.49
Supporting reasons: Serves as Multi-swing high resistance, posing a significant hurdle that needs to be overcome for the bullish momentum to continue.
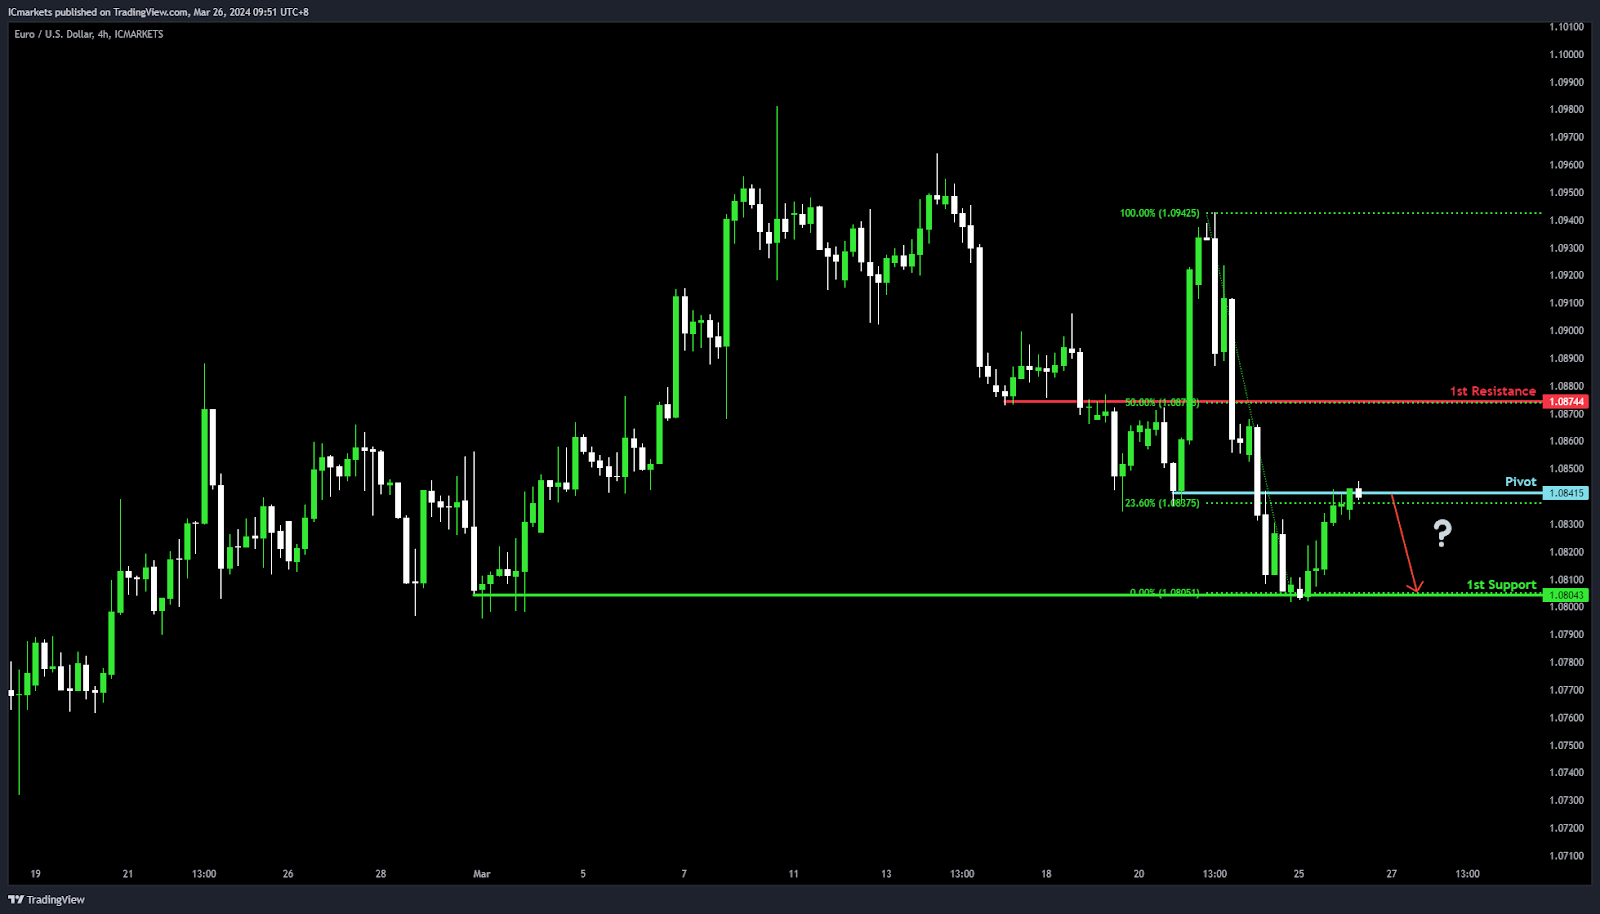
EUR/USD:
Potential Direction: Bearish
Overall momentum of the chart: Bearish
Price could potentially make a Bearish reaction off pivot and drop to 1st support
Pivot: 1.0841
Supporting reasons: Identified as an Overlap resistance, indicating a crucial level where selling pressure may intensify, pushing the price downwards as traders react to this technical barrier.
1st support: 1.0804
Supporting reasons: Acts as a Multi-swing low support, marking a significant floor where the market has previously found stability and buyers have entered, potentially halting further declines.
1st resistance: 1.0874
Supporting reasons: Serves as Pullback resistance, complemented by a 50% Fibonacci Retracement, highlighting a pivotal area where the upward movement might face resistance, making it a critical point for bearish trend continuation.
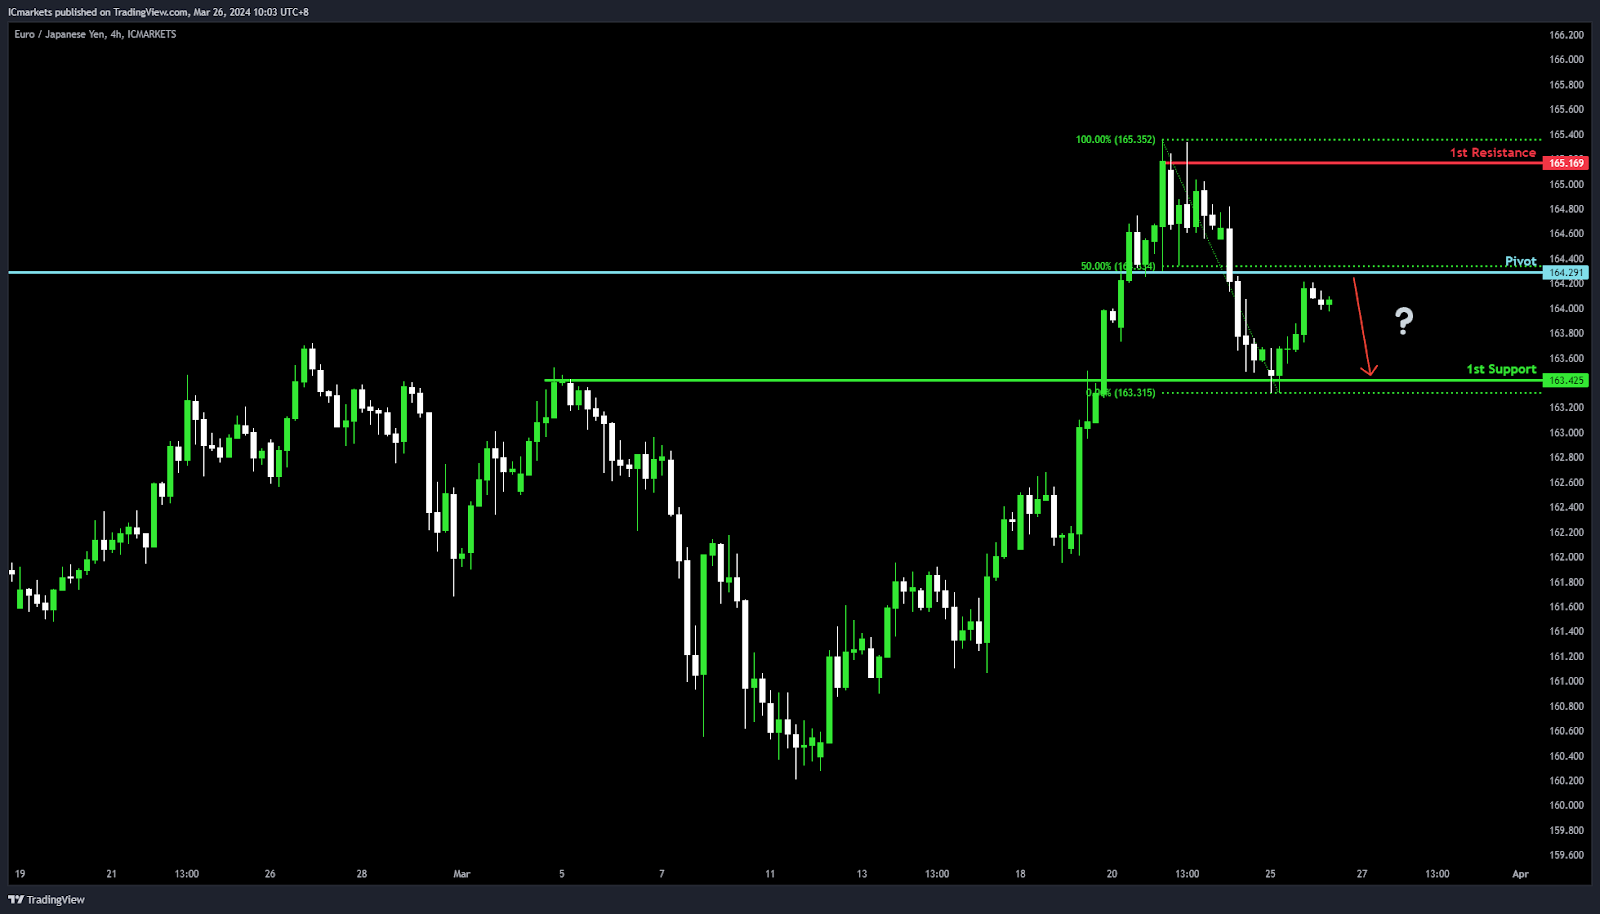
EUR/JPY:
Potential Direction: Bearish
Overall momentum of the chart: Bullish
Price could potentially make a: Bearish reaction off pivot and drop to 1st support
Pivot: 164.29
Supporting reasons: Acts as Pullback resistance and aligns with a 50% Fibonacci Retracement, marking a key point where sellers might start pushing prices down, indicating a possible shift in price direction.
1st support: 163.42
Supporting reasons: Serves as an Overlap support, a crucial area where buyers have historically stepped in, suggesting a strong base that could halt the bearish momentum.
1st resistance: 165.16
Supporting reasons: Characterized by Multi-swing high resistance, a significant barrier that has previously capped upward movements, making it a pivotal point for monitoring potential reversals or continuations of the bullish trend.
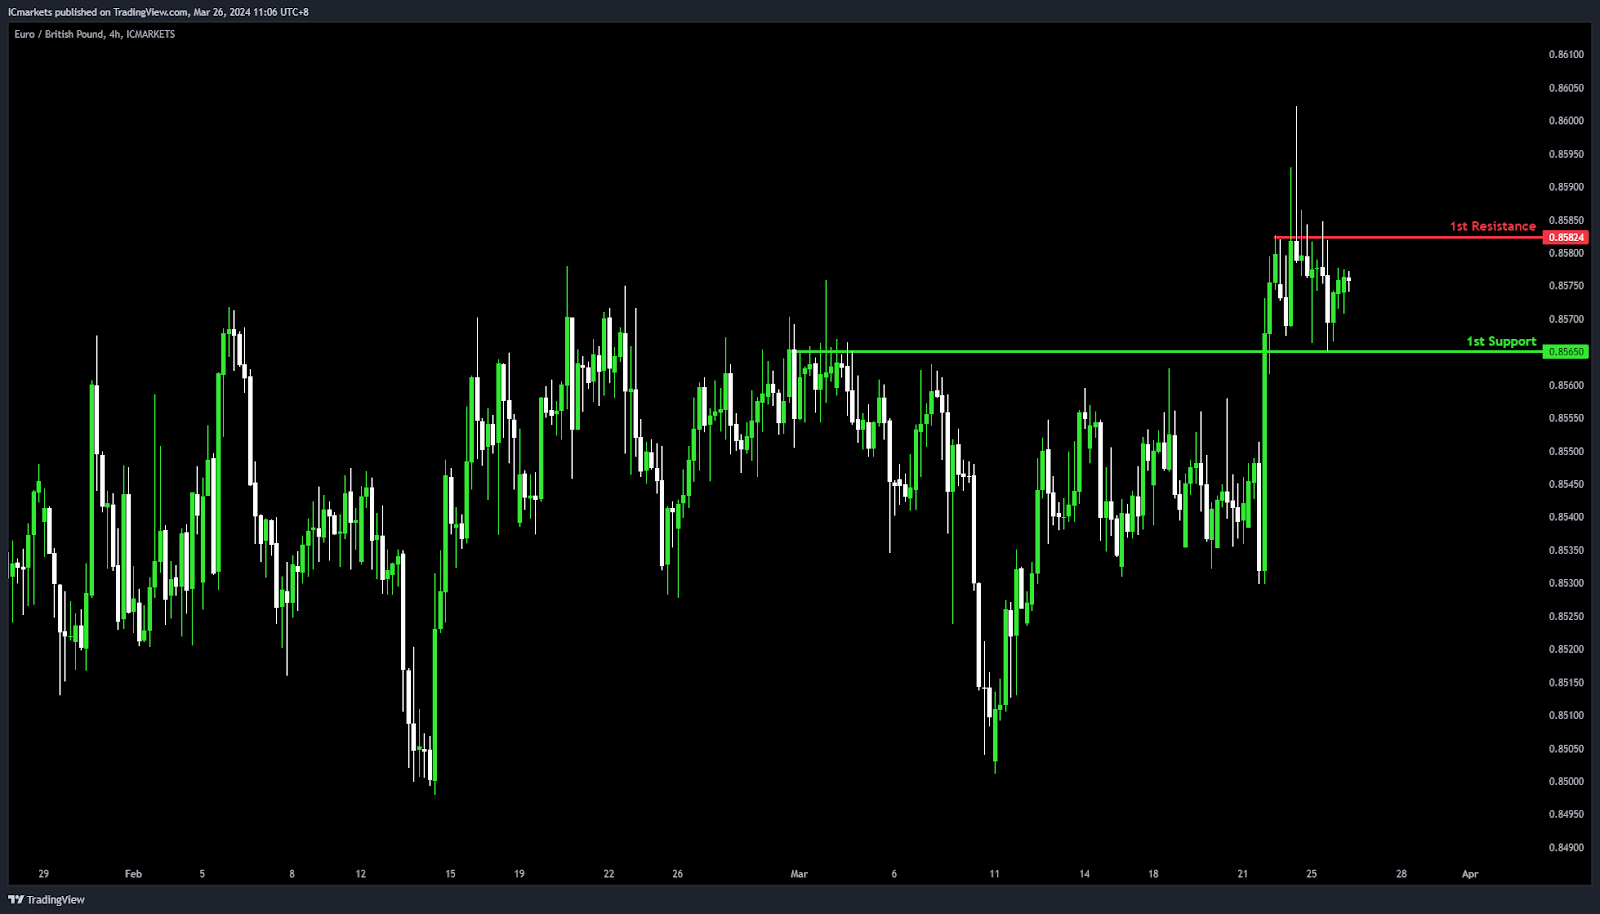
EUR/GBP:
Potential Direction: Neutral
Overall momentum of the chart: Neutral
Price could potentially make a: Fluctuation between the 1st resistance and 1st support level.
1st support: 0.8565
Supporting reasons: Acts as an Overlap support, a key level where buying interest has historically been strong enough to stop further declines and potentially initiate a bounce, indicating its role as a solid base for the price.
1st resistance: 0.8582
Supporting reasons: Characterized by Multi-swing high resistance, marking a significant ceiling that has previously limited upward movements, highlighting its importance as a potential turning point for the price, possibly capping gains and maintaining the current range.
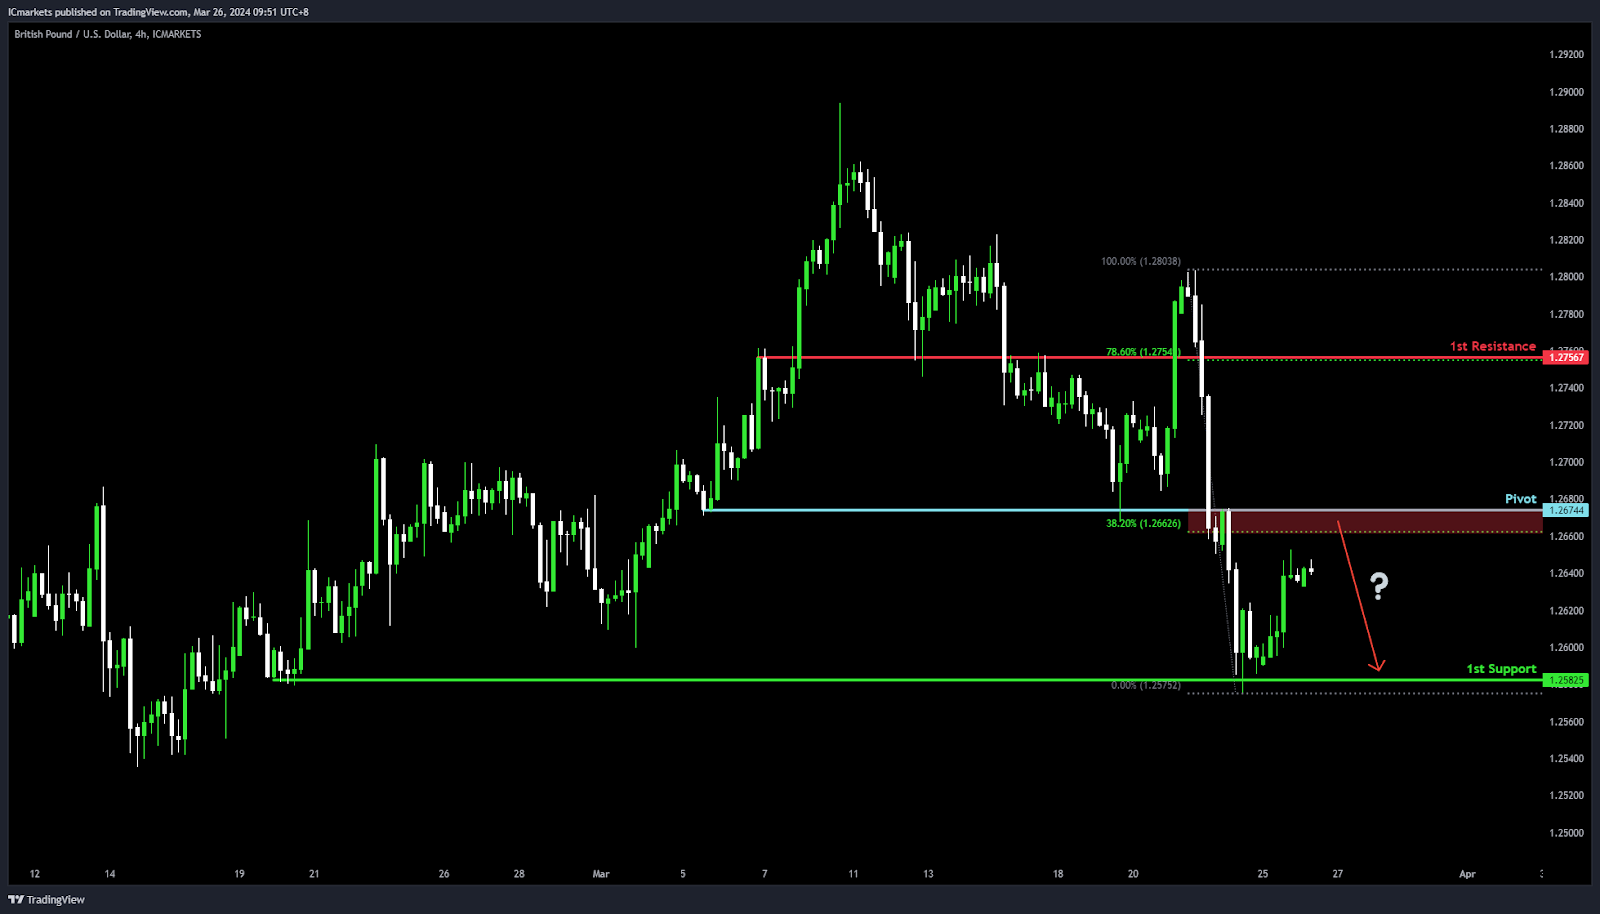
GBP/USD:
Potential Direction: Bearish
Overall momentum of the chart: Bearish
Price could potentially make a: Bearish reaction off pivot and drop to 1st support
Pivot: 1.2674
Supporting reasons: Serves as an Overlap resistance and aligns with a 38.20% Fibonacci Retracement, making it a key level where sellers could gain an upper hand, driving the price lower as it acts as a technical barrier to upward movements.
1st support: 1.2582
Supporting reasons: Identified as Multi-swing low support, this level represents a significant historical floor where buying interest has previously emerged to stall further declines, suggesting it could once again provide a basis for a potential rebound or slow down the bearish momentum.
1st resistance: 1.2756
Supporting reasons: Functions as Pullback resistance, reinforced by a 78.60% Fibonacci Retracement. This delineates a critical threshold that, if unbroken, could cement the bearish outlook.
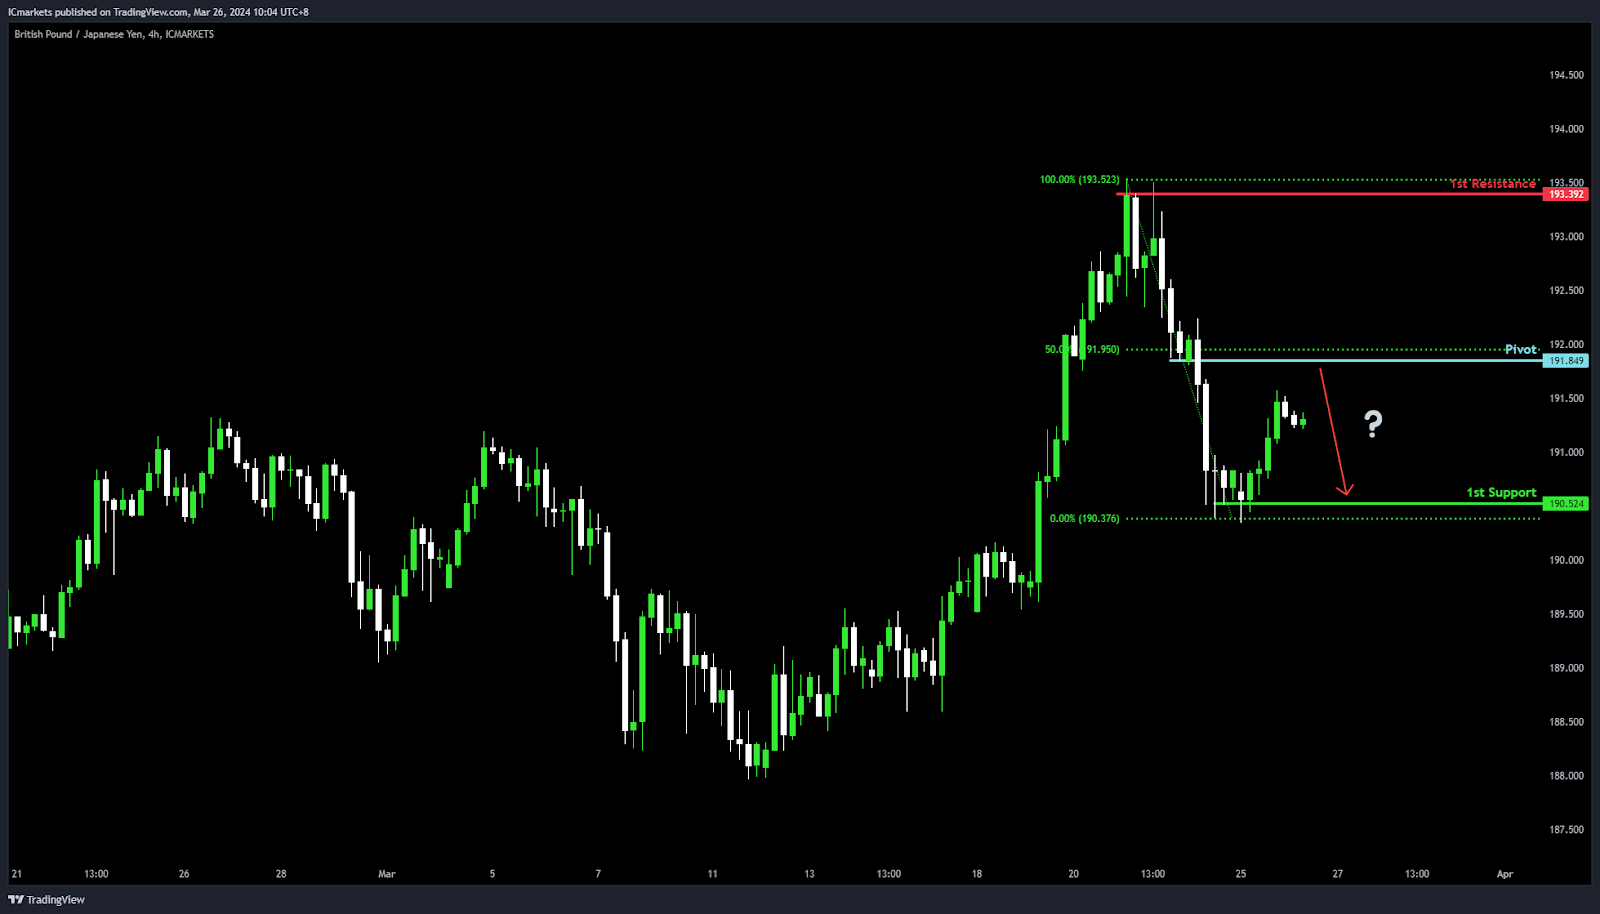
GBP/JPY:
Potential Direction: Bearish
Overall momentum of the chart: Bullish
Price could potentially make a: Bearish reaction off pivot and drop to 1st support
Pivot: 191.84
Supporting reasons: Acts as Pullback resistance with a 50% Fibonacci Retracement, marking a key level where sellers might start pushing prices down, showing it’s an important spot for possible changes in how the price moves.
1st support: 190.52
Supporting reasons: Serves as Multi-swing low support, a strong area that could stop the price from falling further, indicating it’s a crucial base for potentially halting the bearish momentum.
1st resistance: 193.39
Supporting reasons: Known as Multi-swing high resistance, a level that has previously stopped the price from climbing higher, marking it as a significant barrier for price movements.
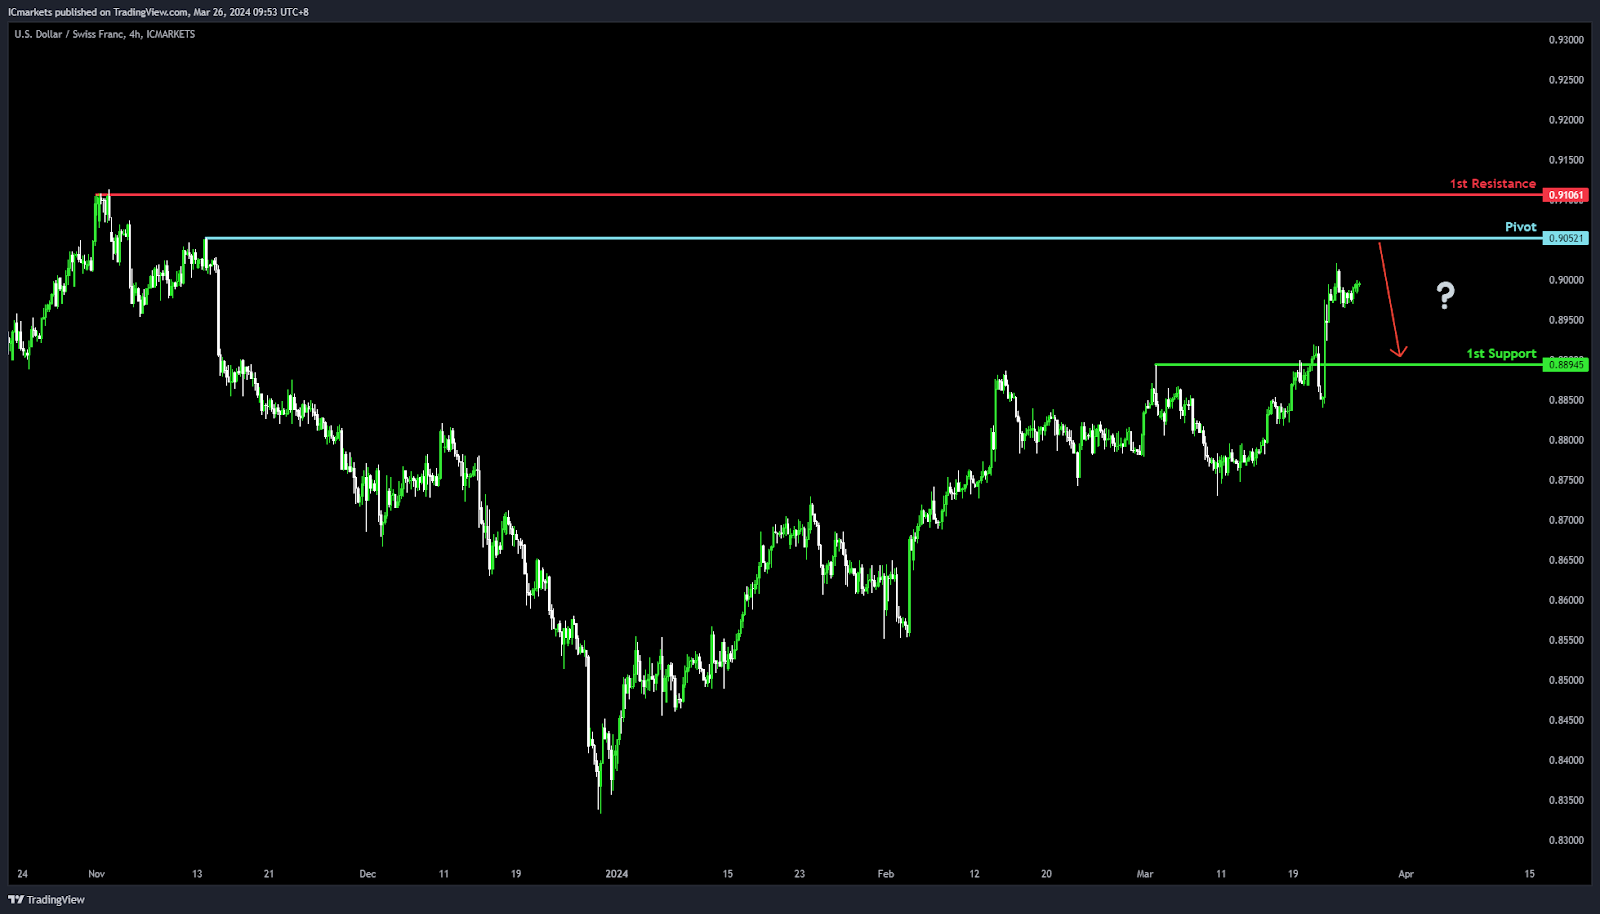
USD/CHF:
Potential Direction Bearish
Overall momentum of the chart Bullish
Price could potentially make a bearish reaction off pivot and drop to 1st support
Pivot 0.9052
Supporting reasons: Swing high resistance, marking a significant level where the price has previously encountered resistance, potentially triggering a reversal or halt in upward momentum
1st support 0.8894
Supporting reasons: Pullback support, indicating a level where the market has found support in the past, offering a potential area for price stabilization or a rebound after a decline
1st Resistance 0.9106
Supporting reasons: Multi-swing high resistance, highlighting a critical barrier that has capped previous attempts to push higher, making it a pivotal point for monitoring potential bearish reversals or continuation of the bullish trend
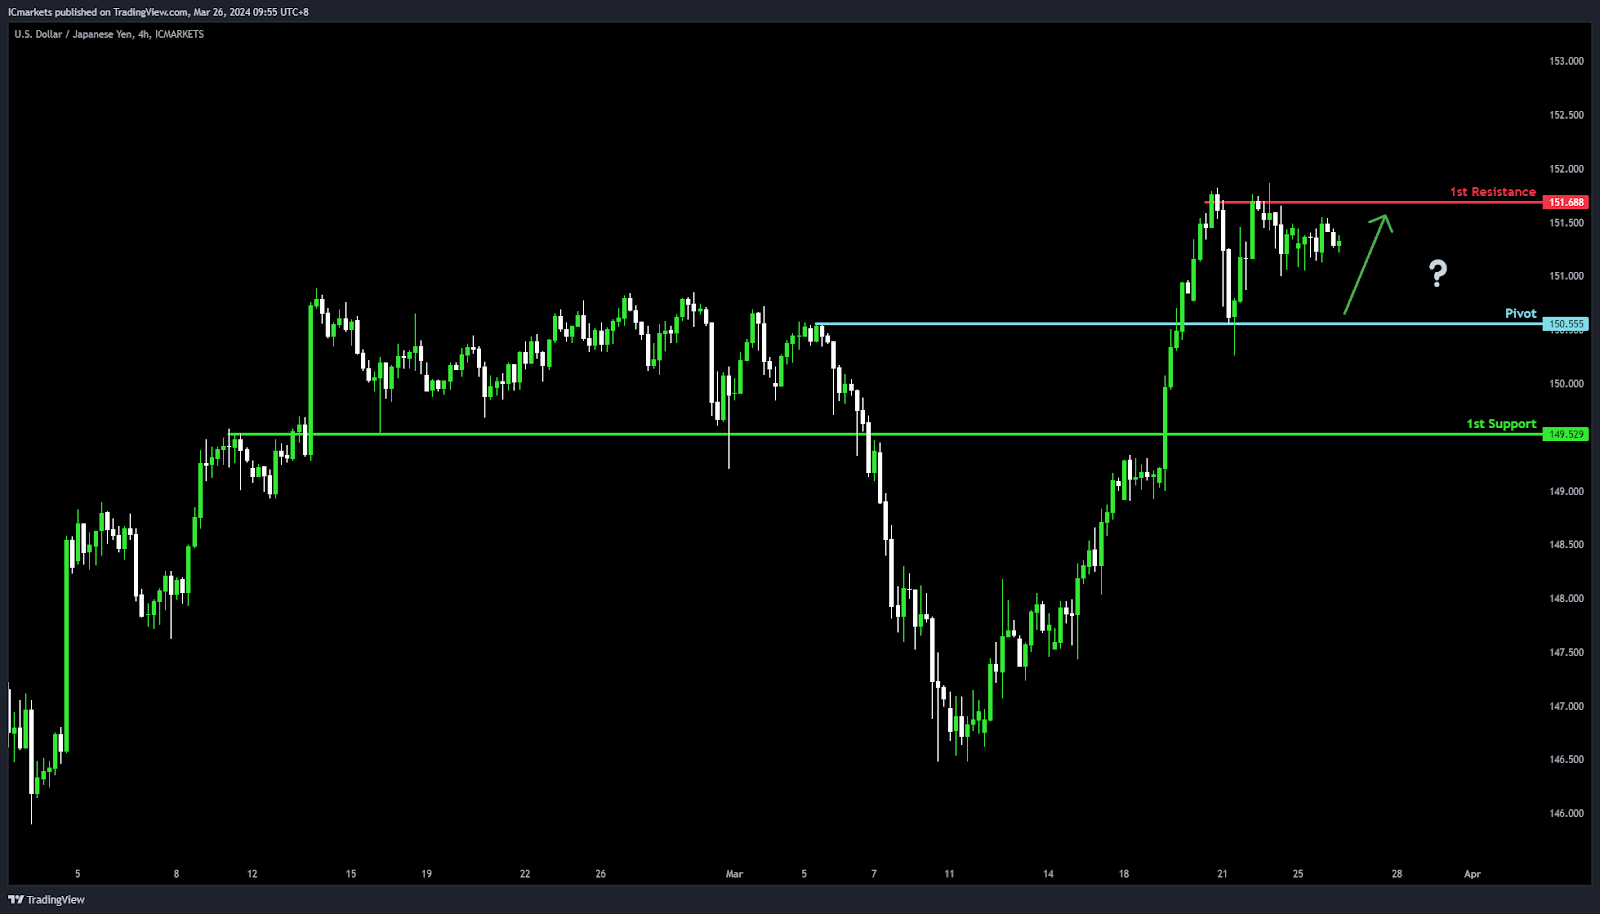
USD/JPY:
Potential Direction: Bullish
Overall momentum of the chart: Bullish
Price could potentially make a bullish bounce-off pivot and head toward 1st resistance
Pivot: 150.55
Supporting reasons: An Overlap support, indicating a level where buying interest is typically strong, suggesting a solid foundation for a potential upward move
1st support: 149.52
Supporting reasons: Pullback support, represents a key area where the market has historically found buyers ready to step in, highlighting its importance for sustaining bullish momentum
1st resistance: 151.68
Supporting reasons: Multi-swing high resistance, marking a significant barrier that has previously capped upward movements, making it a critical point for bulls to overcome for a continued bullish
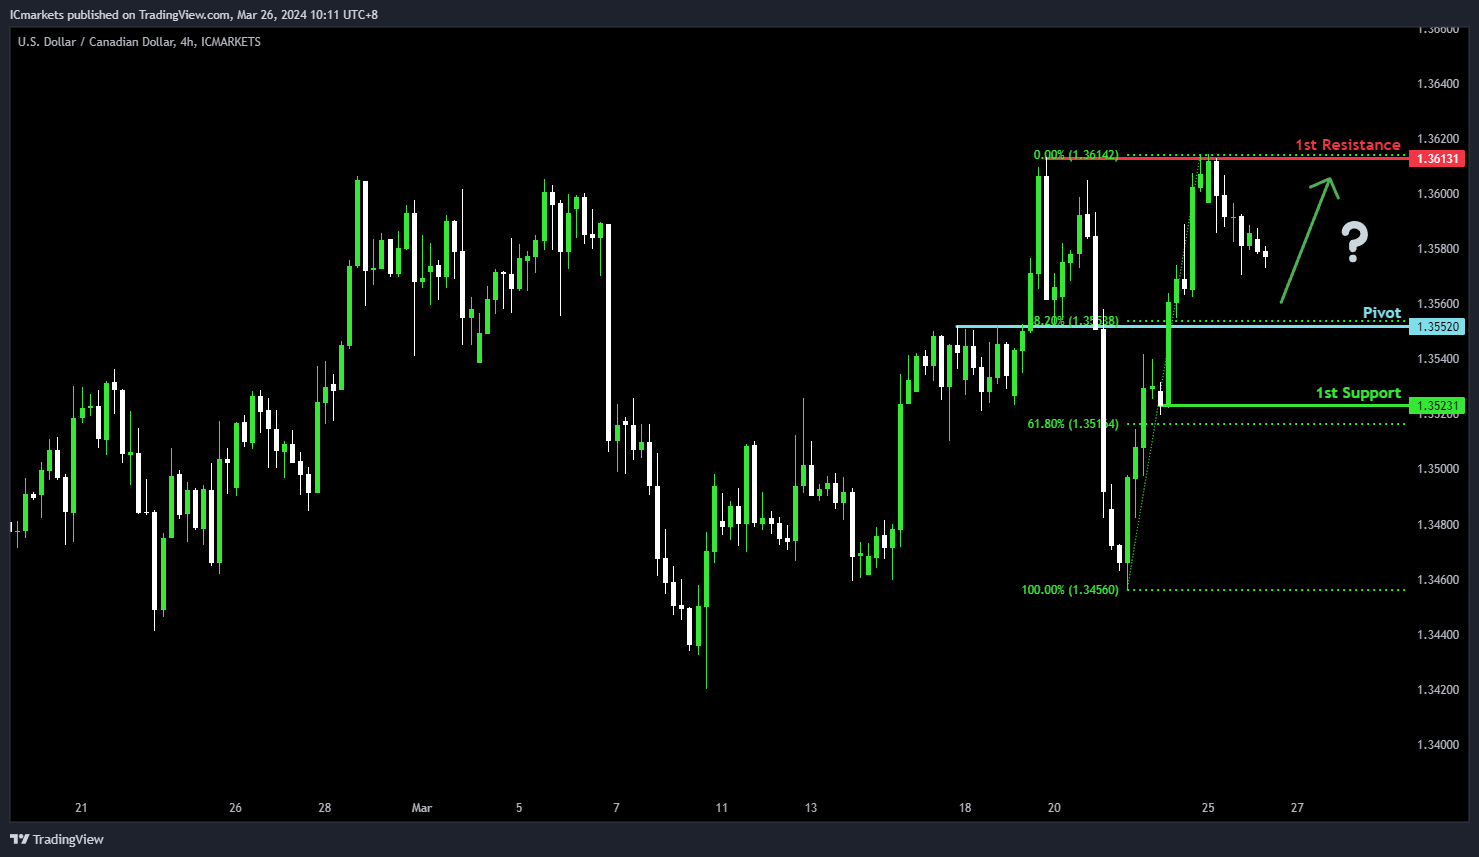
USD/CAD:
Potential Direction: Medium Bearish
Overall momentum of the chart: Bullish
Price could potentially fall towards the pivot and make a bullish bounce to rise towards the 1st resistance.
Pivot: 1.3552
Supporting reasons: This level acts as an overlap support that aligns close to a 38.20% Fibonacci retracement, potentially initiating a bullish reversal if the level holds as support.
1st Support: 1.3523
Supporting reasons: This level acts as a pullback support that aligns close to a 61.80% Fibonacci retracement, indicating a level where price has found strong support in the past.
1st Resistance: 1.3613
Supporting reasons: This level is identified as a multi-swing-high resistance, aligning with a 78.60% Fibonacci retracement, marking it as a critical threshold for bullish momentum to overcome; resistance at this level could cap further upside movements.
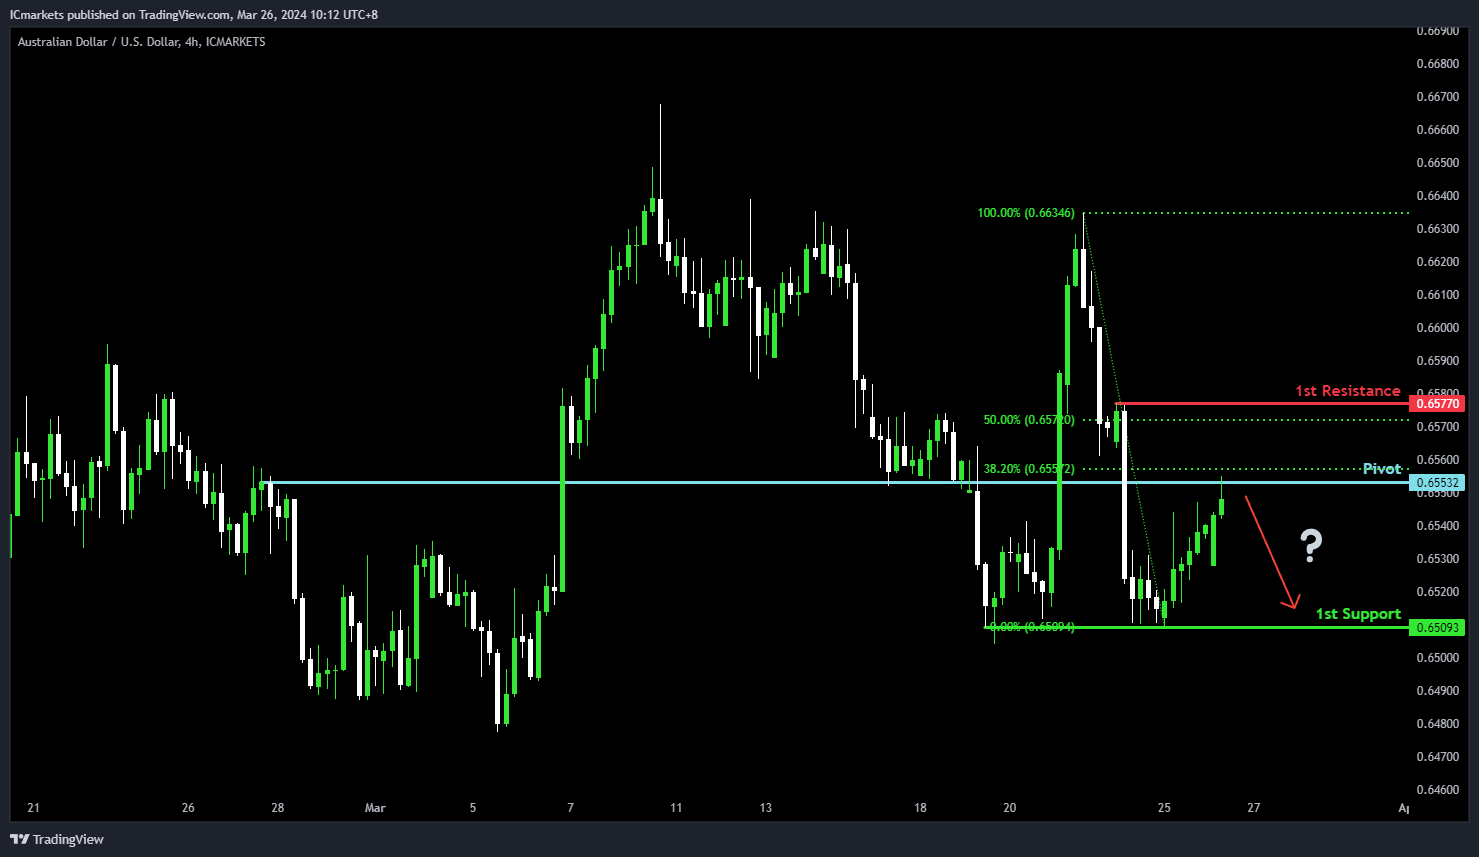
AUD/USD:
Potential Direction: Medium Bullish
Overall momentum of the chart: Bearish
Price could potentially rise toward the pivot to make a bearish reaction and then drop towards the 1st support.
Pivot: 0.6553
Supporting reasons: This level acts as an overlap resistance that aligns close to the 38.20% Fibonacci retracement, potentially initiating a bearish reversal if the level holds as resistance.
1st Support: 0.6509
Supporting reasons: This level acts as a pullback support, indicating a level where price has found strong support in the past.
1st Resistance: 0.6577
Supporting reasons: This level is identified as a pullback resistance that aligns close to a 50.0% Fibonacci retracement, marking it as a critical threshold for bullish momentum to overcome; resistance at this level could cap further upside movements.
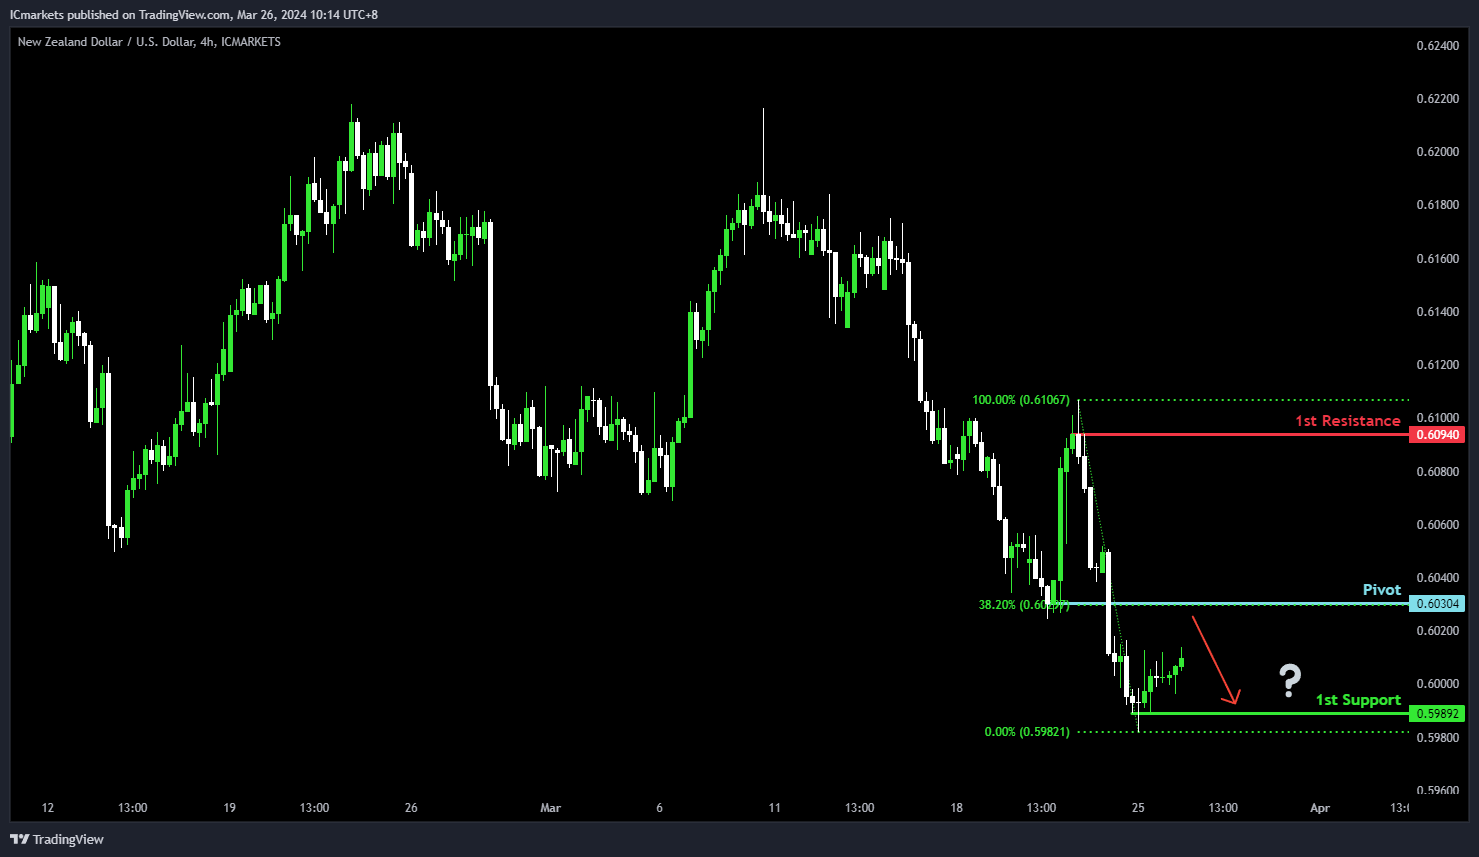
NZD/USD
Potential Direction: Weak Bullish
Overall momentum of the chart: Bearish
Price could potentially rise toward the pivot to make a bearish reaction and then drop towards the 1st support.
Pivot: 0.6030
Supporting reasons: This level acts as a pullback resistance that aligns with the 38.20% Fibonacci retracement, potentially initiating a bearish reversal if the level holds as resistance.
1st Support: 0.5989
Supporting reasons: This level acts as a pullback support, indicating a level where price has found strong support in the past.
1st Resistance: 0.6094
Supporting reasons: This level is identified as a pullback resistance, marking it as a critical threshold for bullish momentum to overcome; resistance at this level could cap further upside movements.
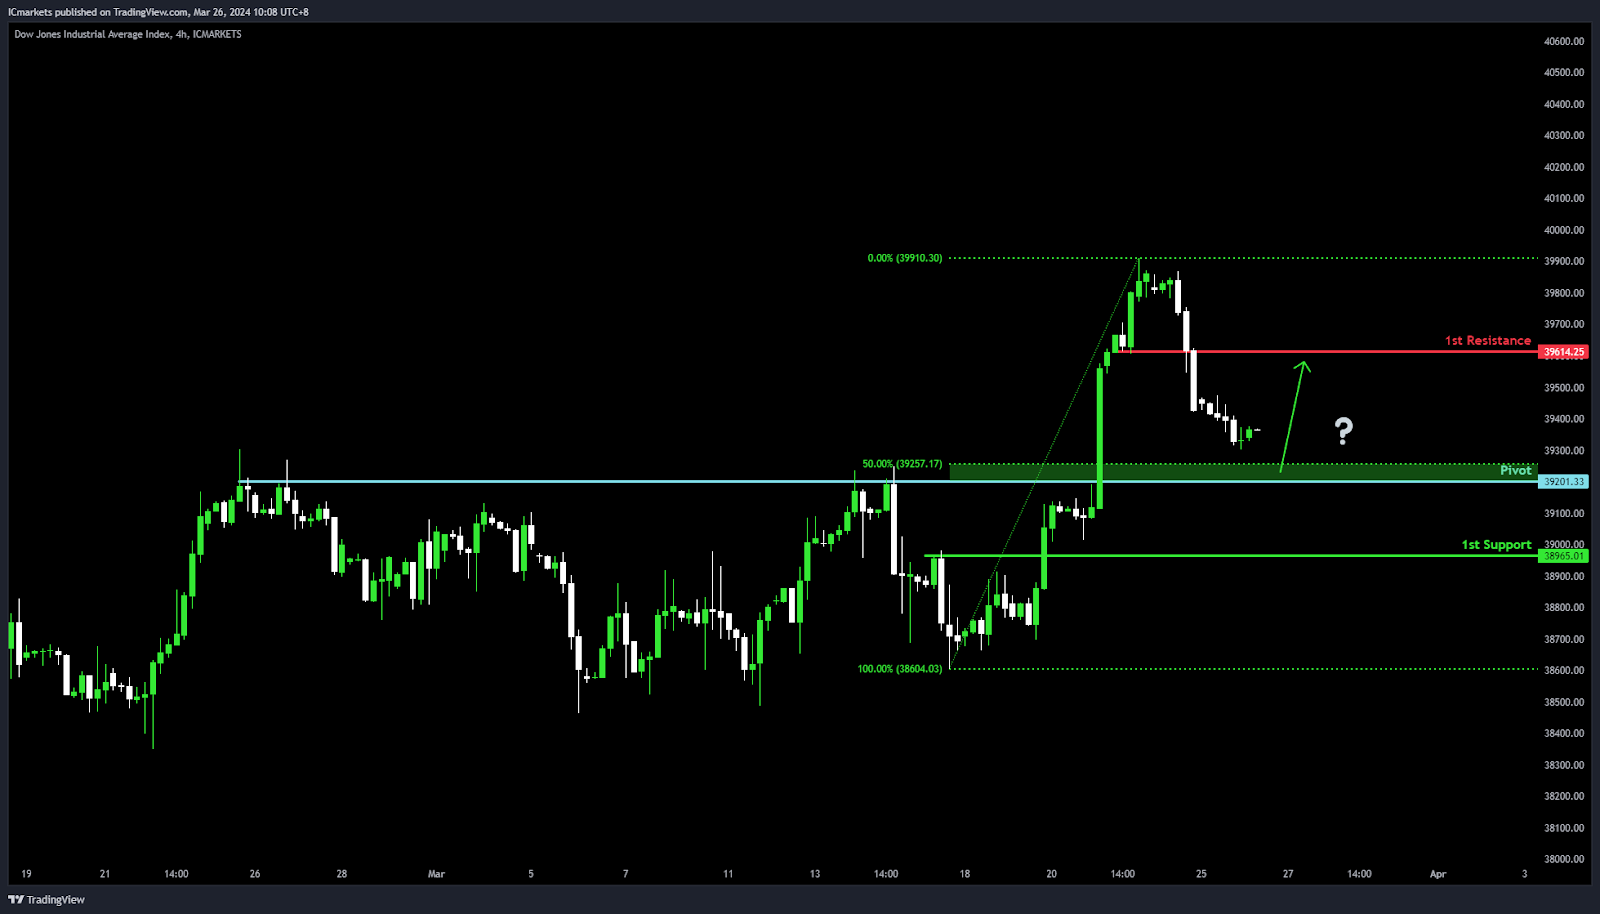
DJ30:
Potential Direction: Weak Bullish
Overall momentum of the chart: Bullish
Price could potentially make a bullish reaction off the pivot and rise towards the 1st resistance
Pivot: 39,201.33
Supporting reasons: This level acts as a pullback support, potentially initiating a bullish reversal if the level holds as support.
1st Support: 38,965.01
Supporting reasons: This level acts as a pullback support, indicating a level where price has found strong support in the past.
1st Resistance: 39,614.25
Supporting reasons: This level is identified as a pullback resistance, marking it as a critical threshold for bullish momentum to overcome; resistance at this level could cap further upside movements.
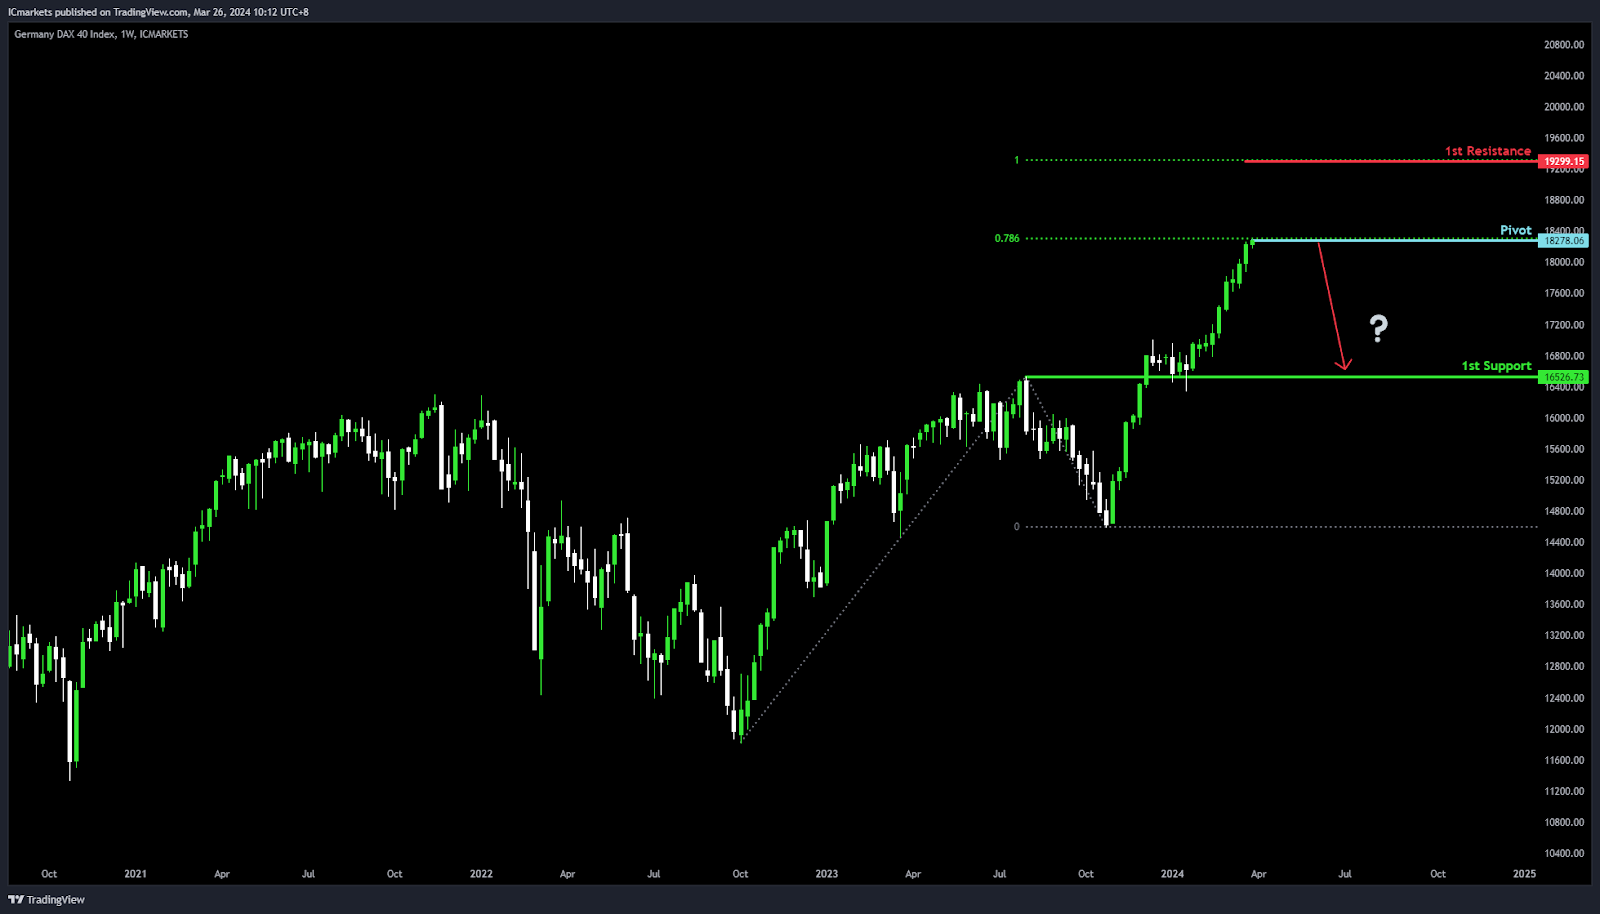
GER40:
Potential Direction: Weak Bearish
Overall momentum of the chart: Bullish
Price could potentially rise toward the pivot to make a bearish reaction and then drop towards the 1st support.
Pivot: 18,278.06
Supporting reasons: This level acts as a pullback resistance that aligns with a 78.60% Fibonacci projection, potentially initiating a bearish reversal if the level holds as resistance.
1st Support: 16,526.73
Supporting reasons: This level acts as an overlap support, indicating a level where price has found strong support in the past.
1st Resistance: 19,299.15
Supporting reasons: This level is identified as a resistance level that aligns with a 100.00% Fibonacci projection, marking it as a critical threshold for bullish momentum to overcome; resistance at this level could cap further upside movements.
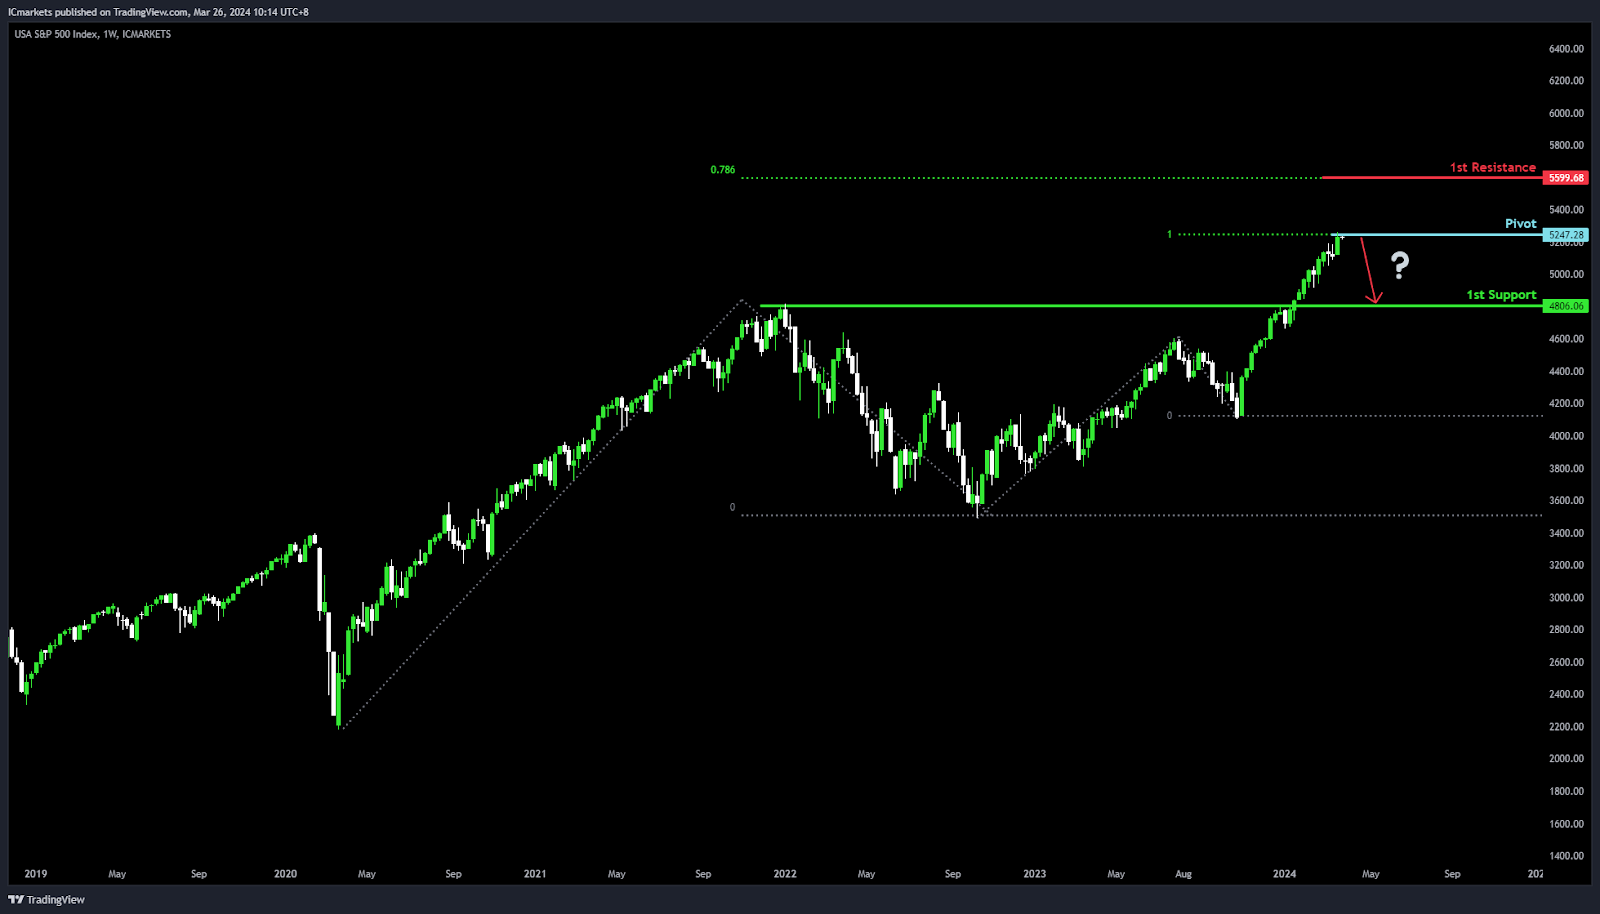
US500:
Potential Direction: Weak Bearish
Overall momentum of the chart: Bullish
Price could potentially rise toward the pivot to make a bearish reaction and then drop towards the 1st support.
Pivot: 5,247.28
Supporting reasons: This level acts as a pullback resistance that aligns with a 100.00% Fibonacci projection, potentially initiating a bearish reversal if the level holds as resistance.
1st Support: 4,806.06
Supporting reasons: This level acts as a pullback support, indicating a level where price has found strong support in the past.
1st Resistance: 5,599.68
Supporting reasons: This level is identified as a resistance level that aligns with a 78.60% Fibonacci projection, marking it as a critical threshold for bullish momentum to overcome; resistance at this level could cap further upside movements.
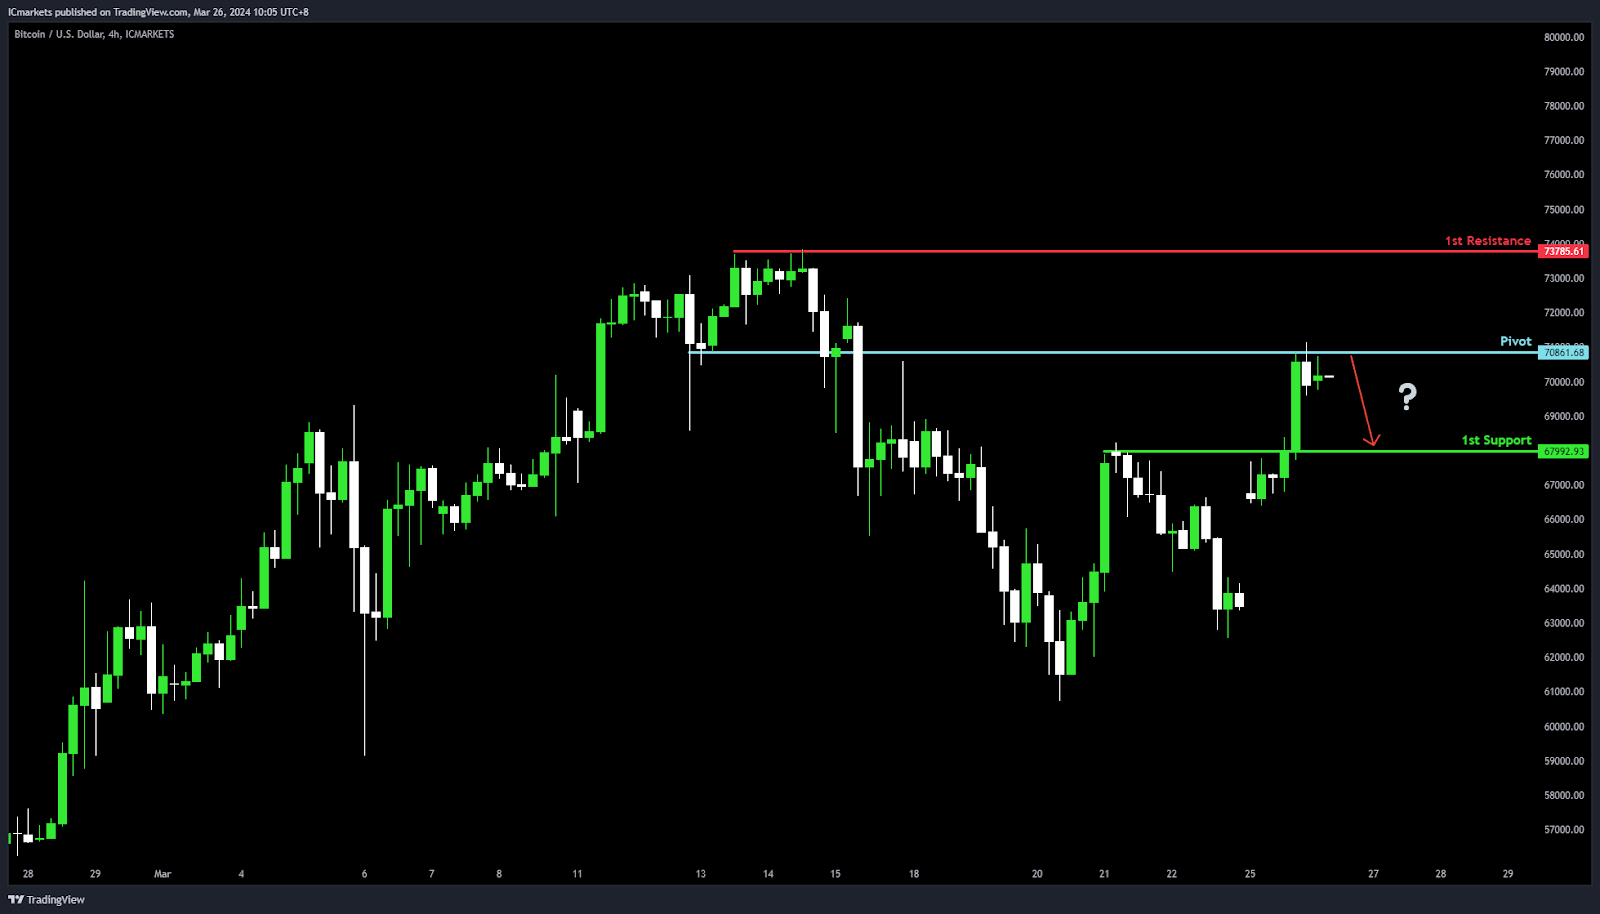
BTC/USD:
Potential Direction: Weak Bearish
Overall momentum of the chart: Bullish
Price could potentially rise toward the pivot to make a bearish reaction and then drop towards the 1st support.
Pivot: 70,861.68
Supporting reasons: This level acts as an overlap resistance, potentially initiating a bearish reversal if the level holds as resistance.
1st Support: 67,992.93
Supporting reasons: This level acts as a pullback support, indicating a level where price has found strong support in the past.
1st Resistance: 73,785.61
Supporting reasons: This level is identified as a swing-high resistance at the all-time high marking it as a critical threshold for bullish momentum to overcome; resistance at this level could cap further upside movements.
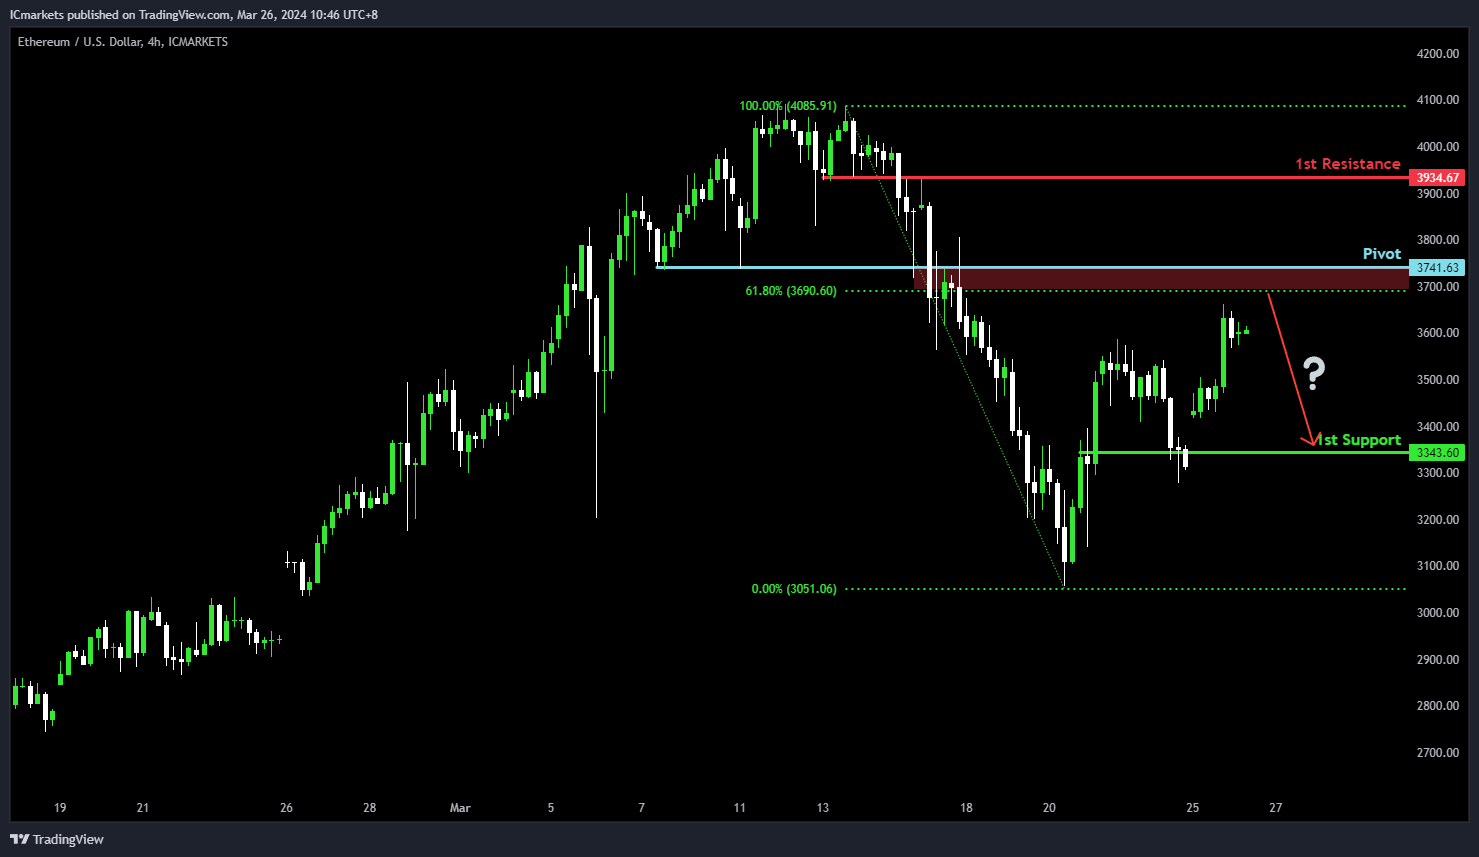
ETH/USD:
Potential Direction: Weak Bearish
Overall momentum of the chart: Bullish
Price could potentially rise toward the pivot to make a bearish reaction and then drop towards the 1st support.
Pivot: 3,741.63
Supporting reasons: This level acts as an overlap resistance that aligns close to a 61.80% Fibonacci retracement, potentially initiating a bearish reversal if the level holds as resistance.
1st Support: 3,343.60
Supporting reasons: This level acts as a pullback support, indicating a level where price has found strong support in the past.
1st Resistance: 3,934.64
Supporting reasons: This level is identified as an overlap resistance, aligning close to a 50.00% Fibonacci retracement, marking it as a critical threshold for bullish momentum to overcome; resistance at this level could cap further upside movements.
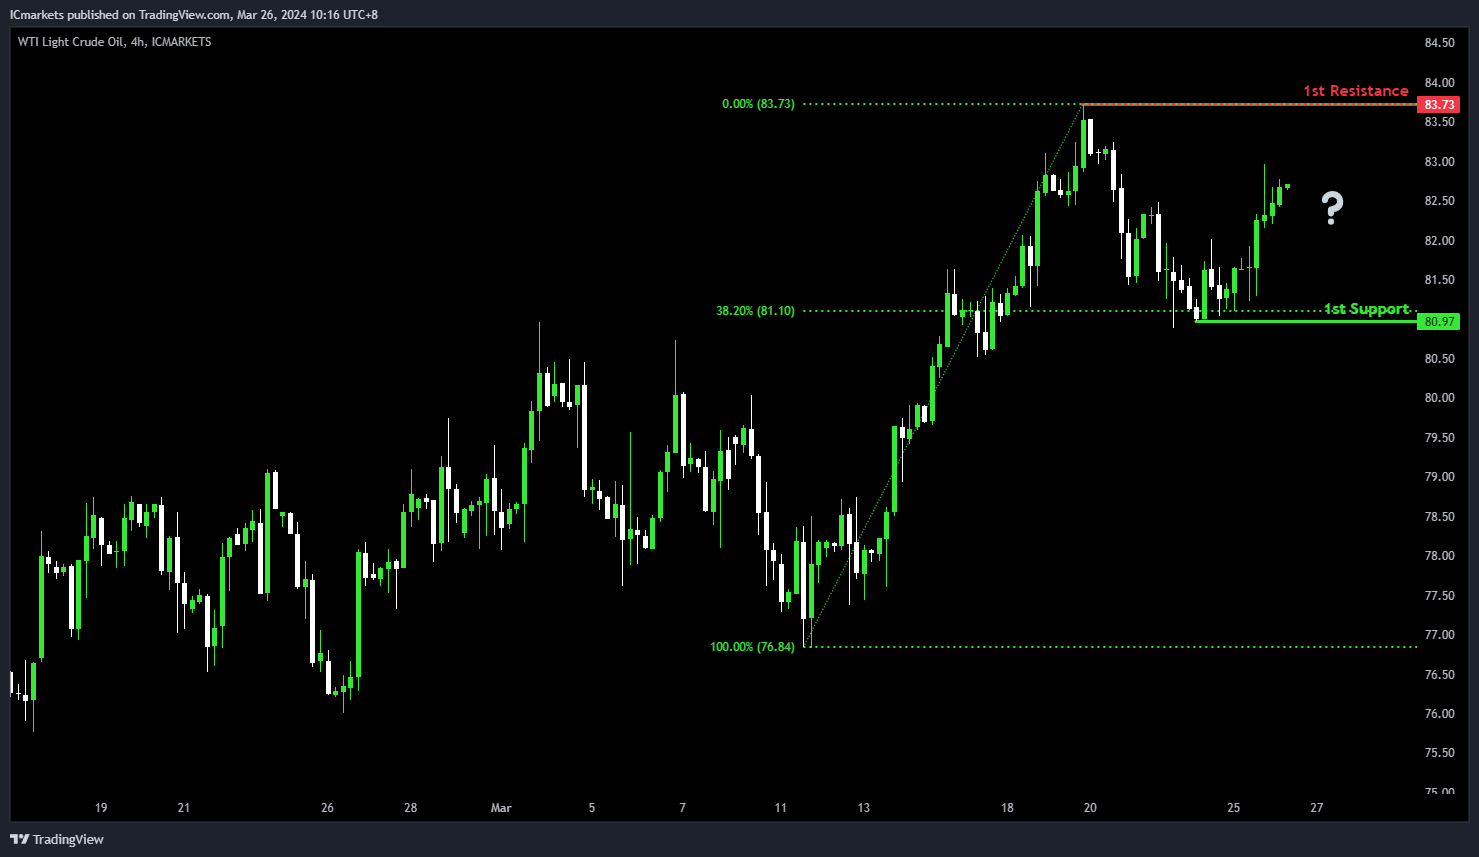
WTI/USD (Oil):
Potential Direction: Medium Bullish
Overall momentum of the chart: Neutral
Price could potentially make a bullish rise towards the 1st resistance.
1st Support: 80.97
Supporting reasons: This level acts as a pullback support that aligns with a 38.20% Fibonacci retracement, indicating a level where price has found strong support in the past.
1st Resistance: 83.73
Supporting reasons: This level is identified as a swing-high resistance, marking it as a critical threshold for bullish momentum to overcome; resistance at this level could cap further upside movements.
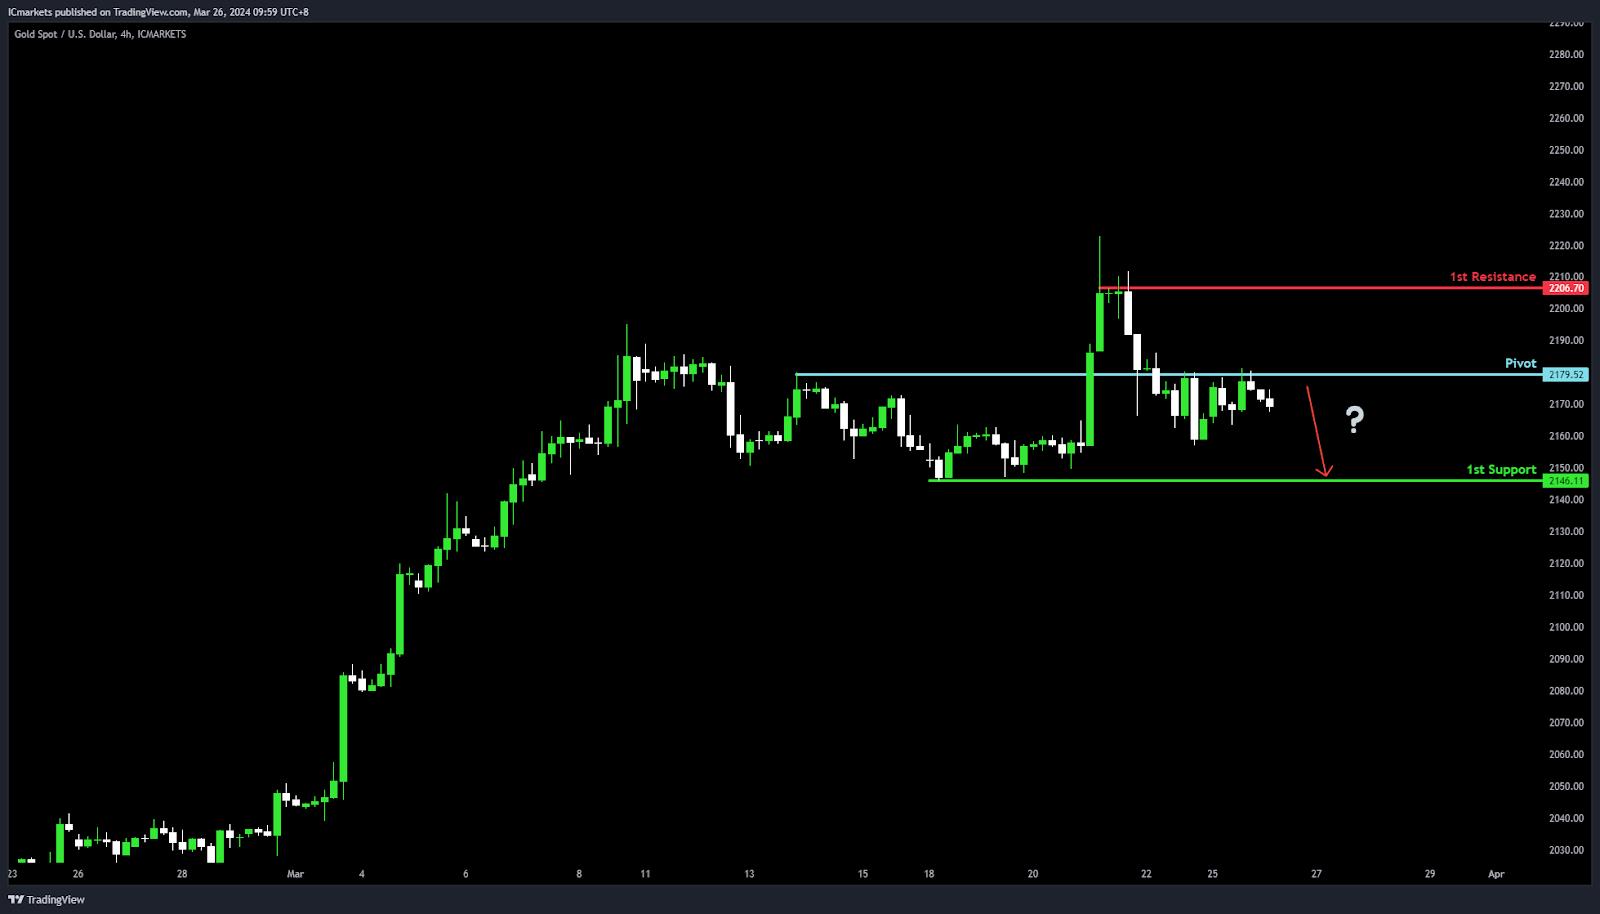
XAU/USD (GOLD):
Potential Direction: Bearish
Overall momentum of the chart: Bullish
Price could potentially make a bearish continuation towards 1st support
Pivot: 2179.52
Supporting reasons: Serves as an Overlap resistance, a key point where sellers could start to push prices down, showing it’s an important spot for possible changes in how the price moves.
1st support: 2146.11
Supporting reasons: Identified as Multi-swing low support, marking a key level where the market has previously found a foundation for rebounds, indicating its pivotal role in halting bearish momentum
1st resistance: 2206.70
Supporting reasons: Characterized by Multi-swing high resistance, highlighting a major barrier that has historically limited upward movements, positioning it as an essential threshold for bulls to breach in order to resume the bullish trend
GBP/USD – Upsides Could Be Capped Near 1.2700
Key Highlights
- GBP/USD extended its decline below the 1.2650 support zone.
- A major bearish trend line is forming with resistance near 1.2720 on the 4-hour chart.
- EUR/USD could struggle near the 1.0850 and 1.0860 resistance levels.
- Crude oil prices might attempt a fresh increase toward the $85 level.
GBP/USD Technical Analysis
The British Pound failed to continue higher above the 1.2920 resistance against the US Dollar. GBP/USD traded below the 1.2720 support to enter a bearish zone.
Looking at the 4-hour chart, the pair even settled below the 1,2680 level, the 100 simple moving average (red, 4-hour), and the 200 simple moving average (green, 4-hour). Finally, the pair traded as low as 1.2575 and the pair is now consolidating losses.
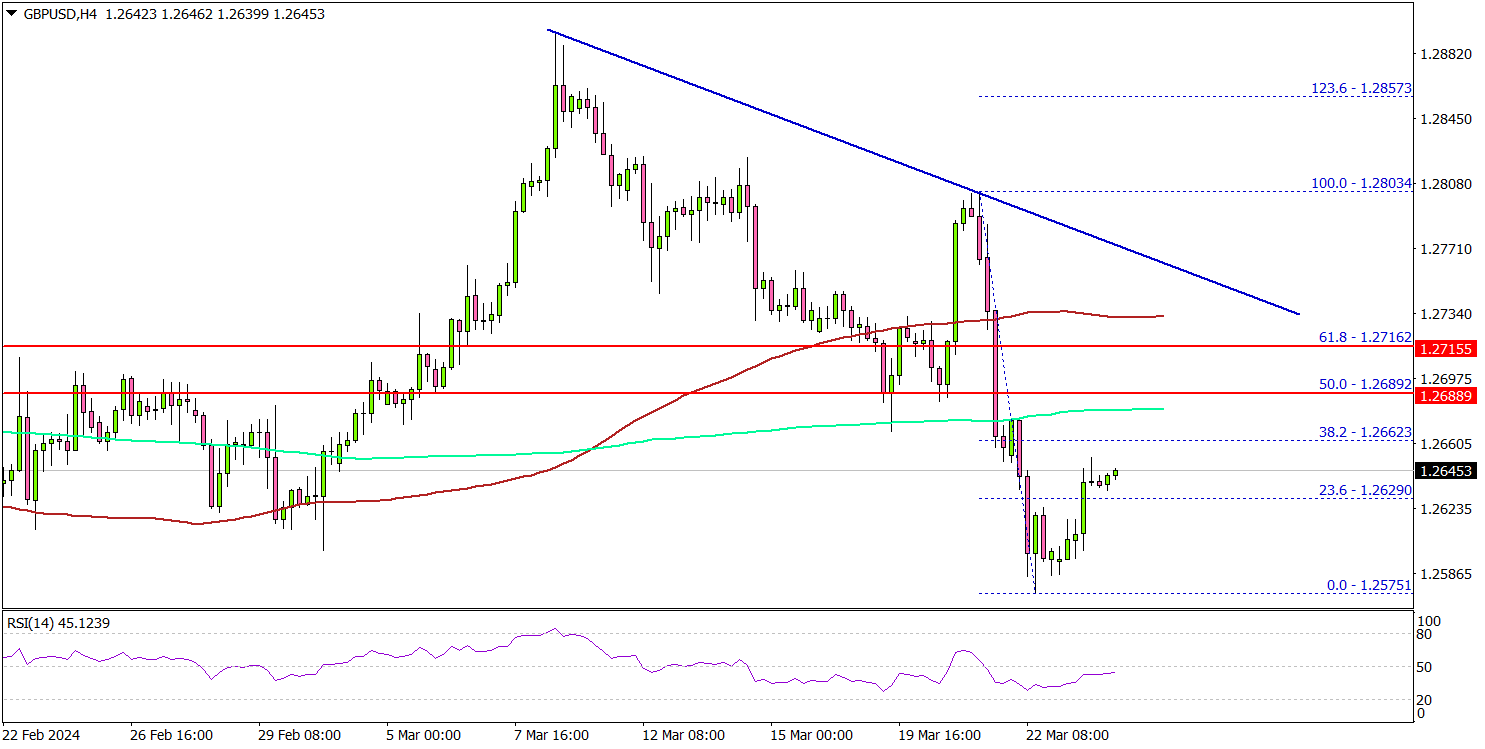
On the upside, the pair could face resistance near the 1.2660 level. The first major resistance is now forming near 1.2680. The main resistance is now forming near 1.2700.
There is also a major bearish trend line forming with resistance near 1.2720 on the same chart. A close above the 1.2720 zone could open the doors for more upsides. The next stop for the bulls might be 1.2800.
If not, the pair might continue to decline. Immediate support is near the 1.2600 level. The next major support is at 1.2575. If there is a downside break below the 1.2572 support, the pair could decline toward the 1.2520 support. Any more losses might send the pair toward the 1.2450 level in the near term.
Looking at Oil, the bulls are active above the $80 pivot level and they might soon aim for more upsides toward the $85 level.
Economic Releases
- US Durable Goods Orders for Feb 2024 - Forecast +1.3%, versus -6.2% previous.
Australia’s Westpac consumer sentiment dips -1.8% mom, RBA triggers sharp decline
In March, Westpac Consumer Sentiment Index in Australia dropped by -1.8% mom to 84.4. This downturn is attributed to renewed concerns about the near-term economic outlook, with fears regarding inflation and interest rate hikes only easing marginally.
The survey revealed a significant shift in sentiment in responses to the RBA's latest policy decision. Sentiment scores were markedly higher at 94.9 for those surveyed before the decision, compared to a lower 79.3 for those surveyed afterwards.
The persistence of consumer concerns, notably regarding inflation and interest rates, was evident. Many had harbored hopes for a more reassuring update from RBA on these fronts. Yet, the central bank's governor did not entirely dismiss the prospect of additional rate hikes. This stance likely contributed to dampening consumer sentiment, as individuals grappled with the implications for personal finances and economic conditions at large.
Fed’s Bostic eyes single rate cut in 2024, credits robust economy
Atlanta Fed President Raphael Bostic reiterated his anticipation just one interest-rate reduction within this year. Also, the first cut could happen later than previously envisioned, as Fed can "afford to be patient" as long as the economy holds up.
Bostic's noted that as long as the economic indicators—such as GDP growth, employment rates, and business activity—remain robust, "I'm not in a hurry to get inflation down to 2%."
"If it continues on a trajectory, I'm happy with that," he added.