
Sample Category Title
USD/CHF Mid-Day Outlook
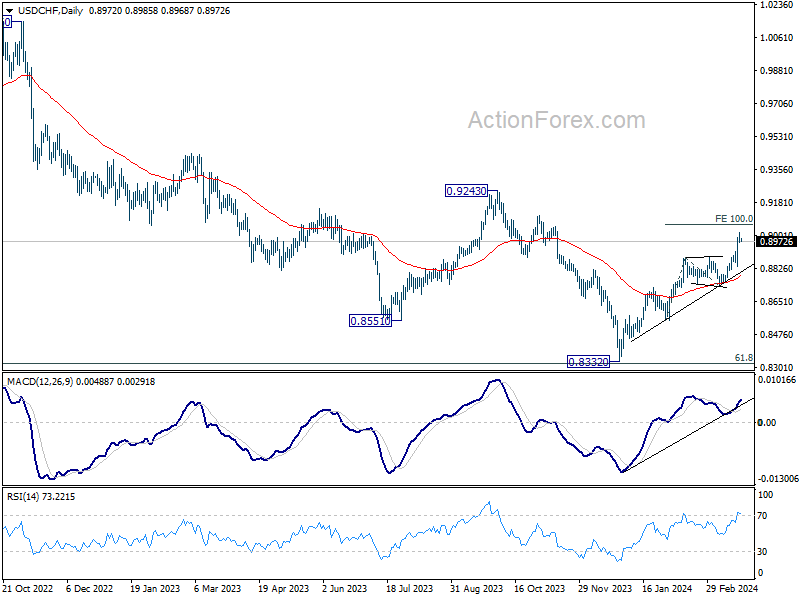
Daily Pivots: (S1) 0.8953; (P) 0.8987; (R1) 0.9009; More....
Intraday bias in USD/CHF remains neutral for consolidations below 0.9019 temporary top first. Downside of retreat should be contained above 0.8838 support to bring rebound. Break of 0.9019 will resume larger rally from 0.8332. Next target is 100% projection projection of 0.8550 to 0.8884 from 0.8728 at 0.9062.
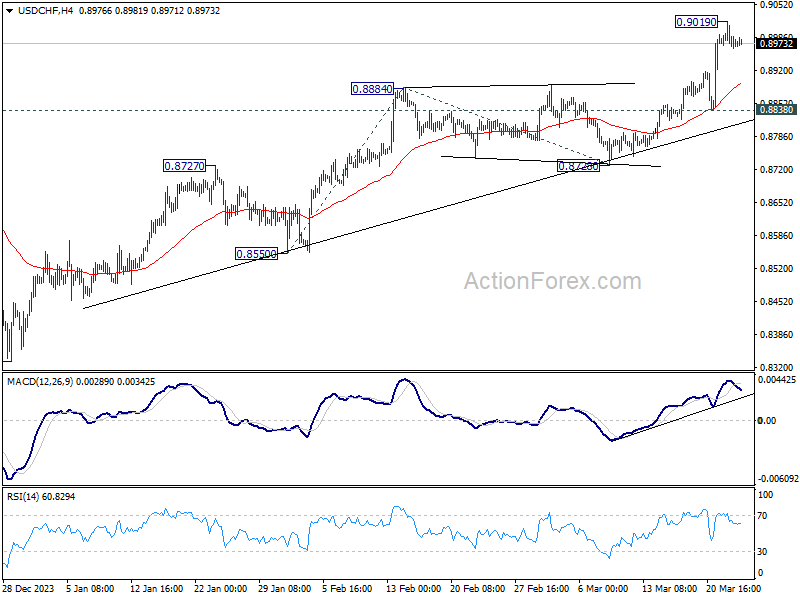
In the bigger picture, price actions from 0.8332 medium term bottom as tentatively seen as developing into a corrective pattern to the down trend from 1.0146 (2022 high). Further rise would be seen as long as 0.8728 support holds. But upside should be limited by 0.9243 resistance, at least on first attempt.
EUR/USD Mid-Day Outlook
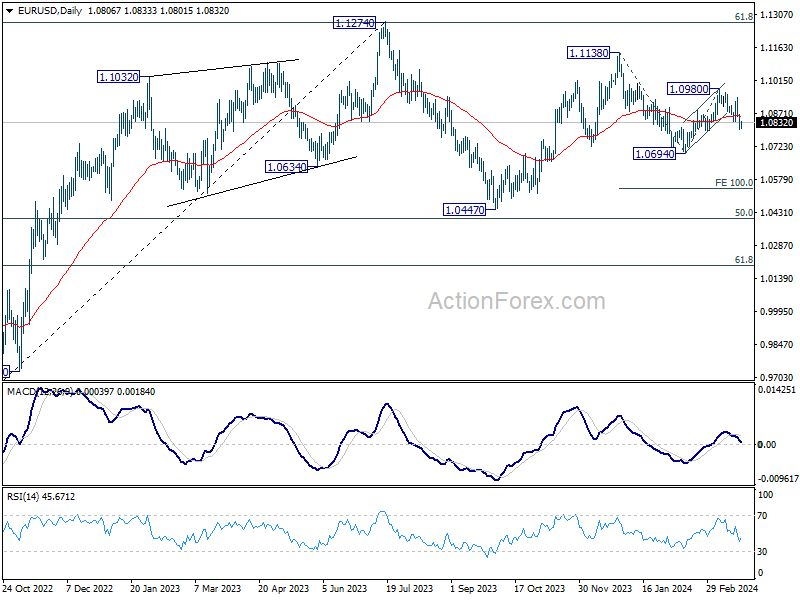
Daily Pivots: (S1) 1.0784; (P) 1.0826; (R1) 1.0850; More...
Intraday bias in EUR/USD is turned neutral with current recovery and some consolidations would be seen. But risk will stay on the downside as long as 55 4H EMA (now at 1.0868) holds. Below 1.0801 will resume the fall from 1.0980 to retest 1.0694 first. Break there will resume the decline from 1.1138 and target 100% projection of 1.1138 to 1.0694 from 1.0980 at 1.0536.
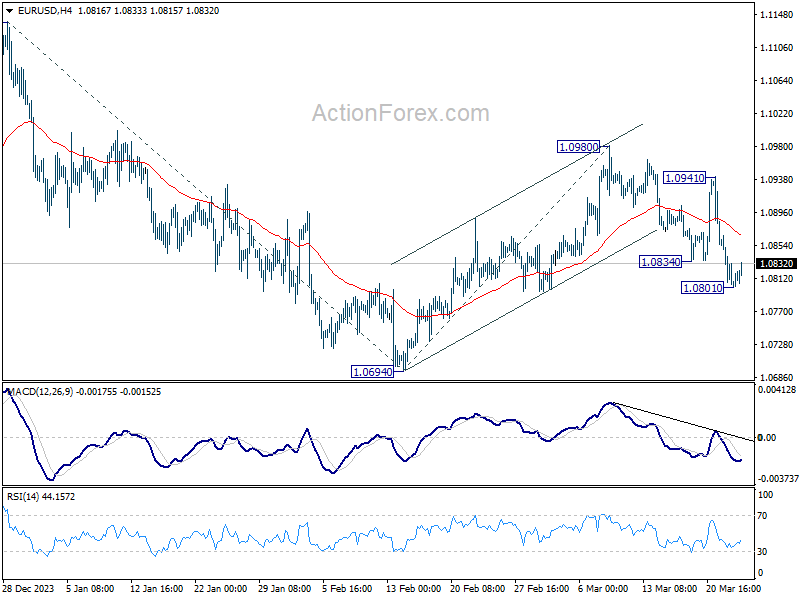
In the bigger picture, price actions from 1.1274 are viewed as a corrective pattern to rise from 0.9534 (2022 low). Rise from 1.0447 is seen as the second leg. While further rally could cannot be ruled out, upside should be limited by 1.1274 to bring the third leg of the pattern. Meanwhile, sustained break of 1.0694 support will argue that the third leg has already started for 1.0447 and possibly below.
GBP/USD Mid-Day Outlook
Daily Pivots: (S1) 1.2558; (P) 1.2617; (R1) 1.2658; More...
Intraday bias in GBP/USD is turned neutral with current recovery and some consolidations would be seen first. But risk will stay on the downside as long as 55 4H EMA (now at 1.2700) holds. Below 1.2574 will resume the fall from 1.2892 to 1.2517 structural support first. Decisive break there will suggest that rise from 1.2036 has completed at 1.2892 already, and turn near term outlook bearish.
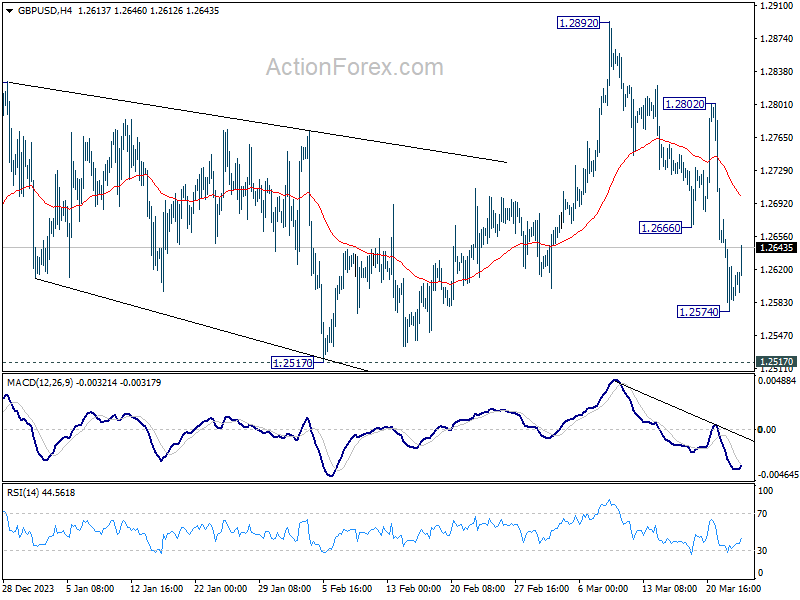
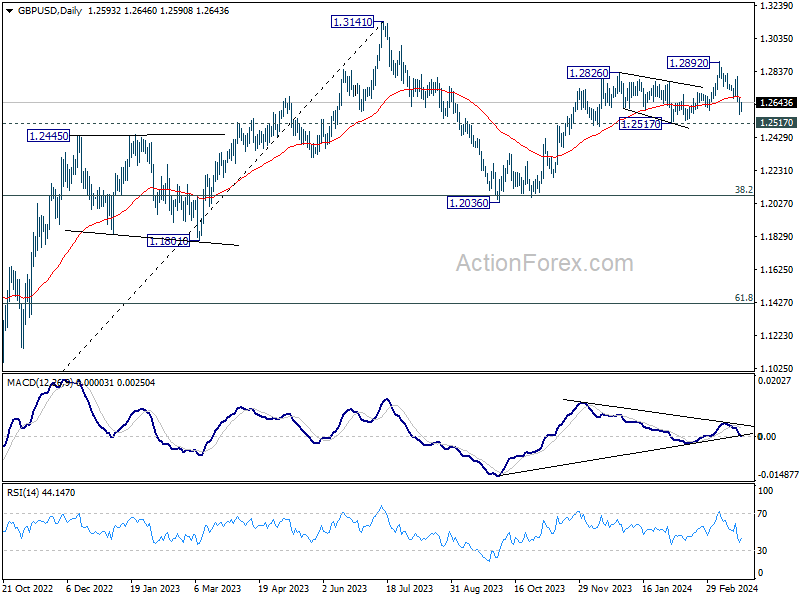
In the bigger picture, price actions from 1.3141 medium term top are seen as a corrective pattern to up trend from 1.0351 (2022 low). Rise from 1.2036 is seen as the second leg, which might still be in progress. But upside should be limited by 1.3141 to bring the third leg of the pattern. Meanwhile, break of 1.2517 support will argue that the third leg has already started for 38.2% retracement of 1.0351 (2022 low) to 1.3141 at 1.2075 again.
Subdued Currency Movements, Cautious Stocks, Range Trading Gold
Mild risk-off mood is seen in the global financial markets today, starting from the the noticeable retreat in Japan's Nikkei, then the marginal declines across European stock indices, alongside soft US futures. However, this sense of caution has not significantly rippled through the currency markets, where activity remains largely subdued. Notably, most major currency pairs and crosses have maintained tight ranges, except for a few Sterling crosses which have shown more activity.
British Pound is currently the stronger one, alongside Australian Dollar and New Zealand Dollar, Conversely, Swiss Franc, Dollar, and Japanese Yen are registering softer performances. This paints a picture typically associated with risk-on market behavior, rather than risk-off. Euro and Canadian Dollar find themselves positioned in the the middle. Market activity is expected to remain muted throughout the session, particularly given the sparse US economic calendar.
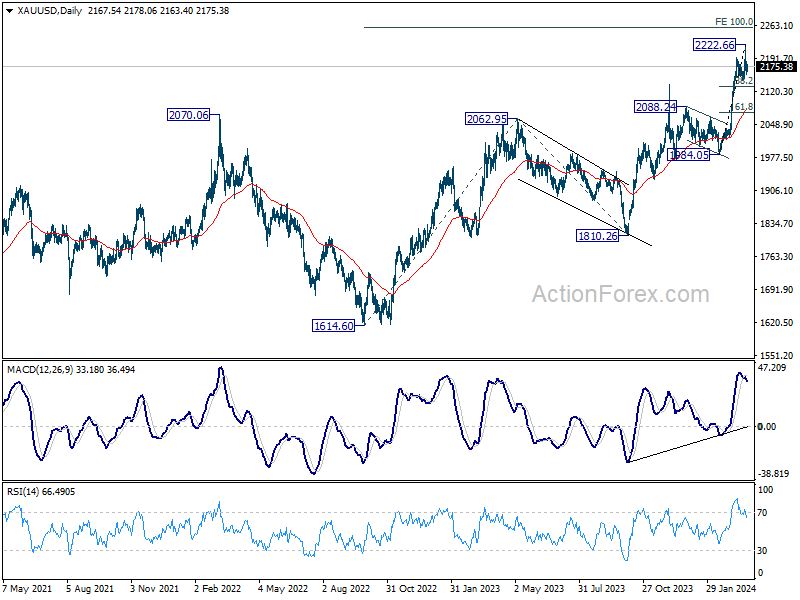
Technically, a short term top has likely formed at 2222.66 in Gold, with D MACD crossed below signal line. Some consolidations would be seen first. But downside should be contained by 38.2% retracement of 1984.05 to 2222.66 at 2131.51 to bring another rally. Above 2222.66 will resume the long term up trend to 100% projection of 1614.60 to 2062.95 from 1810.26 at 2259.15. However, sustained break of 2131.51 fibonacci support will bring deeper pull back to 55 D EMA (now at 2085.37).
In Europe at the time of writing, FTSE is down -0.42%. DAX is up 0.02%. CAC is down -0.38%. UK 10-year yield is down -0.0747 at 3.962. Germany 10-year yield is up 0.025 at 2.350. Earlier in Asia, Nikkei fell -1.16%. Hong Kong HSI fell -0.16%. China Shanghai SSE fell -0.71%. Singapore Strait Times fell -0.62%. Japan 10-year JGB yield fell -0.0078 to 0.736.
ECB's Lane confident that wages growth is on track to normalize
ECB Chief Economist Philip Lane, in a podcast published today, conveyed a sense of confidence among policymakers regarding wage growth trends. Lane articulated that policymakers are "confident" that wages growth is "on track" to return to normal.
"If this assessment is confirmed, then we will start looking more closely at reversing some of the rate increases we've made," he added.
Adding to the conversation, Governing Council member Fabio Panetta addressed an audience at a separate event, underscoring the feasibility of a rate cut given the current inflation trend.
"The consensus emerging - especially in recent weeks - within the ECB governing council points in this direction," Panetta noted.
BoJ Jan minutes: No need for aggressive tightening like Western counterparts
BoJ's minutes from January meeting, ahead of the landmark March decision to end negative interest rates, reveal a cautious approach towards monetary policy adjustments. Members highlighted the Japan's economic conditions "differed significantly" to those of US and Europe when they initiated interest rate hikes a few years ago. The consensus was clear: it was "not required in Japan to conduct rapid monetary tightening" as seen in Western economies.
Further discussions underscored three primary risks to Japan's economic activity: shifts in global economic performance and financial markets, fluctuations in commodity and grain import prices, and future growth expectations of firms and households.
Members agreed these factors could significantly influence economic outcomes and emphasized the need for vigilance towards price-setting behaviors within the economy, as well as the impact of currency and commodity price movements on domestic inflation.
GBP/USD Mid-Day Outlook
Daily Pivots: (S1) 1.2558; (P) 1.2617; (R1) 1.2658; More...
Intraday bias in GBP/USD is turned neutral with current recovery and some consolidations would be seen first. But risk will stay on the downside as long as 55 4H EMA (now at 1.2700) holds. Below 1.2574 will resume the fall from 1.2892 to 1.2517 structural support first. Decisive break there will suggest that rise from 1.2036 has completed at 1.2892 already, and turn near term outlook bearish.
In the bigger picture, price actions from 1.3141 medium term top are seen as a corrective pattern to up trend from 1.0351 (2022 low). Rise from 1.2036 is seen as the second leg, which might still be in progress. But upside should be limited by 1.3141 to bring the third leg of the pattern. Meanwhile, break of 1.2517 support will argue that the third leg has already started for 38.2% retracement of 1.0351 (2022 low) to 1.3141 at 1.2075 again.
Economic Indicators Update
| GMT | Ccy | Events | Actual | Forecast | Previous | Revised |
|---|---|---|---|---|---|---|
| 23:50 | JPY | BoJ Minutes | ||||
| 14:00 | USD | New Home Sales Feb | 675K | 661K |
Australian Dollar Stabilizes, Consumer Sentiment Next
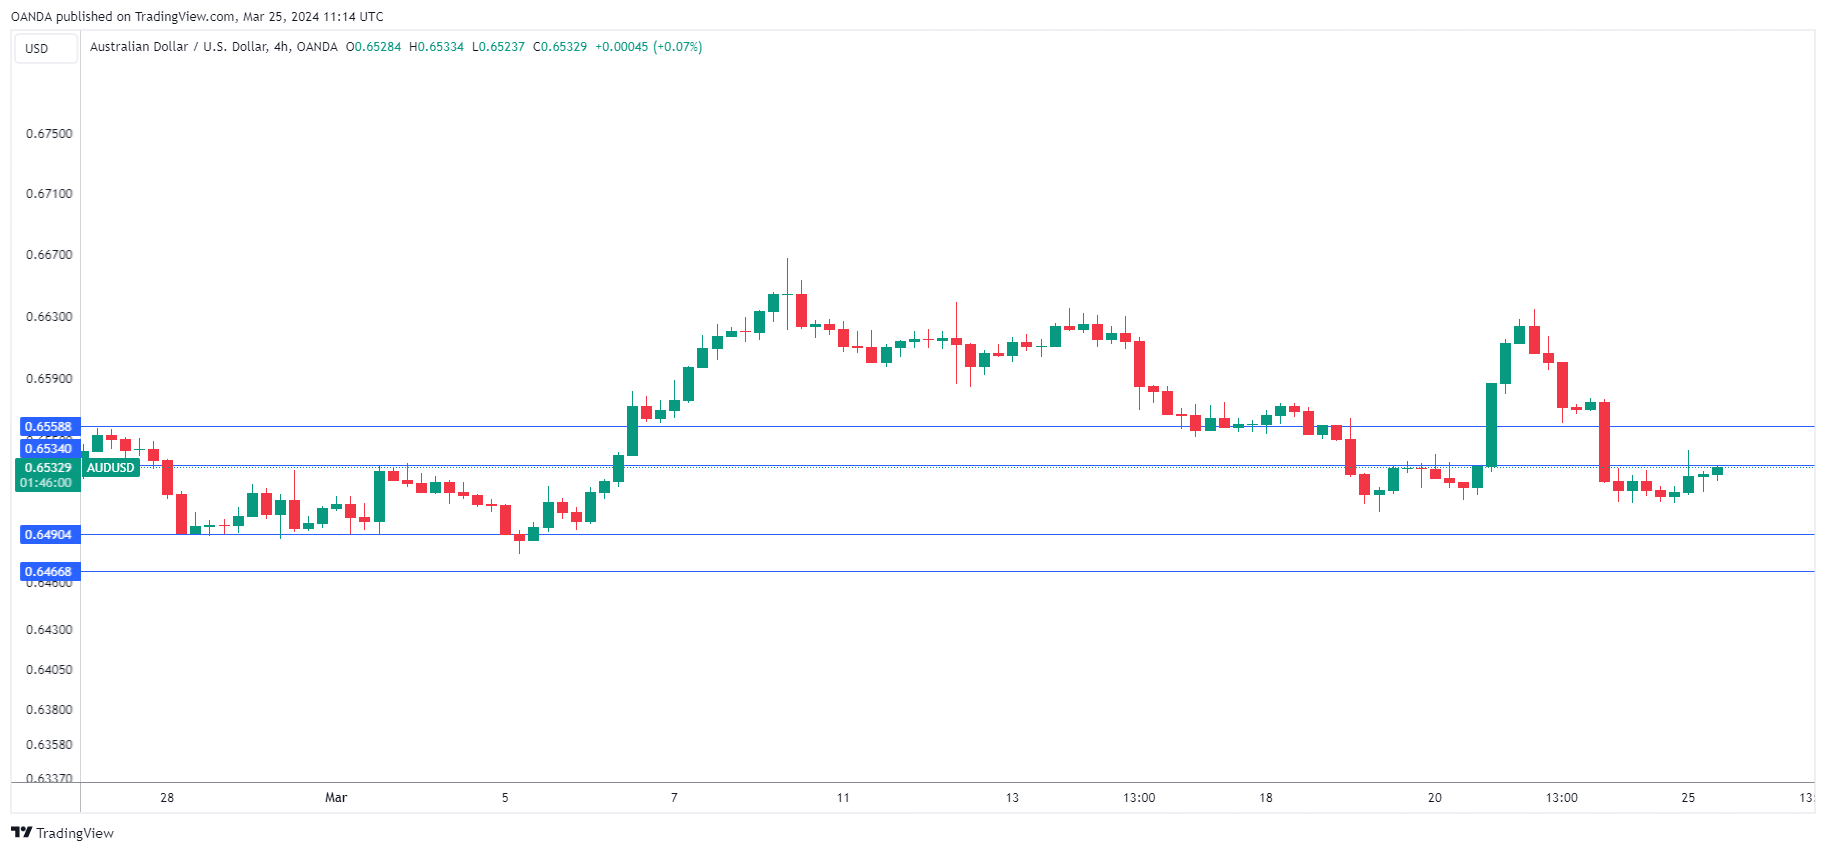
The Australian dollar has started the week with slight gains, after sliding 0.86% on Friday. In the European session, AUD/USD is trading at 0.6530, up 0.24%.
PBoC move sends Aussie sharply lower
The Australian dollar ended the week with sharp losses after China’s central bank set the daily fixing of the Chinese yuan lower than expected on Friday. The PBoC weakened the yuan in order to boost China’s struggling economy and the move led to an AUD/USD sell-off on Friday. China is Australia’s number one trading partner, and currency interventions such as the PBoC move can have a major impact on the Australian dollar.
It’s a light day on the data calendar, which means we can expect a quiet day for AUD/USD. The only tier-1 event is US New Home Sales, which is expected to rise to 680,000 in February, up from 661,000 in January.
Australia releases Westpac Consumer Sentiment on Tuesday, with the markets braced for a decline of 1.6% for March. This follows a sparkling 6.2% gain in February, as consumer confidence climb sharply after the Reserve Bank of Australia held interest rates earlier in February. Consumers expressed optimism that the RBA had winded up its rate-tightening cycle.
In the US, the markets have high hopes for three rate cuts this year, and the Fed’s “dot plot” projection at last week’s meeting also projected three cuts this year. However, Atlanta Federal Reserve bank President Raphael Bostic dampened the mood on Friday when he said that he expects only one quarter-point cut this year. Bostic said that he was “definitely less confident than I was in December” that inflation will continue to drop towards the 2% target.
AUD/USD Technical
- AUD/USD is testing resistance at 0.6534. Above, there is resistance at 0.6558
- There is support at 0.6490 and 0.6466
ECB’s Lane confident that wages growth is on track to normalize
ECB Chief Economist Philip Lane, in a podcast published today, conveyed a sense of confidence among policymakers regarding wage growth trends. Lane articulated that policymakers are "confident" that wages growth is "on track" to return to normal.
"If this assessment is confirmed, then we will start looking more closely at reversing some of the rate increases we've made," he added.
Adding to the conversation, Governing Council member Fabio Panetta addressed an audience at a separate event, underscoring the feasibility of a rate cut given the current inflation trend.
"The consensus emerging - especially in recent weeks - within the ECB governing council points in this direction," Panetta noted.
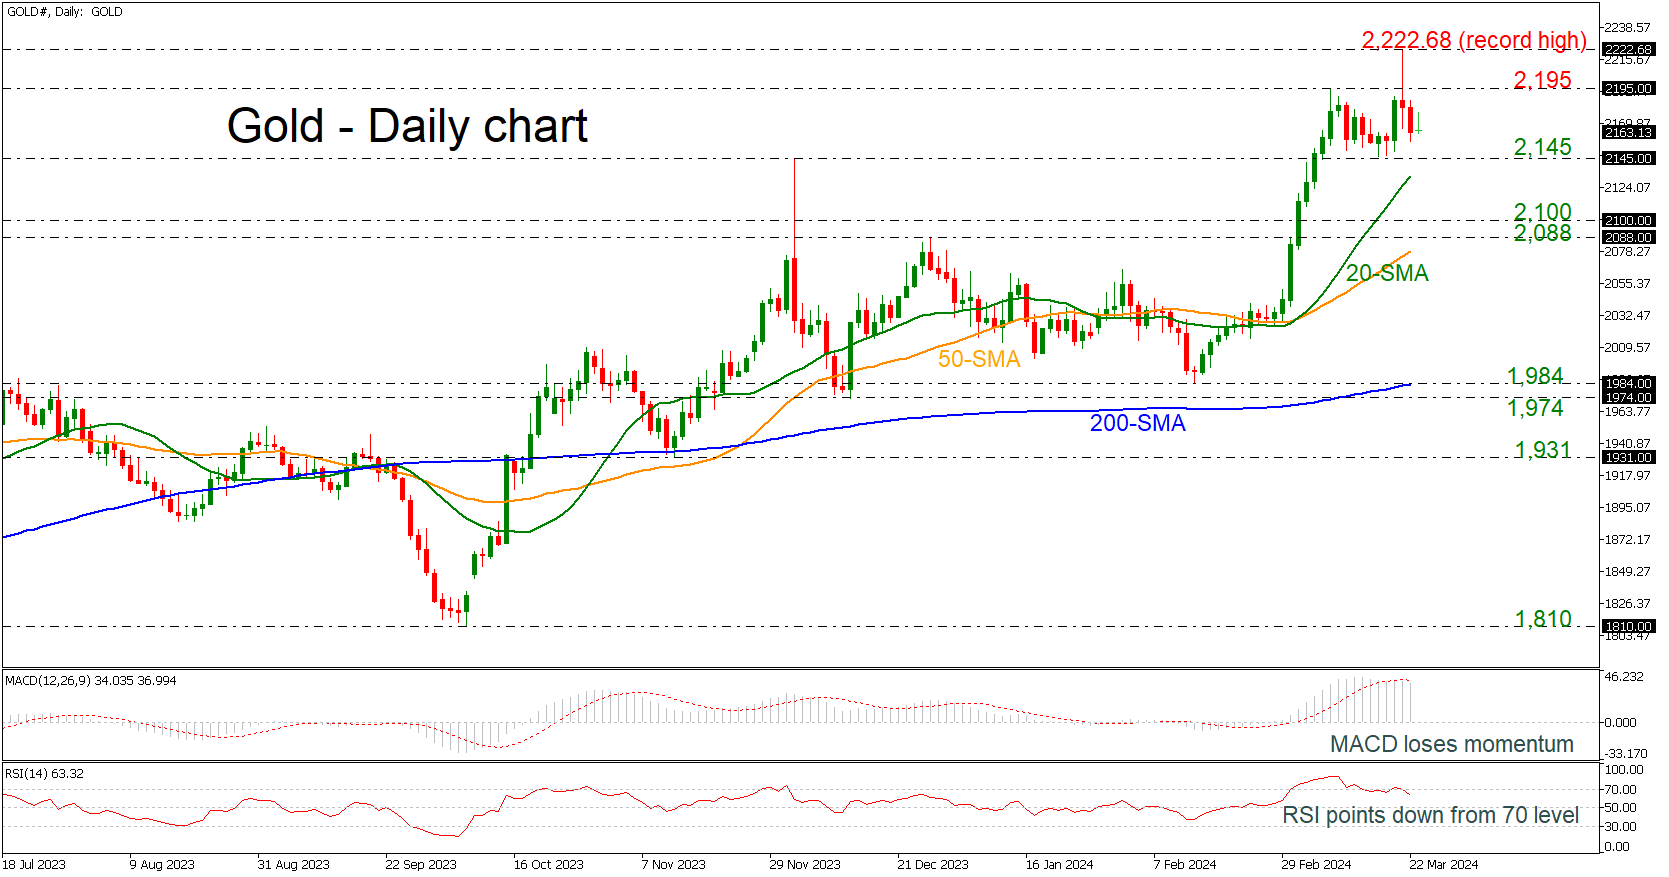
Gold Pulls Back from All-Time High
- Gold moves horizontally within 2,145-2,195
- MACD and RSI lose steam
Gold prices have been moving lower over the last couple of days after the bullish spike towards the all-time high of 2,222.68 that was posted in the preceding week. The market has been developing within a narrow range of 2,145 to 2,195 since March 7 with the technical oscillators confirming a weakening bias. The MACD is holding beneath its trigger line well above the zero level, while the RSI is ticking down after the climb to 70 level.
If the market retreats further, then it may hit the lower boundary of the sideways move at 2,145 before touching the 20-day SMA at 2,131. Slipping further, the 2,088-2,100 region may halt the bearish movements.
On the other hand, a successful attempt above the 2,195 resistance could open the way for a retest of the all-time peak of 2,222.68. Immediate resistance could be found at the 161.8% Fibonacci extension level of the down leg from 2,079.19 to 1,810 at 2,245. Even higher, the price may challenge the next psychological marks such as 2,300 and 2,400.
All in all, gold is moving horizontally in short-term timeframe, but the broader outlook remains positive.
Crypto Market Comes to Life
Market picture
The crypto market cap rose 4.5% over 24 hours to $2.56 trillion, roughly where it was a week ago, with an active rally over the last three days.
Bitcoin is up 4.7%, and Ethereum is up 4.3% in 24 hours. Their momentum has encouraged even more robust growth in smaller coins. Dogecoin is up 15% in 24 hours and 100% in 30 days, Solana is up +9.5% and 86%, and BNB remains stronger at +6.7% and 54% respectively.
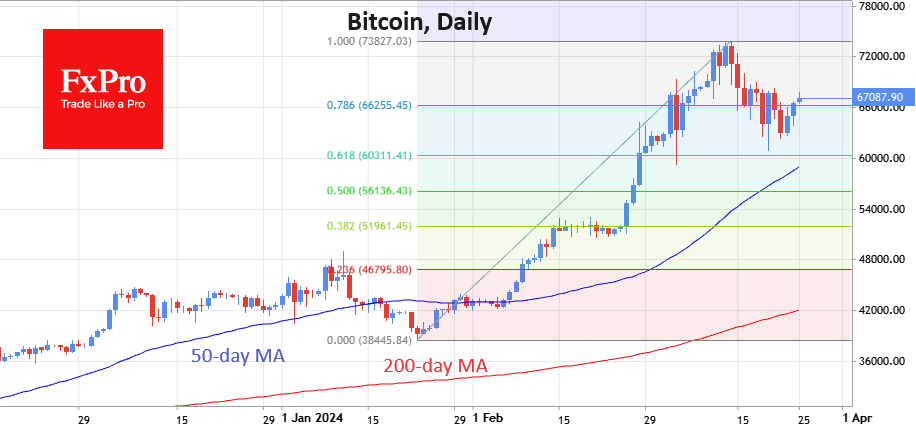
Bitcoin rose to $67.1K, a third day of strength from an area near the 61.8% Fibonacci retracement of the rise from the January lows to the March highs. The correction from the peak has removed overbought conditions on a daily timeframe, making room for growth and easing the psychological impact on potential buyers as many are more comfortable buying the asset after a drawdown.
The fundamental development of this pattern suggests further growth towards the previous high of $73.7K. If it is successfully breached, the next target for growth could be $95.5K.
News background
Despite the recent correction in bitcoin, the asset is in “overbought territory”, notes JPMorgan. As the halving approaches, profit-taking is likely to continue.
Retail traders have temporarily lost interest in bitcoin, according to Zaye Capital Markets. With the halving approaching, BTC could see a major correction and fall below $50K.
BlackRock’s clients have little interest in investing in cryptocurrencies, except for Bitcoin and Ethereum, the firm said.
The SEC delayed a decision on Grayscale’s Ethereum futures ETF until 30 May, citing the need for more time to review it.
US authorities have filed claims against FTX. The US government’s claim on the collapsed exchange’s assets is expected to be between $3bn and $5bn.
Ripple CEO Brad Garlinghouse suggested that the SEC will fail in its attempts to classify Ethereum as a security.
Solana will surpass Ethereum in the number of consumer decentralised applications (dapps), predicts Matty Taylor, co-founder of Colosseum and former head of growth at the Solana Foundation.
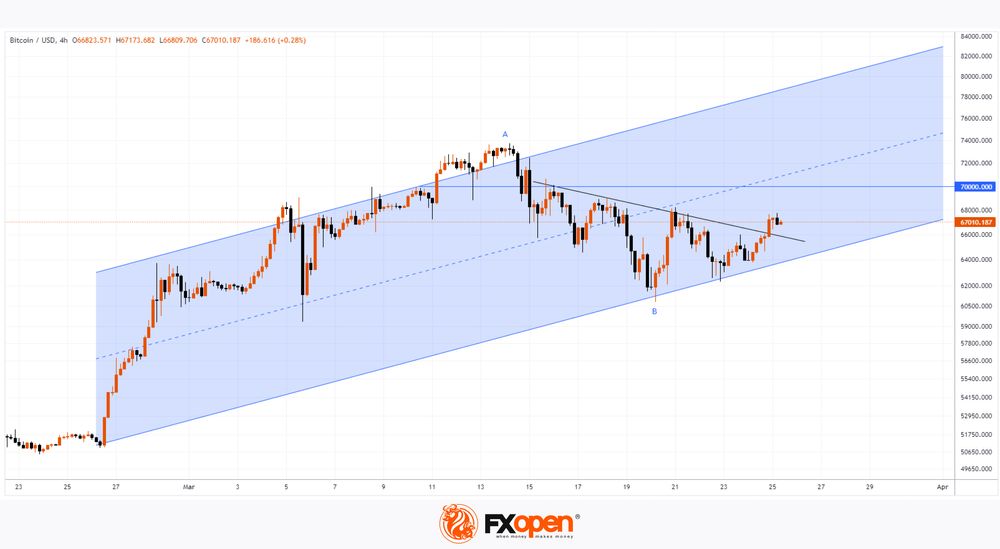
Bitcoin Price Recovered over the Weekend, But Market Anxiety Remains
From the point of view of technical analysis of BTC/USD, on Friday evening the price of Bitcoin was near the lower boundary of the ascending channel (shown in blue). This was alarming as it indicated that the market action could result in a weekly bearish candle forming with the price of BTC down by around 5% — something that hasn't happened since August of last year.
However, this did not happen, as the price recovered over the weekend, forming rebounds from the lower border of the channel. The lower shadows of the candles are a sign of demand forces. Moreover, the bulls have broken through the downward trend line (shown in black). Will the bulls be able to return the price of Bitcoin to an upward trajectory within the specified trend?
Doubts remain.
→ Bitcoin “still looks overbought,” JPMorgan strategists warned, predicting a decline to USD 42k.
→ Bloomberg writes about record capital outflows from Bitcoin ETFs last week.
→ The level of 70k looks like an important psychological resistance. Above it, the Bitcoin price formed a double top pattern with an all-time high at point A, after which the bears clearly became more active. They successfully pushed the price to minimum B, breaking the support of the channel median line.
The price of Bitcoin starts the new week around the 50% retracement from the decline A→B (about -16%). This gives reason to assume the development of consolidation.
But if the price again falls to the lower border of the channel, then this will more clearly indicate the inability of the bulls to resume the upward trend — and therefore put the lower border of the channel at risk of a bearish breakout.
FXOpen offers the world's most popular cryptocurrency CFDs*, including Bitcoin and Ethereum. Floating spreads, 1:2 leverage — at your service. Open your trading account now or learn more about crypto CFD trading with FXOpen.
*At FXOpen UK and FXOpen AU, Cryptocurrency CFDs are only available for trading by those clients categorised as Professional clients under FCA Rules and Professional clients under ASIC Rules respectively. They are not available for trading by Retail clients.
This article represents the opinion of the Companies operating under the FXOpen brand only. It is not to be construed as an offer, solicitation, or recommendation with respect to products and services provided by the Companies operating under the FXOpen brand, nor is it to be considered financial advice.
Hang Seng Index: Potential Currency War May Kick Start Another Bearish Leg
- A less dovish Fed with a surprise cut by SNB has triggered a bout of US dollar strength since last Thursday, 21 March.
- China’s central bank, PBoC responded with a lower-than-expected daily fixing on the onshore yuan (CNY) last Friday, 22 March which led the offshore yuan (CNH) to plunge by -0.8% against the US dollar to a two-month low.
- Further CNH weakness may trigger a currency war which in turn can trigger a potential negative feedback loop back into risk assets.
In the past two weeks, China, and Hong Kong benchmark stock indices (CSI 300, Hang Seng Index, Hang Seng TECH Index & Hang Seng China Enterprises Index) have traded sideways after recording gains of between +16% to +24% from their respective early February lows to recent mid-March highs.
These recent bouts of positive performances have propelled China and Hong Kong to be the top-performing major stock markets in February and are supported by the absence of a strong US dollar environment that reduces the risk of capital outflows as China remains mired in a deflationary risk spiral as well as ongoing high tech trade war with the US since 2018.
Hence, the recent rallies and outperformance of the key China and Hong Kong benchmark stock indices have been indirectly supported by a stable Chinese yuan where the CNH (offshore yuan) has traded in a tight range of 0.7% against the US dollar between 5 February to 12 March.
SNB surprised rate cut may trigger a currency war
Last Thursday, 21 March, the Swiss National Bank (SNB) engineered a surprise on market participants by enacting a rate cut of 25 basis points (bps) to 1.5% on its key policy rate, its first cut in nine years, and ahead of the US Federal Reserve, Bank of England (BoE), and European Central Bank (ECB).
One of the push factors for enacting an earlier rate cut by SNB other than a clear deceleration in inflationary trend (annualized core inflation rate has remained below 2% since May 2023) is the persistent strength of the franc that could erode the competitiveness of Swiss goods and services which in turn put a dent on economic growth in Switzerland.
The EUR/CHF cross pair has accelerated its decline in the past three years where it tumbled by -17% to print a close of 0.9270 on 5 January 2024, a fresh all-time low on a closing level basis since the surprise EUR/CHF unpeg on 15 January 2015 (intraday low of 0.8600 with a daily close of 0.9753).
The CHF tumbled after the surprise SNB’s decision; it fell by -1% against the EUR to its weakest level since July 2023. Also, it dropped -1.2% against the US dollar to hit a fresh four-month low.
Interestingly, the offshore yuan (CNH) tumbled by -0.8% against the US dollar to print a two-month low last Friday, 22 March after the China central bank, PBoC set a weaker-than-expected daily fixing on the onshore yuan (CNY).
This latest set of FX policy moves by PBoC is likely to have signaled a willingness to sacrifice some form of capital outflows over maintaining exports’ competitiveness to drive economic growth, and to fill the gap in the absence of robust domestic demand.
If the US dollar continues to strengthen due to the Fed’s less dovish stance (in no hurry to cut rates), it may lead to a bout of engineered currency devaluations among major exporters such as South Korea and Singapore which is likely to put pressure on PBoC to weaken the CNH further to make up for a further potential loss of trade competitiveness.
Overall, a persistent US dollar strength trend may trigger “beggar-thy-neighbour” currency war-liked monetary policies among exporters.
A weaker CNH does not bode well for risk assets
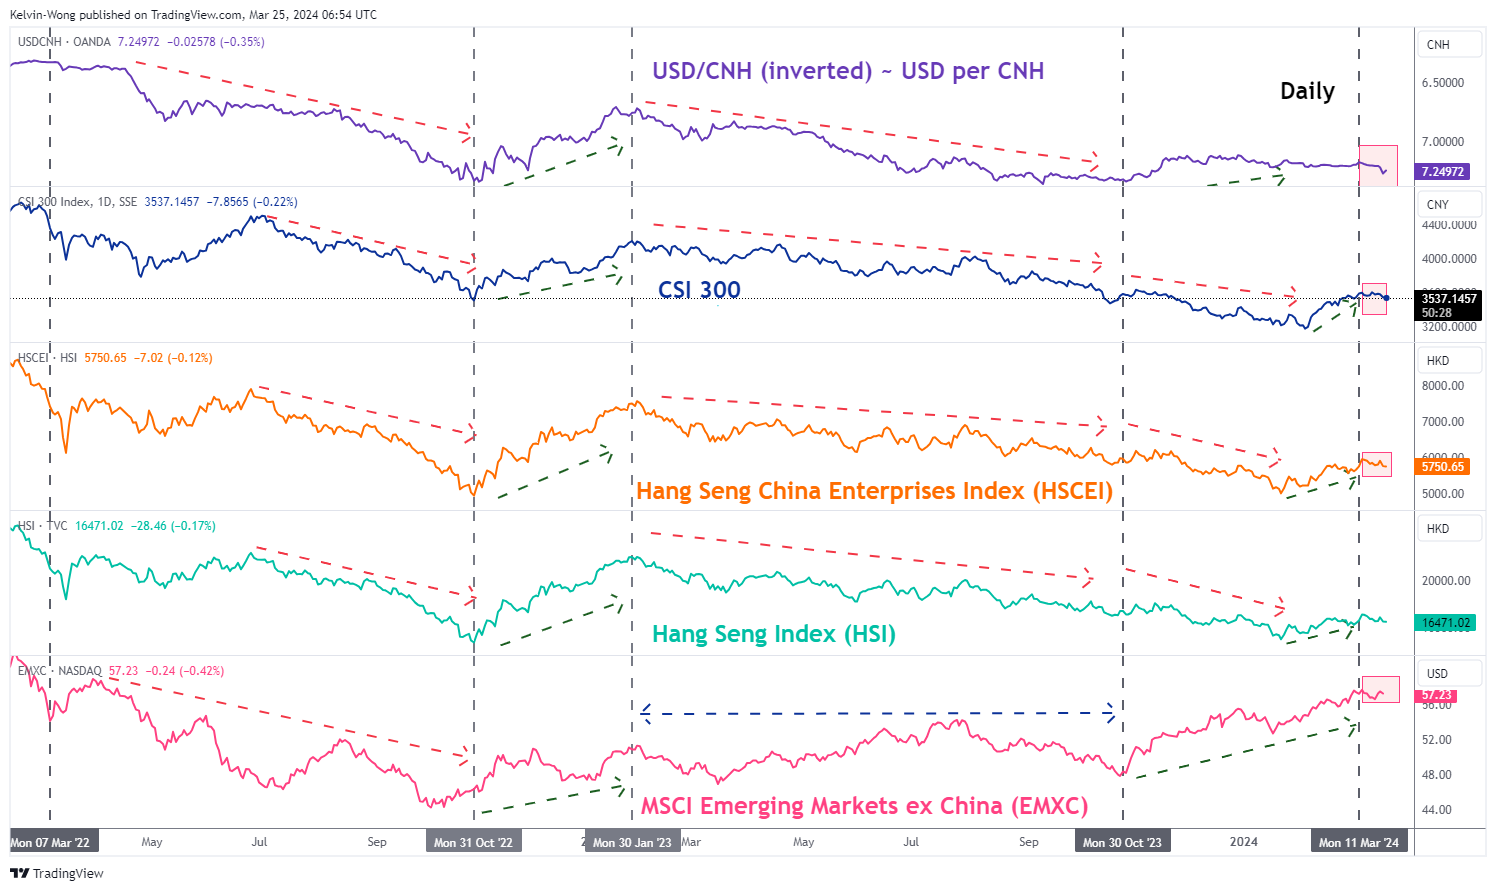
Fig 1: CNH/USD direct correlation with CSI 300, HSCEI & HSI as of 25 Mar 2024 (Source: TradingView, click to enlarge chart)
In the past two years, periods of significant weakness in the CNH (offshore yuan) against the US dollar have triggered a negative feedback loop back into the China and Hong Kong stock markets but to a lesser extent in emerging stock markets excluding China (see Fig 1).
Therefore, the recent softness seen in the CNH may trigger another round of potential multi-week bearish movements in the CSI 300, Hang Seng China Enterprises Index, and Hang Seng Index.
Bearish momentum has resurfaced in the Hang Seng Index
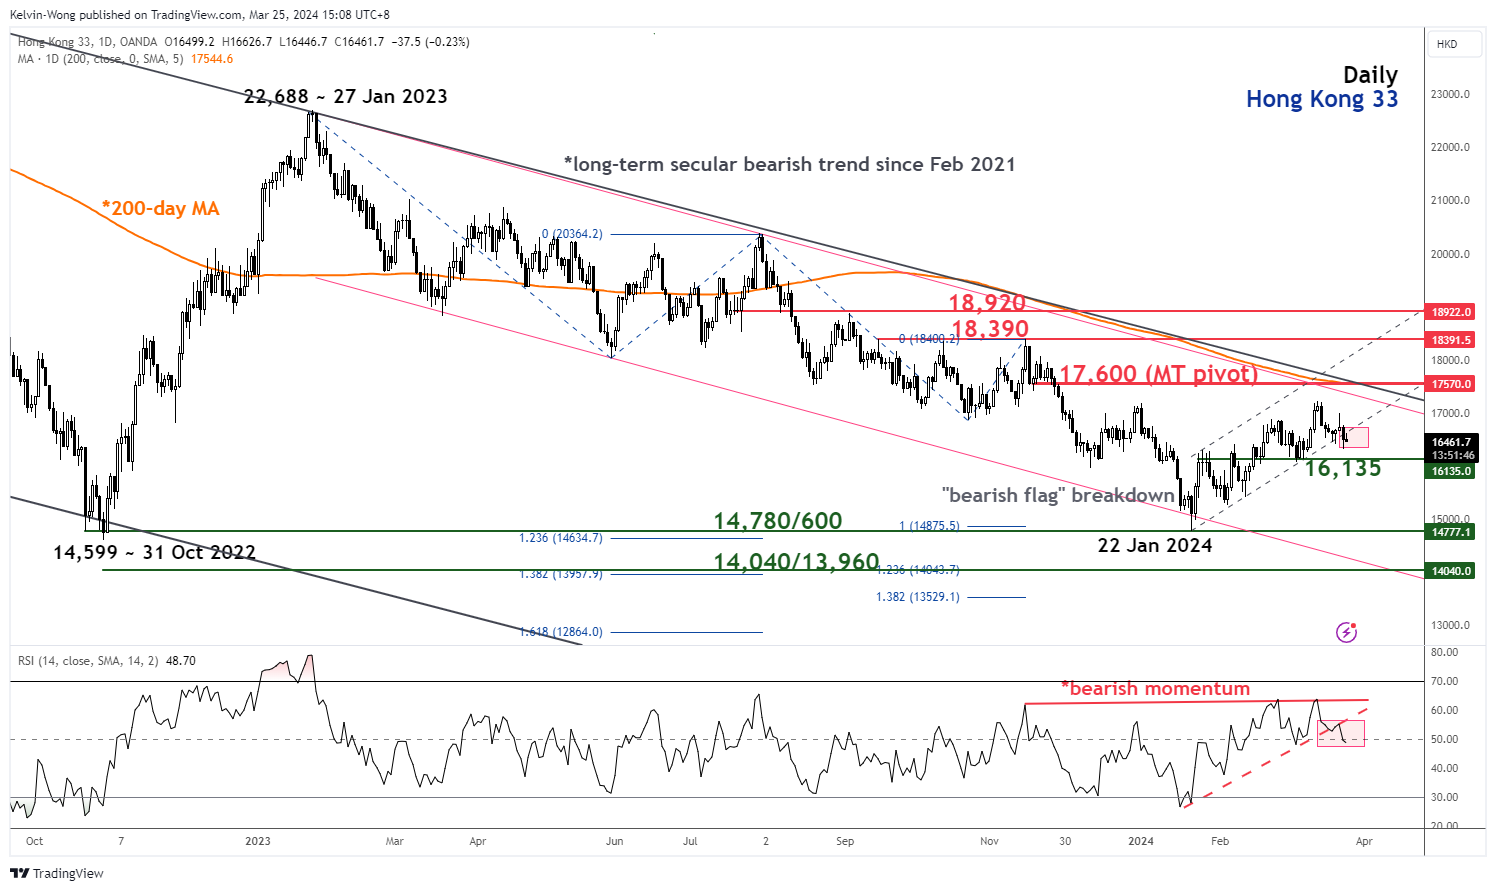
Fig 2: Hong Kong 33 Index major trend as of 25 Mar 2024 (Source: TradingView, click to enlarge chart)
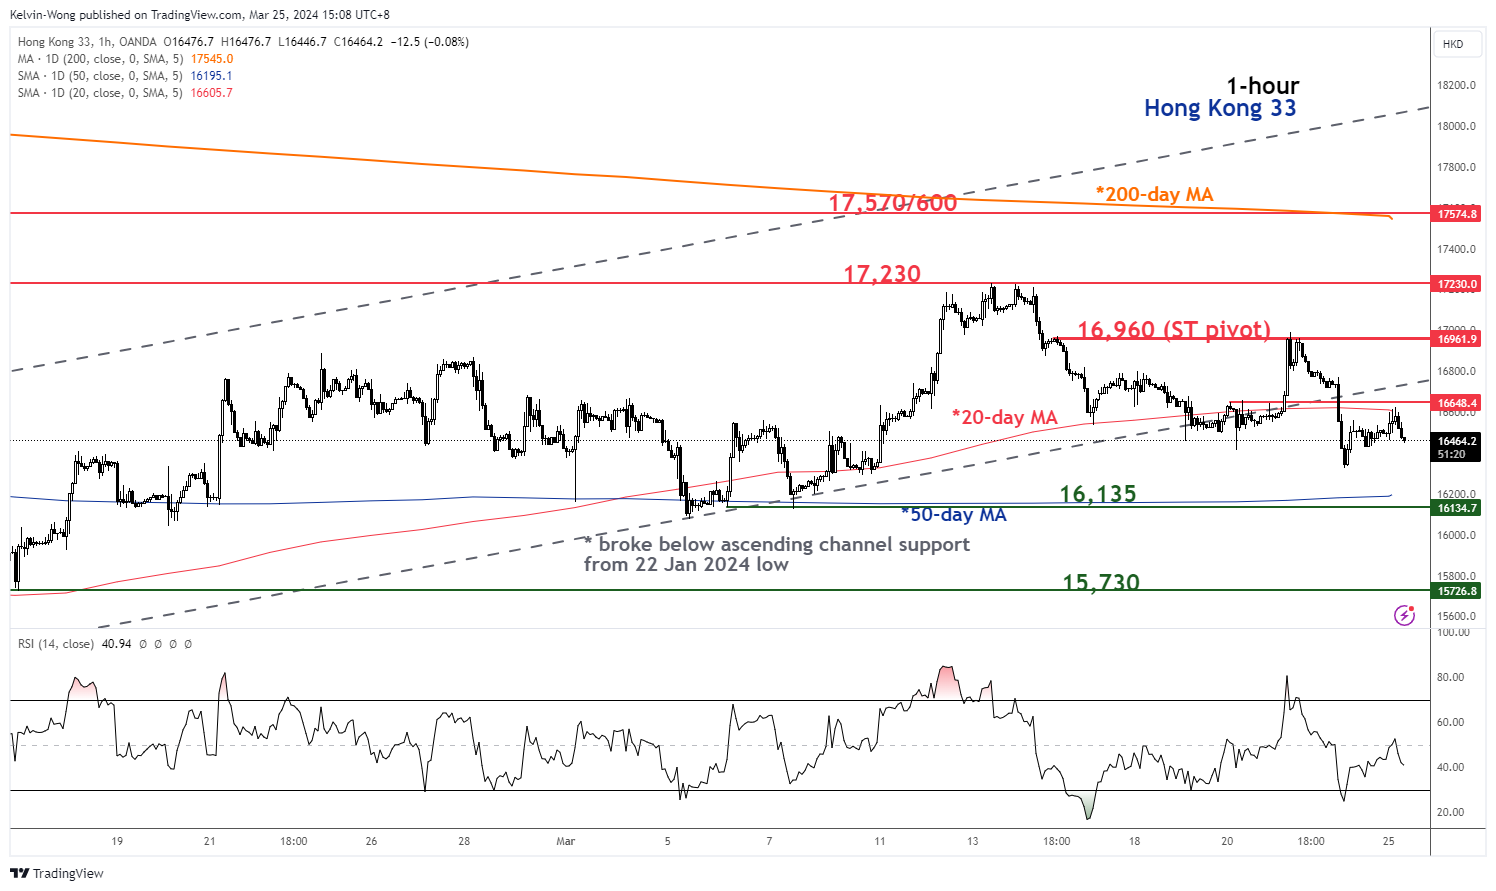
Fig 3: Hong Kong 33 Index short-term trend as of 25 Mar 2024 (Source: TradingView, click to enlarge chart)
The price actions of the Hong Kong 33 Index (a proxy on the Hang Seng Index futures) have staged a bearish breakdown below its former ascending channel support in place since the 22 January 2024 low and its 20-day moving average on last Friday, 22 March.
In addition, the daily RSI momentum has also broken below its key parallel ascending support and just breached below the 50 level which indicates a potential revival of medium-term bearish momentum.
In the lens of technical analysis, this latest set of bearish elements suggests the recent rally of +16% from the 22 January 2024 low of 14,777 has taken the form of a “bearish flag” configuration, aka countertrend rebound motion within its major and long-term secular bearish trend phases (see Fig 2).
Last Friday’s bearish breakdown seen in the “bearish flag” and its daily RSI suggested a likelihood that the bearish impulsive down move sequence has resumed.
If the 16,960 key short-term pivotal resistance is not surpassed to the upside, the Index may see a further potential decline to expose the next intermediate supports at 16,135 (also the 50-day moving average), and 15,730 (see Fig 3).
However, a clearance above 16,960 negates the bearish tone to see a retest on the 17,230 minor swing high area of 13 March 2024, and above it sees the medium-term pivotal resistance coming in at 17,570/600.