Sample Category Title
Instrument of the Week (25-29 March): GBPCAD Spotlight
Instrument of the Week (25-29 March): GBPCAD Spotlight
Discover why FBS reduced the GBPCAD spread and what to do next!
The final week of March 2024 is critical for traders and investors watching the GBPCAD currency pair, with significant economic data releases from the United Kingdom and Canada. The UK will announce its final GDP q/q, which is expected to show a contraction of -0.3%, a key indicator of economic health that could impact the GBP based on the outcome. Meanwhile, Canada's updated GDP m/m forecast suggests a positive change of 0.4%, indicating a potentially more robust economic performance than previously thought.
These GDP figures are pivotal in gauging the economic landscape in both countries, directly influencing investor sentiment and the value of the GBPCAD pair. A stronger-than-expected performance in either economy could bolster the respective currency, while weaker figures might exert downward pressure. The contrasting expectations – a contraction in the UK and growth in Canada – set the stage for potential volatility in the currency pair.
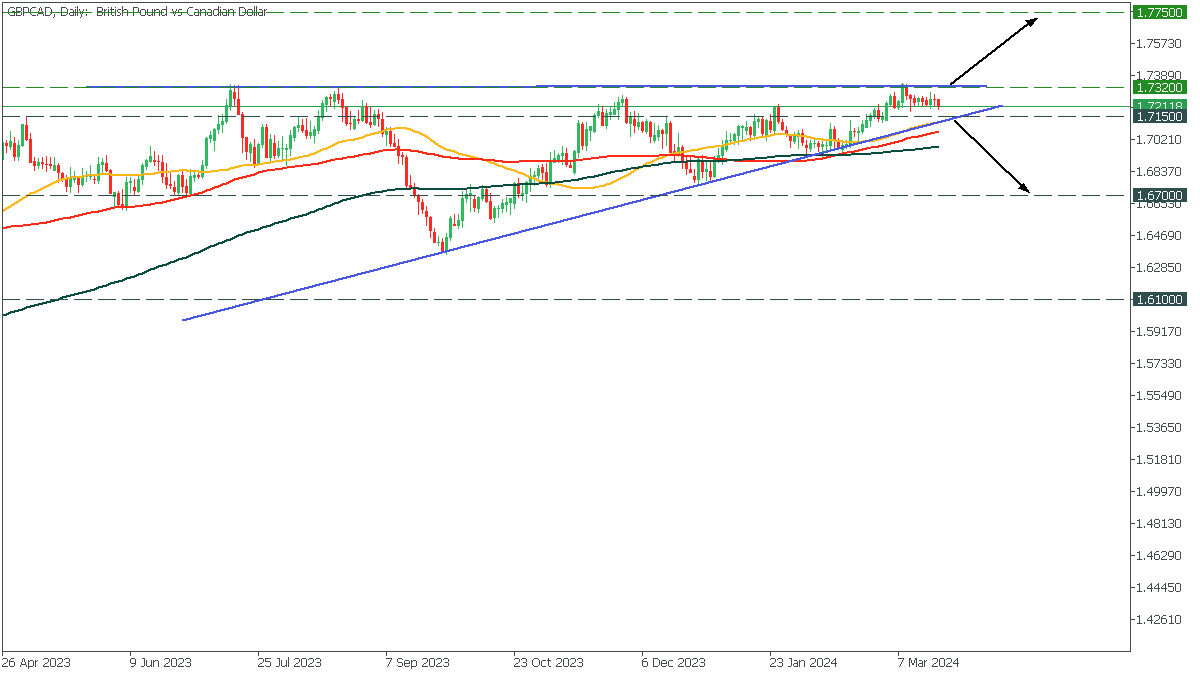
In the Daily Timeframe, GBPCAD formed an ascending triangle pattern, which is a bullish pattern. The moving averages are also bullish, but the Canadian and UK GDP forecasts may have a bearish impact on the pair.
If the price breaks above the resistance at 1.7320, it will soar to 1.7750. At the same time, a trendline breakdown and a fall below the 1.7150 support will drop the price to 1.6700.
Forex and Cryptocurrencies Forecast
EUR/USD: Switzerland Strengthens the Dollar
The key event of the past week was undoubtedly the FOMC (Federal Open Market Committee) meeting of the US Federal Reserve on March 20. As expected, the American Central Bank unanimously decided to maintain the key interest rate at its highest level in 23 years, 5.50%, for the fifth consecutive meeting. Since the rate was anticipated, market participants were significantly more interested in the comments and forecasts of the Fed's leadership. The most important statement came from the head of the regulator, Jerome Powell, who mentioned the consideration of three stages of borrowing cost reduction this year, totalling 75 basis points (bps). The long-term rate forecast was raised from 2.50% to 2.60%.
In comments following the meeting, solid growth in the United States economy was noted. The GDP forecast for this year was increased from 1.4% to 2.1%, and for 2025 from 1.8% to 2.0%. The labour market also appears to be in good health, with unemployment at a low level. According to the new forecast, it could reach 4.0%, compared to the previously expected 4.1%. The number of new jobs created outside of the agriculture sector (NonFarm Payrolls) in February was 275K, significantly exceeding both the previous figure of 229K and the forecast of 198K.
Regarding inflation, while it has eased, it remains "elevated," as noted in the statement. Consumer Price Index (CPI) figures for February showed a 3.2% increase on a year-over-year basis. Inflation is anticipated to settle at 2.4% by the end of 2024, with the core Personal Consumption Expenditures (PCE) index expected to be at 2.6%. Previously, both figures were forecasted to be 2.4% in December.
The comments emphasized that the long-term objective is to bring inflation down to 2.0% while achieving maximum employment. Thus, the Federal Reserve will remain vigilant about inflationary risks. Adjustments to monetary policy parameters may be made if factors emerge that obstruct its objectives. These factors include, but are not limited to, the labor market situation, economic growth, inflation in the US, the state of the global economy, and international events.
As already mentioned, the principal scenario for 2024 includes three rate reductions of 25 basis points each. Nonetheless, members of the FOMC have not discounted the possibility of there being just two or even one reduction. A survey by Reuters found that 72 out of 108 economists, or two-thirds, anticipate the first rate cut to occur in June, with the subsequent ones expected in the fall of this year.
The stock market responded positively to the outcomes of the Federal Reserve's meeting. The S&P 500, Dow Jones, and Nasdaq indices all moved higher, a reaction not mirrored by the Dollar Index (DXY), as news of the beginning of monetary policy easing did not please investors. As a result, EUR/USD surged sharply. However, on March 21, the American currency recouped its losses after the Swiss National Bank (SNB) unexpectedly reduced its key interest rate by 25 basis points to 1.5% at its quarterly meeting, contrary to market expectations of maintaining the rate at 1.75%.
"The easing of monetary policy was made possible thanks to the effective combat against inflation over the last two and a half years," the SNB stated. "Inflation has been below 2% for several months and is within the range that corresponds to the definition of price stability. According to the latest forecast, inflation is expected to remain within this range in the coming years."
Thus, the SNB became the first major central bank to start easing its policy after a long cycle of rate increases due to the COVID-19 pandemic. Consequently, traders "forgot" about the Fed's rate cut signals and began buying dollars, as they currently remain the only high-yield currency with a low risk level.
Support for the dollar towards the end of the working week was also provided by the business activity data in the US published on March 21. The S&P Global Composite PMI index increased to 52.5 from 52.2, and while the PMI index for the services sector decreased from 52.3 to 51.7, it remained above the 50.0 threshold that separates economic growth from contraction. Meanwhile, the Philadelphia manufacturing sector business activity index exceeded forecasts, reaching 3.2, and the number of initial jobless claims in the US for the week fell from 215K to 210K.
EUR/USD concluded the past five-day week at a mark of 1.0808. Regarding the forecast for the near future, as of the writing of this review on the evening of Friday, March 22, 50% of experts voted for the strengthening of the dollar and further decline of the pair. 20% sided with the euro, and 30% took a neutral stance. Among the oscillators on D1, only 15% are coloured green, 85% are coloured red, with a quarter of them indicating the pair is oversold. For trend indicators, the greens have 10%, while the reds hold an absolute majority of 90%. The nearest support for the pair is located in the zone of 1.0795-1.0800, followed by 1.0725, 1.0680-1.0695, 1.0620, 1.0495-1.0515, and 1.0450. Resistance zones are found in the areas of 1.0835-1.0865, 1.0900-1.0920, 1.0965-1.0980, 1.1015, 1.1050, and 1.1100-1.1140.
The upcoming trading week will be shorter than usual due to Good Friday in Catholic countries, where banks and stock exchanges will be closed. It will also be the last week of the month and the first quarter. Market participants will be summarizing the quarter, and there will be few important statistical releases. Nevertheless, notable in the calendar is Thursday, March 28, when data on retail sales in Germany will be released, as well as revised annual data on the US GDP and the volume of jobless claims. On Friday, March 29, despite the holiday, statistics on the consumer market in the United States will be released, and Federal Reserve Chair Jerome Powell is scheduled to speak.
GBP/USD: BoE Hawks Morph into Doves
Data on consumer inflation in the UK, released on Wednesday, March 20, a day ahead of the Bank of England (BoE) meeting, indicated a slight deceleration and fell a bit below expectations. The year-on-year CPI slowed from 4.0% to 3.4%, against the anticipated 3.5%. February's core CPI, on an annual basis, dropped to 4.5% after three months of stability at 5.1%. Conversely, the CPI saw a month-on-month increase of 0.6% following a decline of the same magnitude in January, yet this increase still fell short of the market's 0.7% expectation. February saw producer purchase prices decrease by 0.4%, with a year-on-year loss of 2.7%, returning to levels seen in May 2022 due to decreases in energy, metals, and some agricultural product prices.
Just a few hours before the regulator's meeting, preliminary business activity data were also released, showing positive but mixed results. The Manufacturing PMI rose to 49.9, closely approaching the critical 50.0 mark (with a forecast of 47.8 and a previous value of 47.5). The services sector index, in contrast, dropped from 53.8 to 53.4, despite expectations that it would hold steady. Consequently, the Composite PMI edged down from 53.0 to 52.9, remaining within the growth zone of the economy.
Regarding the Bank of England's meeting on Thursday, March 21, as expected, the regulator kept the key interest rate for the pound unchanged at 5.25% for the fifth consecutive meeting. The Governor, Andrew Bailey, stated that the economy has not yet reached the stage where rates can be lowered but added that everything is moving in the "right direction."
The surprise came when two members of the BoE's Monetary Policy Committee, who had previously voted for a rate increase, reversed their position, leading to renewed selling of the pound. According to economists at Japan's MUFG Bank, the voting outcome "justifies an increased likelihood of an earlier rate cut than we had anticipated. [...] Whether the Bank of England makes the final decision in June or August remains an open question. We maintain our view that there will be a rate cut of 100 basis points this year." "The pound could suffer further in the short term if the market's conviction in a June rate cut strengthens, along with the potential magnitude of rate cuts for this year," the MUFG specialists added.
"Indeed, the Bank of England has taken another step towards reducing interest rates," echo their colleagues at Germany's Commerzbank. "But whether this will happen sooner than expected, simply because none of the policymakers voted for a rate increase, is not entirely clear yet." Commerzbank believes that "against the backdrop of the overall dovish sentiment triggered by the SNB's unexpected rate cut, the pound ended up on the losing side and became the second-worst currency. Also, depending on market sentiments, it has the chance to become one of the most vulnerable currencies."
Starting the past week at a level of 1.2734, GBP/USD concluded it at 1.2599. Analyst opinions on its near-term direction were split: half (50%) voted for the pair's decline, 25% for its rise, and 25% maintained neutrality. The indicator readings on D1 are exactly the same as for EUR/USD. Among oscillators, only 15% look north, 85% south, with a quarter of them signalling the pair is oversold. For trend indicators, 10% recommend buying, and 90% selling. Should the pair move southward, it will encounter support levels and zones at 1.2575, 1.2500-1.2535, 1.2450, 1.2375, 1.2330, 1.2085-1.2210, 1.2110, 1.2035-1.2070. In the event of an upward movement, resistance will be met at levels 1.2635, 1.2730-1.2755, 1.2800-1.2820, 1.2880-1.2900, 1.2940, 1.3000, and 1.3140.
No significant events related to the economy of the United Kingdom are scheduled for the upcoming week. Traders should also bear in mind that March 29 is a public holiday in the country due to Good Friday.
USD/JPY: How the BoJ Sank the Yen
In theory, if the interest rate rises, the currency strengthens. But that's just in theory. Reality can differ significantly, as demonstrated by the Bank of Japan's (BoJ) meeting on Tuesday, March 19.
Until that point, the BoJ had been the only central bank in the world to maintain a negative interest rate level of -0.1% since February 2016. Now, for the first time in 17 years, the regulator raised it to a range of 0.0-0.1% per annum. It also abandoned control over the yield of ten-year government bonds (YCC). As media reports, this move "represents a departure from the most aggressive and unconventional monetary easing policy we have seen in modern history." Yet, following this momentous decision, instead of appreciating, the yen ... plummeted, and USD/JPY reached a high of 151.85. Analysts believe this happened because each of these central bank actions met market expectations and had already been priced in.
Data on inflation in Japan for February, published towards the end of the workweek, offered some support to the Japanese currency. The country's Statistical Bureau reported that the annual national Consumer Price Index (CPI) rose by 2.8%, up from 2.2% previously. As a result, investors concluded that the persistence of price pressure above the target level of 2.0% would allow the Bank of Japan to maintain interest rates at a positive level.
However, maintaining rates does not mean increasing them. And as economists from ING, the largest banking group in the Netherlands, wrote, the yen's position depends more on the Federal Reserve's rate cuts than on a rate hike by the BoJ. They stated: "It will be difficult for the yen to sustainably strengthen beyond volatility around the rate hike until rates in the US are lowered."
The yen received another, but very weak, support from growing speculations about possible intervention by the Japanese government in the currency sphere, in simpler terms, about currency interventions. Japan's Finance Minister, Shunichi Suzuki, did declare that currency movements should be stable and that he is closely monitoring exchange rate fluctuations. However, these were merely words, not concrete actions, thus they didn't significantly aid the national currency. As a result, the week concluded with the pair marking the final note at 151.43.
Regarding the near future of USD/JPY, the bearish camp for the pair comprises 50% of experts, 40% remain undecided, and 10% voted for further strengthening of the US currency. Technical analysis tools seem to be unaware of rumours about possible currency interventions. Consequently, all 100% of trend indicators and oscillators on D1 are pointing upwards, with 20% of the latter in the overbought zone. The nearest support levels are found at 150.85, 149.70, 148.40, 147.30-147.60, 146.50, 145.90, 144.90-145.30, 143.40-143.75, 142.20, and 140.25-140.60. Resistance levels and zones are located at 151.85-152.00, 153.15, and 156.25.
On Friday, March 29, the Consumer Price Index (CPI) values for the Tokyo region will be published. Besides this, no other significant events related to the Japanese economy are scheduled for the coming days.
CRYPTOCURRENCIES: Bitcoin – The Calm Before the Halving
After bitcoin reached a new all-time high of $73,743 on March 14, a wave of selloffs and profit-taking by short-term speculators followed. BTC/USD sharply retreated, losing approximately 17.5%. A local minimum was recorded at $60,778, after which the leading cryptocurrency, in anticipation of the halving, began to gain momentum again.
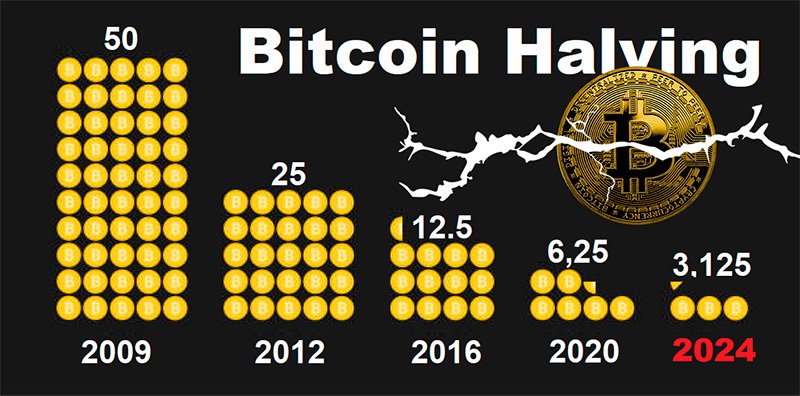
It's worth recalling that a halving is an event that occurs approximately every four years, after another 210,000 blocks have been mined, and results in the mining reward for a new block in the bitcoin blockchain being cut in half. This naturally raises the question: why is this done? The halving is designed as a mechanism to combat inflation. As miners' rewards decrease, fewer new coins are produced with each round. This is intended to maintain a scarcity of bitcoin in the market and positively impact the token's price from a supply and demand perspective.
The total issuance of bitcoin is capped at 21 million coins. As of December 2023, miners have already extracted 19.5 million coins, which is nearly 93% of the total volume. Halvings will continue until the last bitcoin is mined, which is forecasted to occur sometime between 2040 and 2048. In 2040 (the 8th halving), miners' rewards will be 0.1953125 BTC, and in 2048 (the 10th halving) – 0.048828125 BTC. After this, miners will earn income solely from transaction fees. The upcoming, fourth halving is most likely to take place on April 20 this year, with the reward for mined blocks decreasing from 6.25 BTC to 3.125 BTC.
Thanks to the hype surrounding spot bitcoin ETFs and the FOMO (Fear of Missing Out) effect in anticipation of the halving, a certain scarcity of the main cryptocurrency is already observable. According to Bitcointreasuries, a significant portion of BTC is owned by state and private investment companies, governments, exchange and investment funds. In total, they hold approximately 12% of the total volume of bitcoins. About 10% is stored on centralized cryptocurrency exchanges, and another 8.09% belongs to accounts that have been inactive for many years. Adding to these figures the share of the asset attributed to bitcoin's founder, Satoshi Nakamoto (4.76%), it can be concluded that about 35% of mined coins are already unavailable to other private investors.
Grayscale Bitcoin Trust, iShares Bitcoin Trust, and Fidelity Wise Origin Bitcoin Fund lead in terms of bitcoin ownership volumes with 380,241 BTC, 230,617 BTC, and 132,571 BTC, respectively. MicroStrategy has become the largest holder of bitcoins among public companies with 205,000 BTC on its balance sheet. Marathon Digital holds the second position with 15,741 BTC, while Tesla and Coinbase Global share the third and fourth places with 9,720 BTC and 9,480 BTC, respectively. Among other, non-public, private companies, Block.one leads in ownership level with 164,000 BTC, according to available information. It is followed by the MTGOX exchange with a balance of 141,686 BTC. Stablecoin issuer Tether owns 66,465 BTC. The fourth position is taken by the BitMEX exchange with 57,672 BTC.
In the ranking of bitcoin ownership among countries, the USA leads with 215,000 BTC, followed by China with 190,000 BTC, the UK with 61,000 BTC, and Germany with 50,000 BTC.
Analysts at Standard Chartered Bank have revised their bitcoin price target for the end of 2024 from $100,000 to $150,000, with ethereum potentially reaching $8,000 by the same period. By the end of 2025, the first and second cryptocurrencies could appreciate to $200,000 and $14,000, respectively. The specialists justify their forecast by the dynamics of gold following the approval of bitcoin ETFs and the optimization of the precious metal to its digital counterpart in an 80% to 20% ratio.
According to Standard Chartered experts, bitcoin could appreciate further – up to $250,000 – if inflows into ETFs reach $75 billion. Sovereign investment funds' actions could also accelerate growth rates. "We see an increasing likelihood that major reserve managers might announce bitcoin purchases in 2024," say the bank's analysts.
Dan Tapiero, CEO of investment firm 10T Holdings, mentioned a similar figure – $200,000. "I don't think it's that crazy," he stated. According to the financier's calculations, the potential to triple from the current price roughly corresponds to the percentage difference between the peaks of 2017 and 2021. Furthermore, from the bear market lows to the 2021 peak, digital gold increased in value 20 times. This suggests a $300,000 target as a positive scenario.
"It's hard to pinpoint exact markers and timing in these matters. I think we will reach that [zone] within the next 18-24 months, perhaps even sooner," Tapiero believes. "The supply cut during the rapid increase in demand for ETFs along with the halving indicate a significant growth potential. I think the first cryptocurrency will pull the rest along with it." The CEO of 10T Holdings also noted "good chances" for the approval of ETFs based on Ethereum. However, he hesitated to say whether these ETFs would be registered in May or if it would happen later.
OpenAI's ChatGPT, when asked whether the BTC price could reach the $100,000 mark before the halving, deemed this target plausible. According to the AI's calculations, the recent correction does not affect growth prospects and only confirms the inaccuracy of short-term forecasts. ChatGPT estimated the probability of reaching $100,000 at 40%, while the likelihood of hitting the $85,000 mark was assessed at 60%.
As of the writing of this review, on the evening of Friday, March 22, BTC/USD is trading around $63,000. The total market capitalization of cryptocurrencies has decreased to $2.39 trillion (from $2.58 trillion a week ago). The Crypto Fear & Greed Index has dropped from 83 to 75 points, moving from the Extreme Greed zone to the Greed zone.
Despite the recent halt in bitcoin's decline, some experts do not rule out the possibility that BTC/USD could take another dip southward. For instance, Kris Marszalek, CEO of Crypto.com, believes that the current volatility of BTC is still low compared to previous cycles. This implies that with an increase in volatility, not only new highs but also new lows could be set.
Analysts at JPMorgan believe that bitcoin could fall by 33% after the halving. Meanwhile, Mike Novogratz, CEO of Galaxy Digital, is confident that the floor is at $50,000, and the price of the coin will never fall below that level unless some dramatic event occurs. According to him, bitcoin's growth is primarily driven by investors' insatiable appetite for the token, rather than macroeconomic factors such as the policy of the US Federal Reserve. This was evidenced by the fact that the price of bitcoin hardly noticed the Federal Reserve's meeting on March 20.
EUR/USD Weekly Outlook
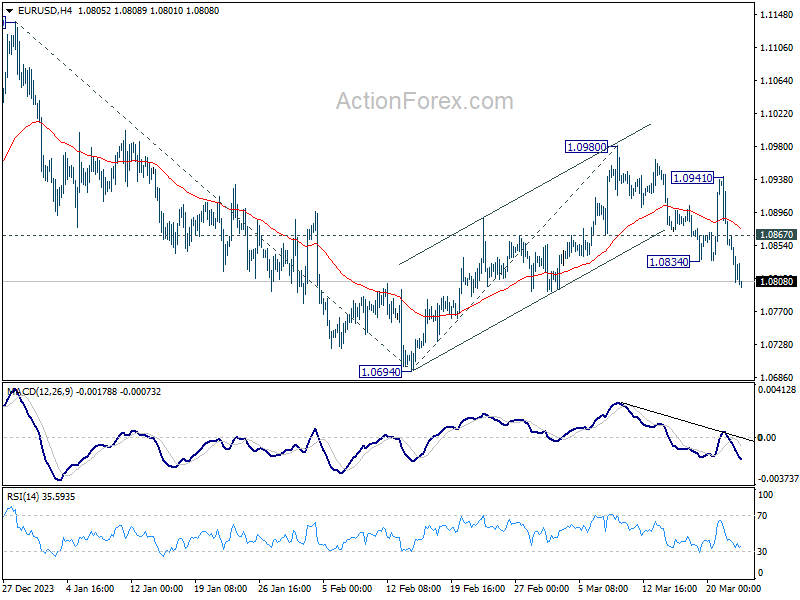
EUR/USD's fall from 1.0980 continued last week and the strong break of 55 D EMA suggest that rebound from 1.0694 has completed. Initial bias stays on the downside for retesting 1.0694 first. Break there will resume the decline from 1.1138 and target 100% projection of 1.1138 to 1.0694 from 1.0980 at 1.0536. On the upside, above 1.0867 minor resistance will turn intraday bias neutral first. But risk will stay on the downside as long as 1.0941 resistance holds.
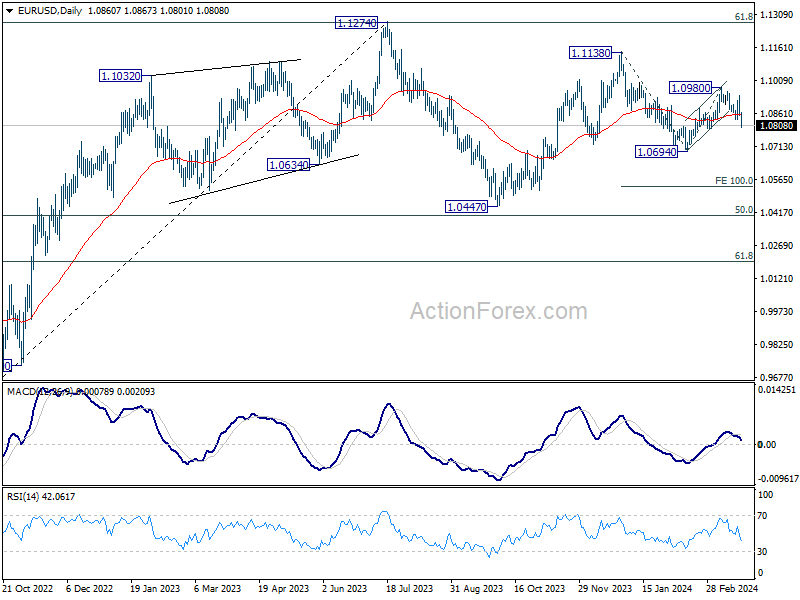
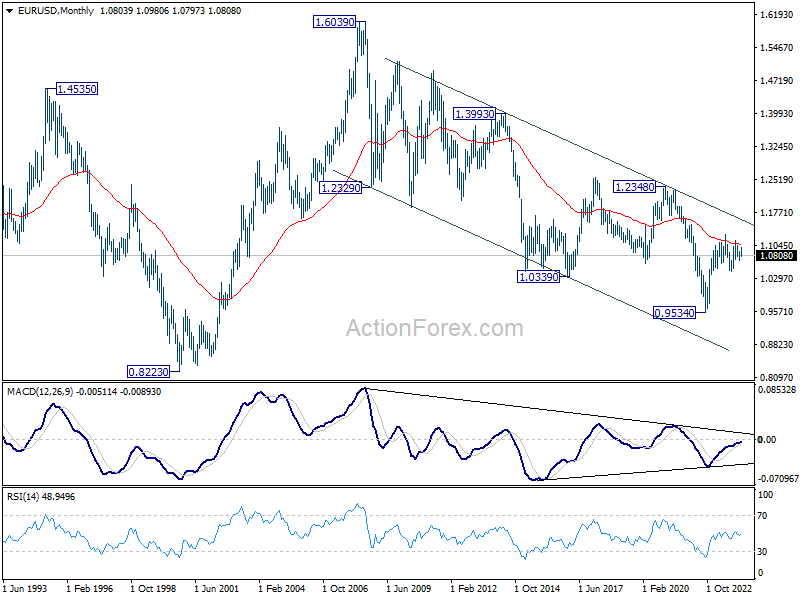
In the bigger picture, price actions from 1.1274 are viewed as a corrective pattern to rise from 0.9534 (2022 low). Rise from 1.0447 is seen as the second leg. While further rally could cannot be ruled out, upside should be limited by 1.1274 to bring the third leg of the pattern. Meanwhile, sustained break of 1.0694 support will argue that the third leg has already started for 1.0447 and possibly below.
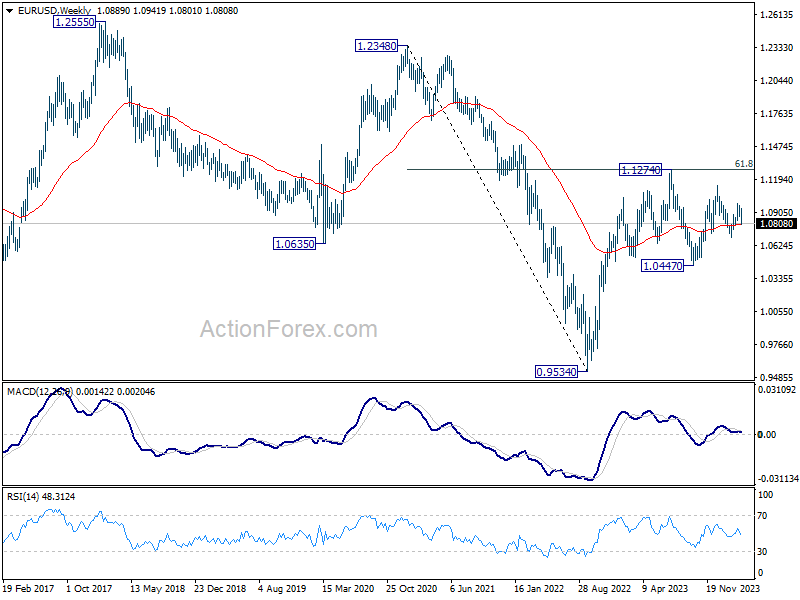
In the long term picture, a long term bottom is in place at 0.9534 on bullish convergence condition in M MACD. It's still early to call for bullish trend reversal with the pair staying inside falling channel in the monthly chart. Nevertheless, sustained trading above 55 M EMA (now at 1.1060) and break of 1.1274 resistance will raise the chance of reversal and target 1.2348 resistance for confirmation.
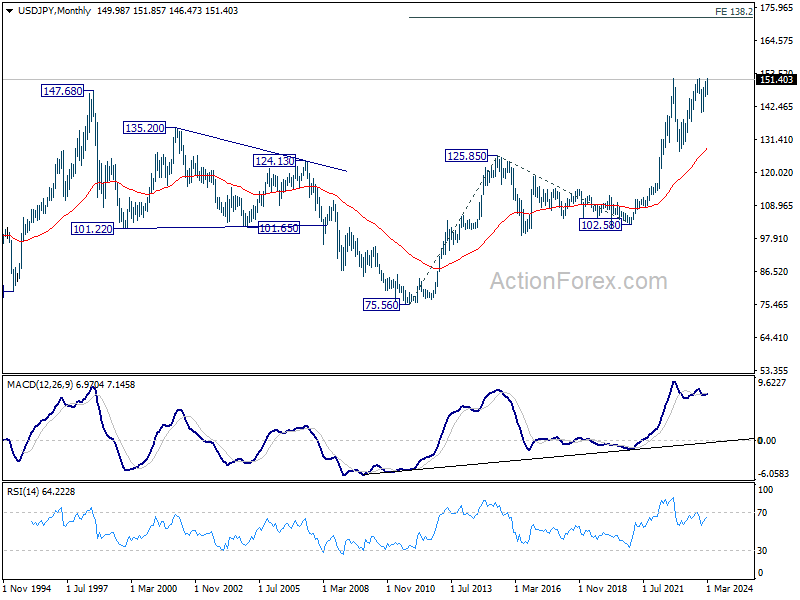
USD/JPY Weekly Outlook
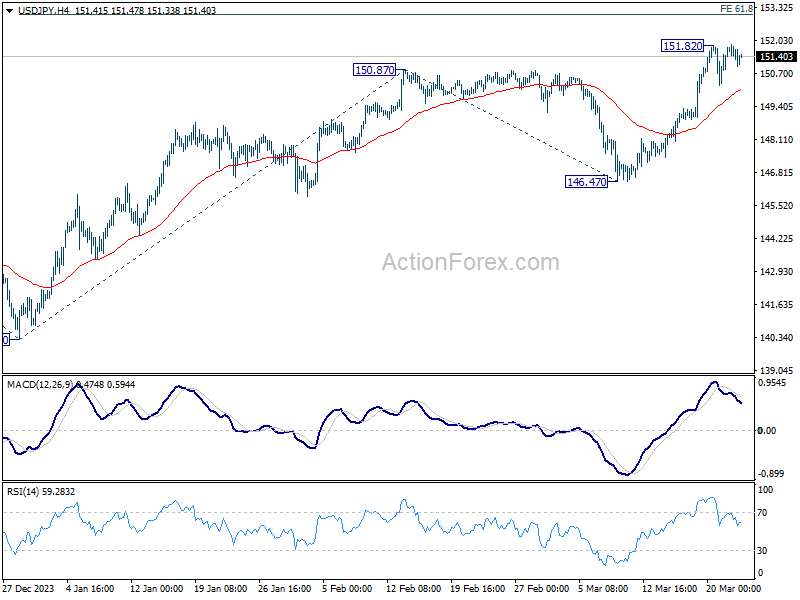
USD/JPY's rally resumed last week and edged higher to 151.82, but turned sideway since then. Initial bias stays neutral this week for more consolidations. Further rally is expected as long as 55 4H EMA (now at 150.11) holds. On the upside, decisive break of 151.93 key resistance will confirm long term up trend resumption. Next near term target will be 61.8% projection of 140.25 to 150.87 from 146.47 at 153.03. However, sustained trading below 55 4H EMA will bring deeper fall back to 146.47 support instead.
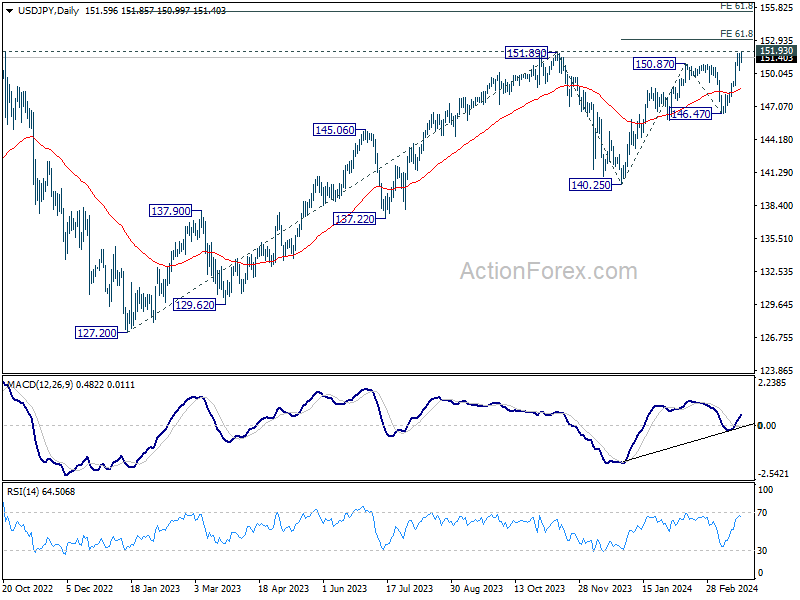
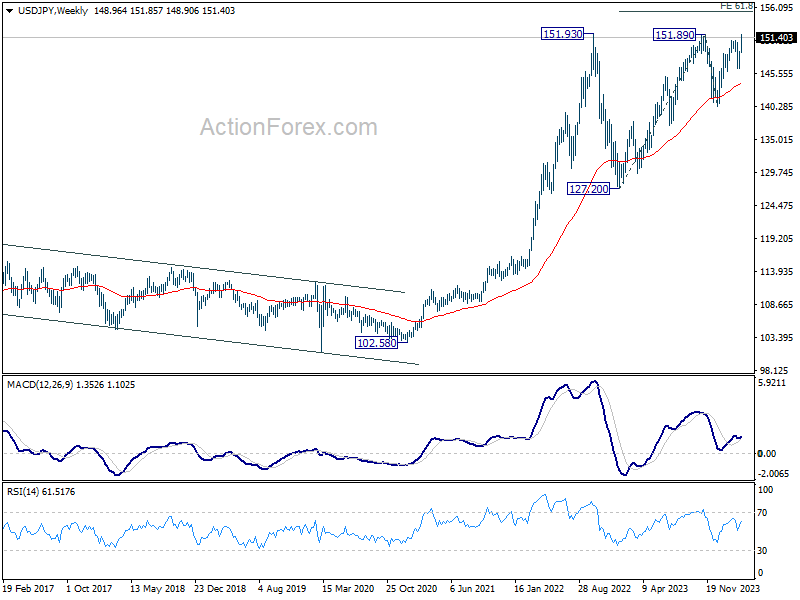
In the bigger picture, correction from 151.87 (2023) high could have completed at 140.25 already. Rise from 127.20 (2023 low), as part of the long term up trend, is probably ready to resume. Decisive break of 151.93 resistance (2022 high) will confirm this bullish case. Next medium term target will be 61.8% projection of 127.20 to 151.89 from 140.25 at 155.20. This will remain the favored case as long as 146.47 support holds, in case of another pullback.
In the long term picture, as long as 127.20 support holds(2023 low), up trend from 75.56 (2011 low) is still in favor to continue through 151.93 (2022 high).
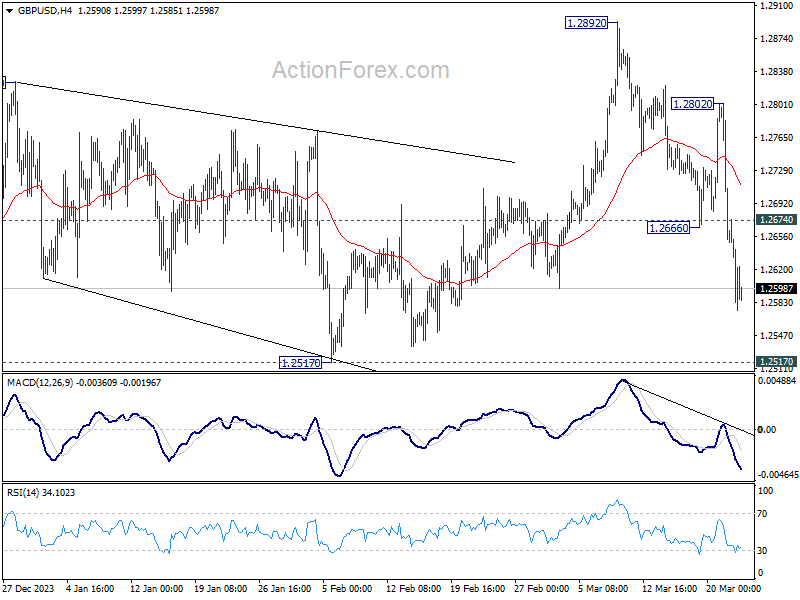
GBP/USD Weekly Outlook
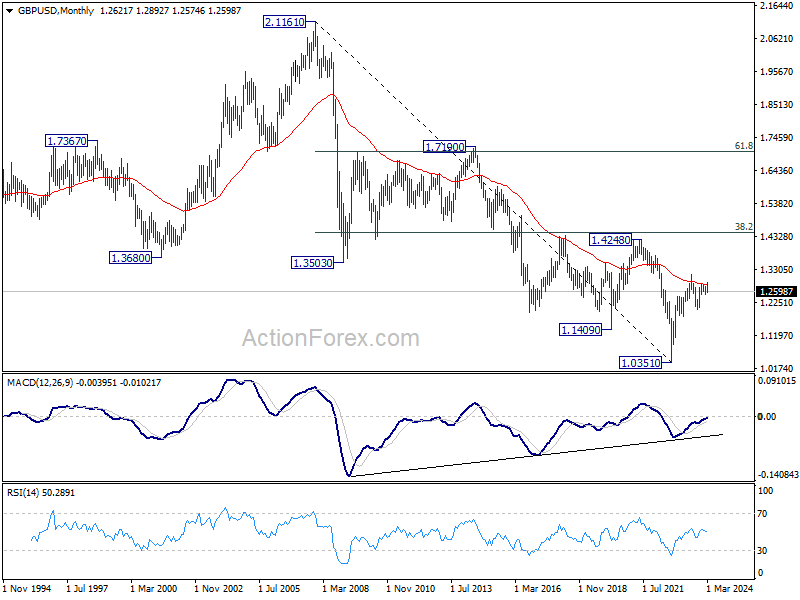
GBP/USD's fall from 1.2892 accelerated lower last week, despite interim rebound. Initial bias stays on the downside this week for 1.2517 support. Decisive break there will suggest that rise from 1.2036 has completed at 1.2892 already, and turn near term outlook bearish On the upside, above 1.2674 minor resistance will turn intraday bias neutral first.
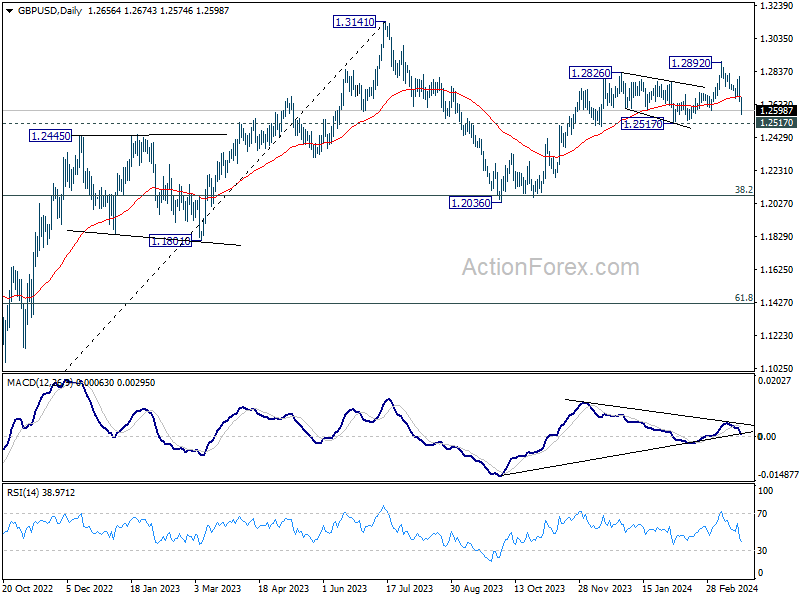
In the bigger picture, price actions from 1.3141 medium term top are seen as a corrective pattern to up trend from 1.0351 (2022 low). Rise from 1.2036 is seen as the second leg, which might still be in progress. But upside should be limited by 1.3141 to bring the third leg of the pattern. Meanwhile, break of 1.2517 support will argue that the third leg has already started for 38.2% retracement of 1.0351 (2022 low) to 1.3141 at 1.2075 again.
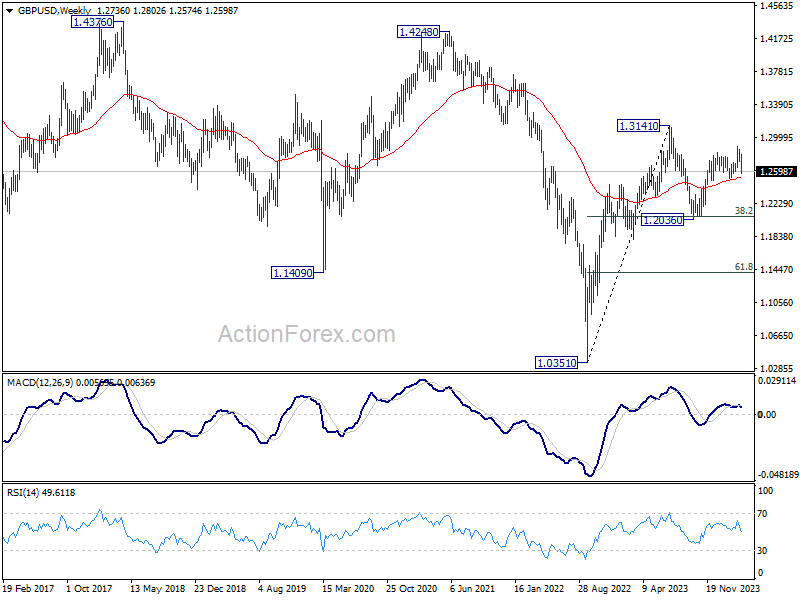
In the long term picture, a long term bottom should be in place at 1.0351 on bullish convergence condition in M MACD. But momentum of the rebound from 1.3051 argues GBP/USD is merely in consolidation, rather than trend reversal. Range trading is likely between 1.0351/4248 for some more time.
USD/CHF Weekly Outlook
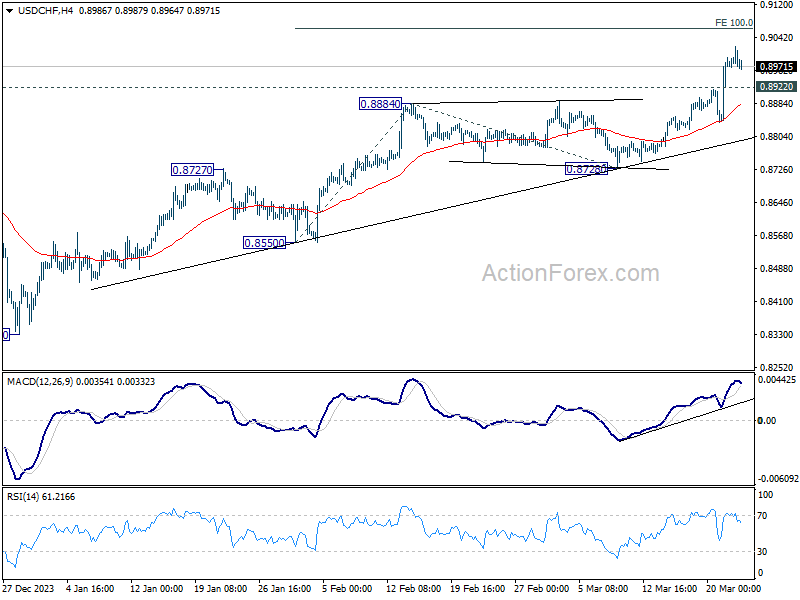
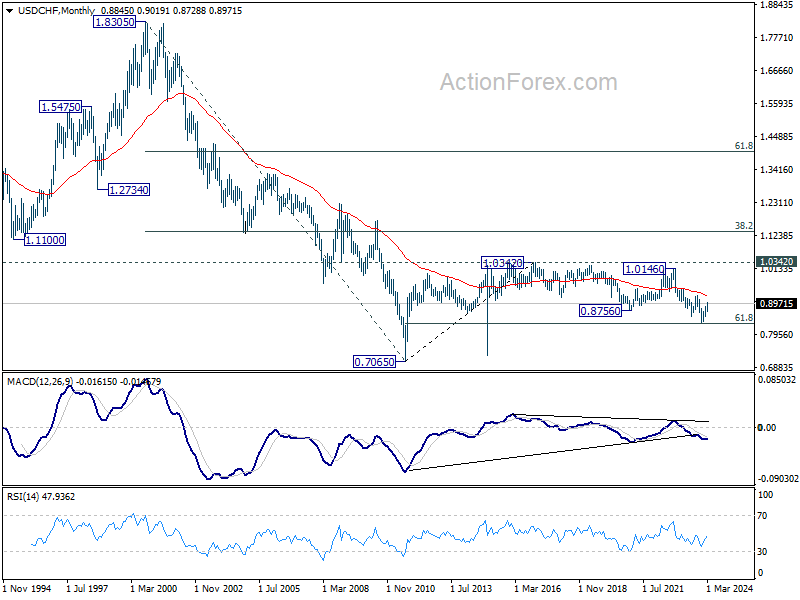
USD/CHF's rally resumed last week and surged to 0.9019. Initial bias stays on the upside for 100% projection projection of 0.8550 to 0.8884 from 0.8728 at 0.9062. On the downside, below 0.8922 minor support will turn intraday bias neutral and bring consolidations. But, outlook will remain bullish as long as 0.8728 support holds.
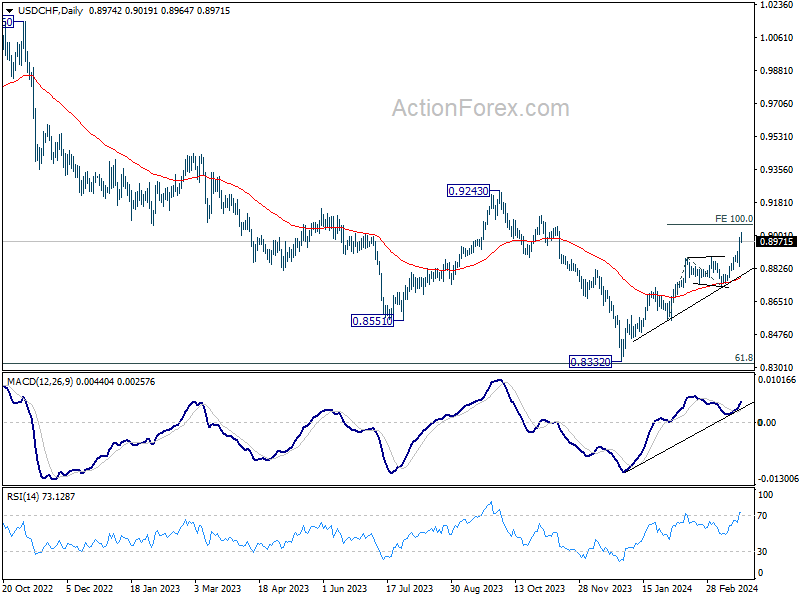
In the bigger picture, price actions from 0.8332 medium term bottom as tentatively seen as developing into a corrective pattern to the down trend from 1.0146 (2022 high). Further rise would be seen as long as 0.8728 support holds. But upside should be limited by 0.9243 resistance, at least on first attempt.
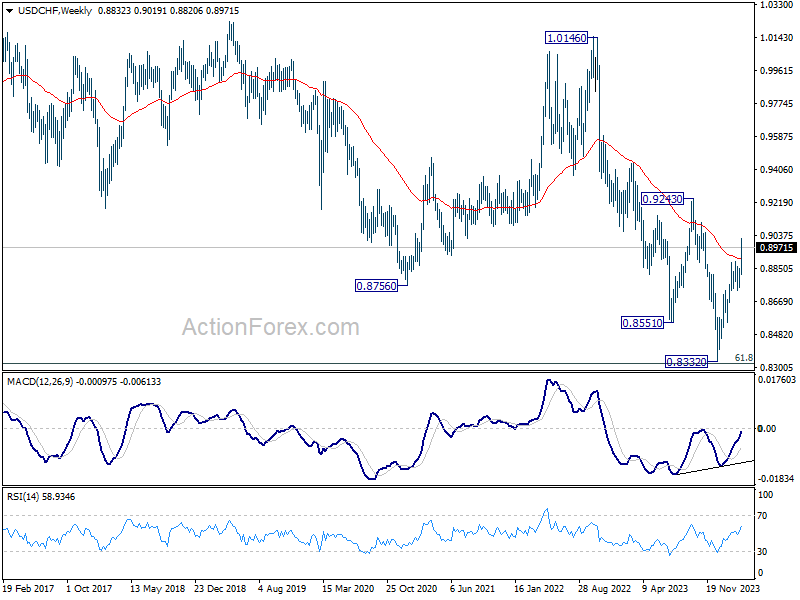
In the long term picture, price action from 0.7065 (2011 high) are seen as a corrective pattern to the multi-decade down trend from 1.8305 (2000 high). Strong rebound from 61.8% retracement of 0.7065 to 1.0342 (2016 high) will start the third leg as a medium term rally. But there will be no sign of long term reversal until firm break of 38.2% retracement of 1.8305 to 0.7065 at 1.1359.
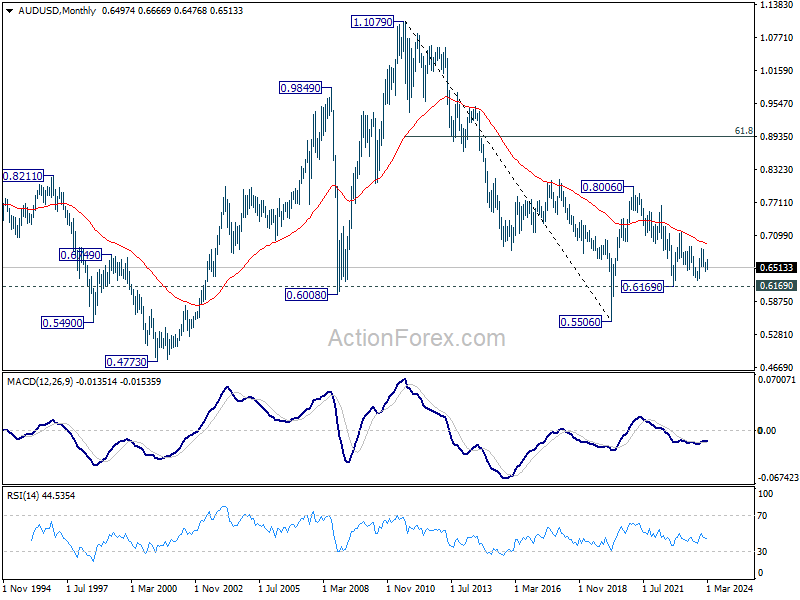
AUD/USD Weekly Report
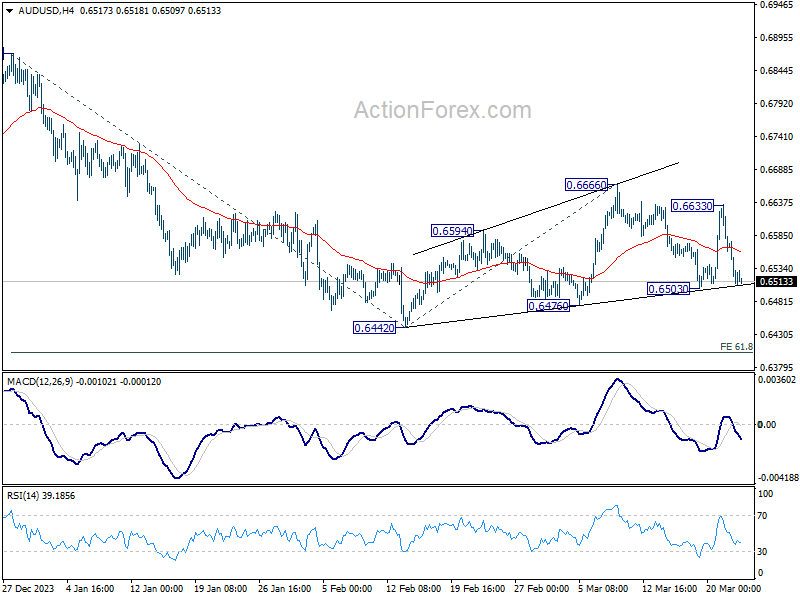
AUD/USD's strong was rebound last week was capped below 0.6666 resistance, and followed by equally steep decline. Initial bias remains neutral this week first, with focus on 0.6503 support. Decisive break there will indicate that larger fall from 0.6870 is ready to resume, and turn bias to the downside for 0.6442 low. For now, risk will stay on the downside as long as 0.6633 resistance holds, in case of recovery.
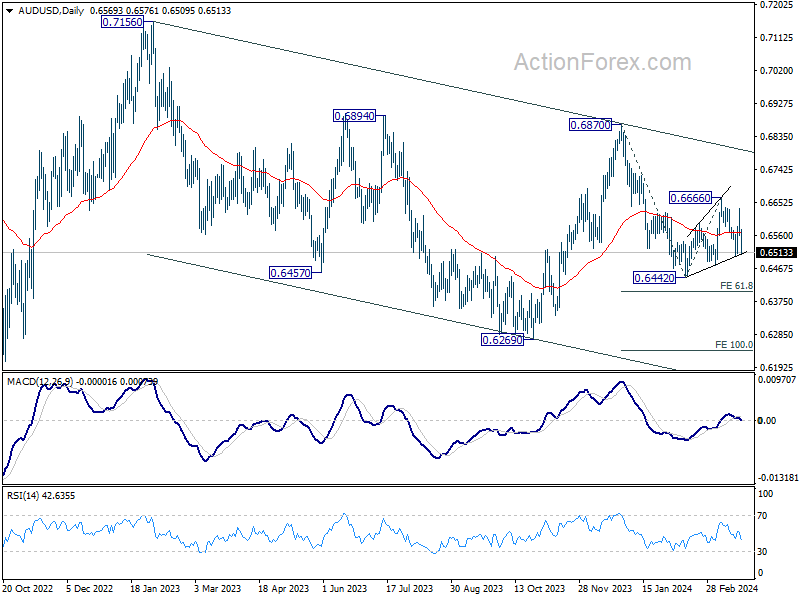
In the bigger picture, price actions from 0.6169 (2022 low) are seen as a medium term corrective pattern to the down trend from 0.8006 (2021 high). Fall from 0.7156 (2023 high) is seen as the second leg, which might still be in progress. Overall, sideway trading could continue in range of 0.6169/7156 for some more time. But as long as 0.7156 holds, an eventual downside breakout would be mildly in favor.
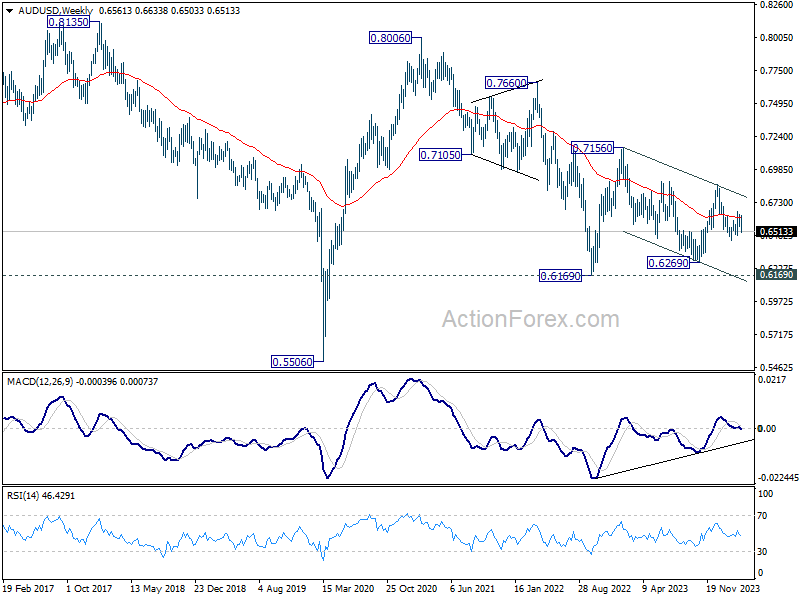
In the long term picture, the down trend from 1.1079 (2011 high) should have completed at 0.5506 (2020 low) already. It's unsure yet whether price actions from 0.5506 are developing into a corrective pattern, or trend reversal. But in either case, fall from 0.8006 is seen the second leg of the pattern. Hence, in case of deeper decline, strong support should emerge above 0.5506 to bring reversal.
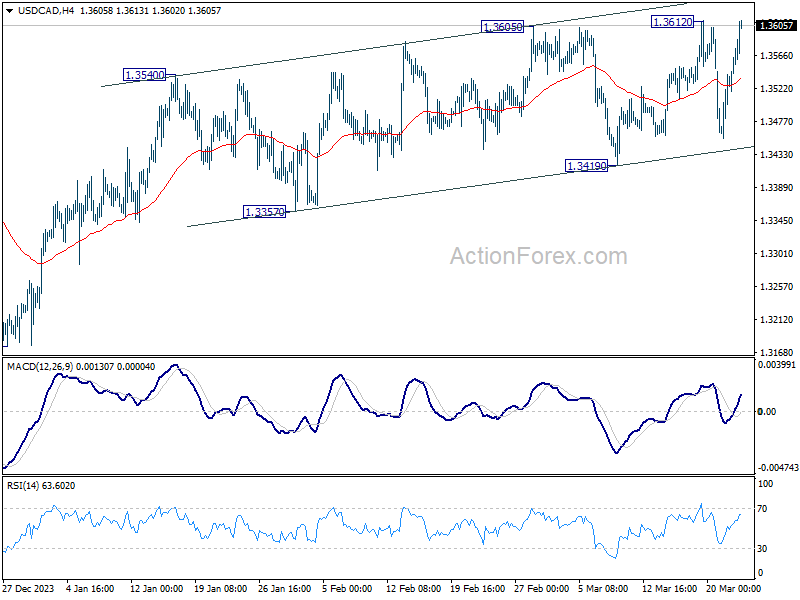
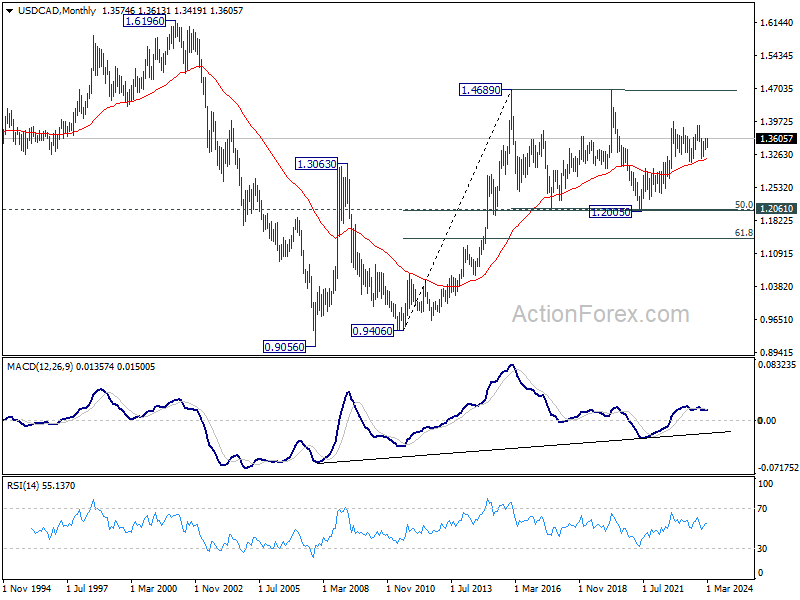
USD/CAD Weekly Outlook
Much volatility was seen in USD/CAD last week. But after all, near term outlook remains bullish with 1.3419 support intact. Initial focus is now on 1.3612 resistance. Decisive break there will resume whole rise from 1.3176 towards 1.3897 resistance. On the downside, firm break of 1.3419 support will argue that rebound from 1.3176 has completed. Near term outlook will be turned bearish for 1.3357 support first.
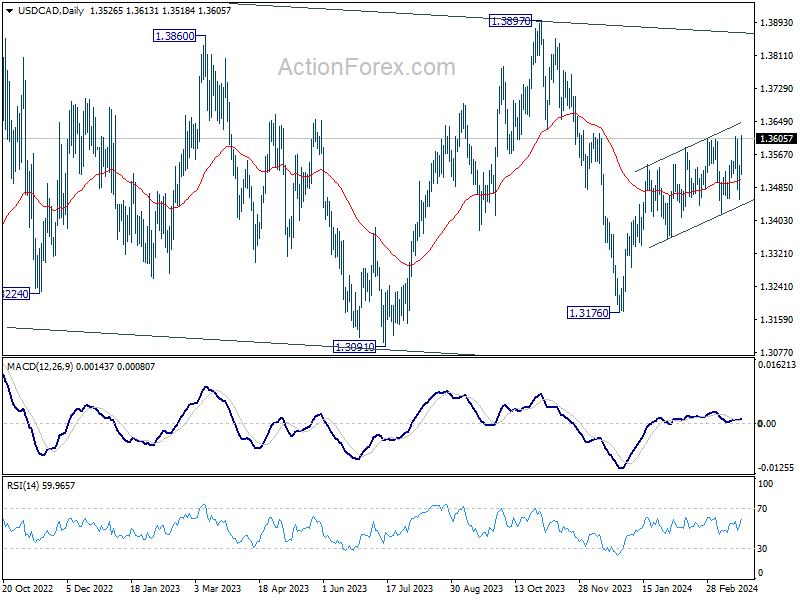
In the bigger picture, price actions from 1.3976 (2022 high) are viewed as a corrective pattern only. In case of another fall, strong support should emerge above 1.2947 resistance turned support to bring rebound. Overall, larger up trend from 1.2005 (2021 low) is still expected to resume through 1.3976 at a later stage.
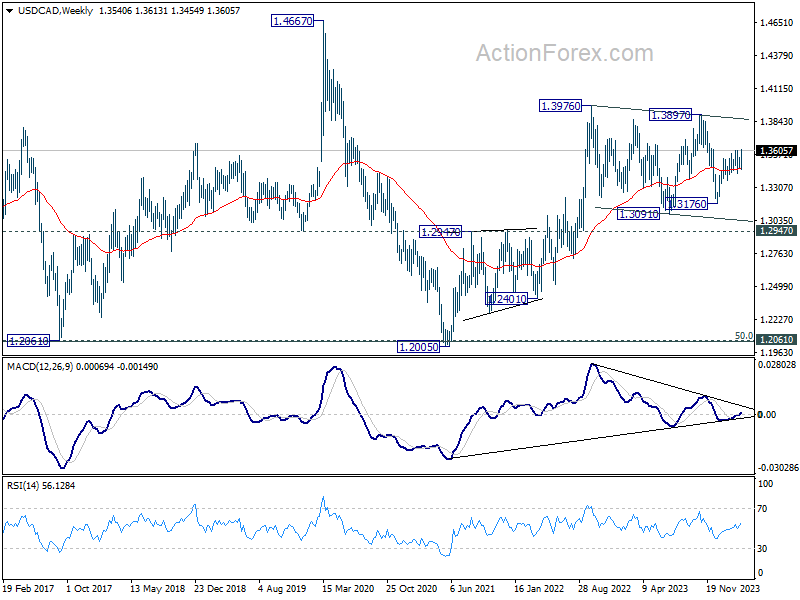
In the longer term picture, price actions from 1.4689 (2016 high) are seen as a consolidation pattern, which might have completed at 1.2005. That is, up trend from 0.9506 (2007 low) is expected to resume at a later stage. This will remain the favored case as long as 1.2947 resistance turned support holds.
GBP/JPY Weekly Outlook
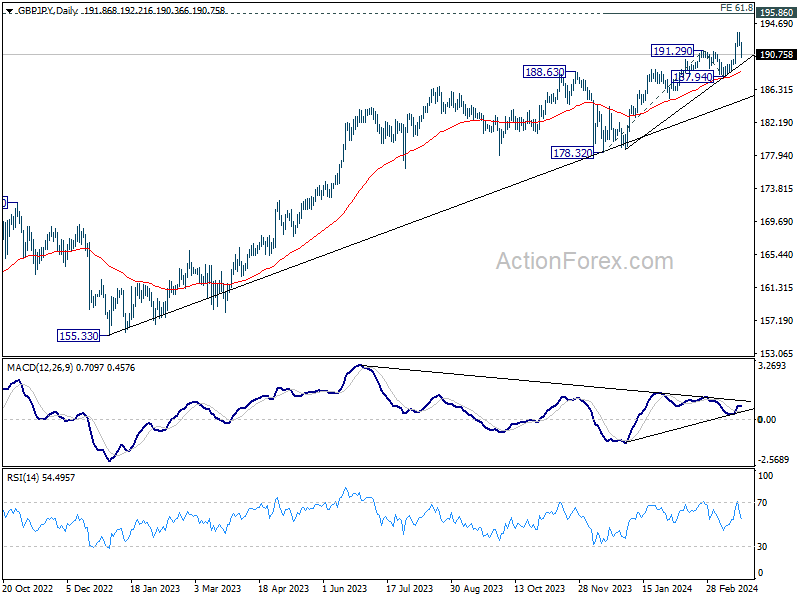
GBP/JPY's up trend resumed last week and surged to 193.51, but retreated notably since then. Initial bias remains neutral this week for more corrective trading. Nevertheless, outlook will stay bullish as long as 187.94 support holds. On the upside, break of 193.51 will resume larger up trend to 61.8% projection of 178.32 to 191.29 from 187.94 at 195.95, which is close to 195.86 long term resistance.
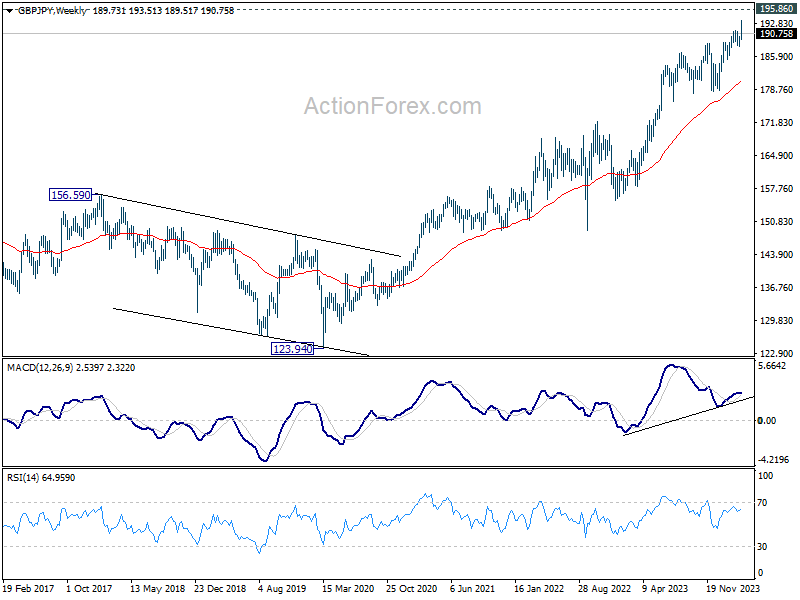
In the bigger picture, current rally is part of the up trend from 123.94 (2020 low), and is in progress for long term resistance (2015 high). Break of 187.94 support is needed to be the first sign of medium term topping. Otherwise, outlook will remain bullish in case of retreat.
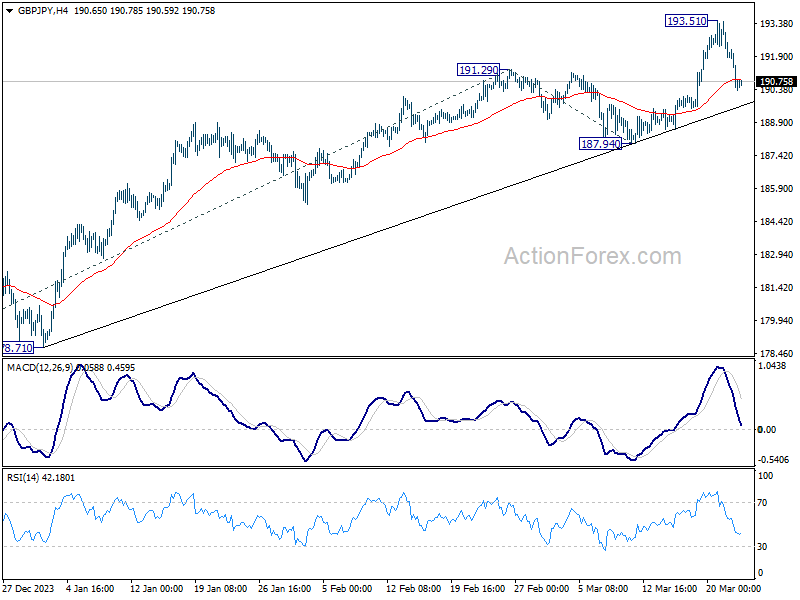
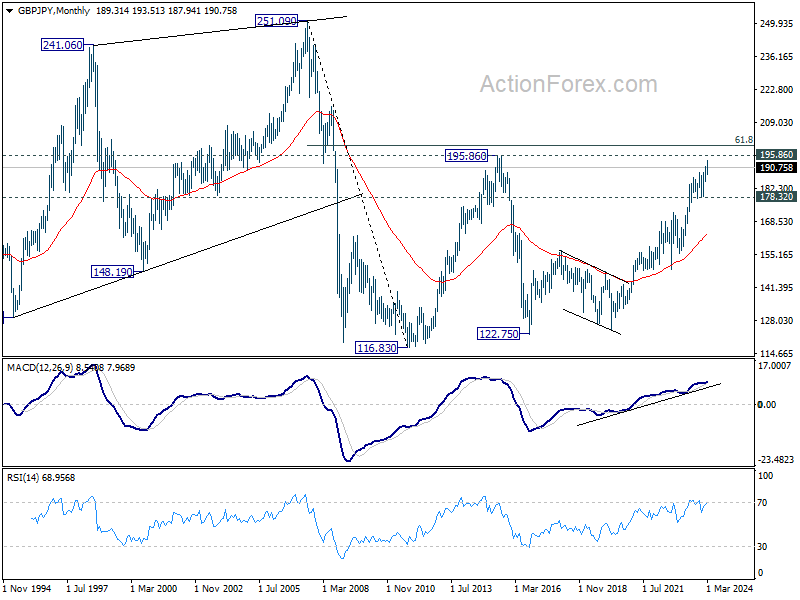
In the longer term picture, rise from 122.75 (2016 low) is seen as the third leg of the pattern from 116.83 (2011 low). Further rally will remain in favor as long as 178.32 support holds. Break of 195.86 (2015 high) is possible. But strong resistance could be seen from 61.8% retracement of 251.09 (2007 high) to 116.83 at 199.80 to limit upside, at least on first attempt.