Sample Category Title
AUD/USD and NZD/USD Grind Higher Steadily
AUD/USD is moving higher and might rally if it clears 0.6600. NZD/USD is also rising and could extend its increase above the 0.6220 resistance zone.
Important Takeaways for AUD/USD and NZD/USD Analysis Today
- The Aussie Dollar is moving higher from the 0.6540 zone against the US Dollar.
- There is a key bullish trend line forming with support at 0.6555 on the hourly chart of AUD/USD at FXOpen.
- NZD/USD is showing positive signs above the 0.6180 support.
- There is a major bullish trend line forming with support at 0.6190 on the hourly chart of NZD/USD at FXOpen.
AUD/USD Technical Analysis
On the hourly chart of AUD/USD at FXOpen, the pair remained stable near the 0.6500 zone, as discussed in the previous analysis. The Aussie Dollar formed a base and started a decent increase above the 0.6540 resistance against the US Dollar
The bulls pushed the pair above the 0.6550 resistance zone. There was a close above the 0.6565 resistance and the 50-hour simple moving average.
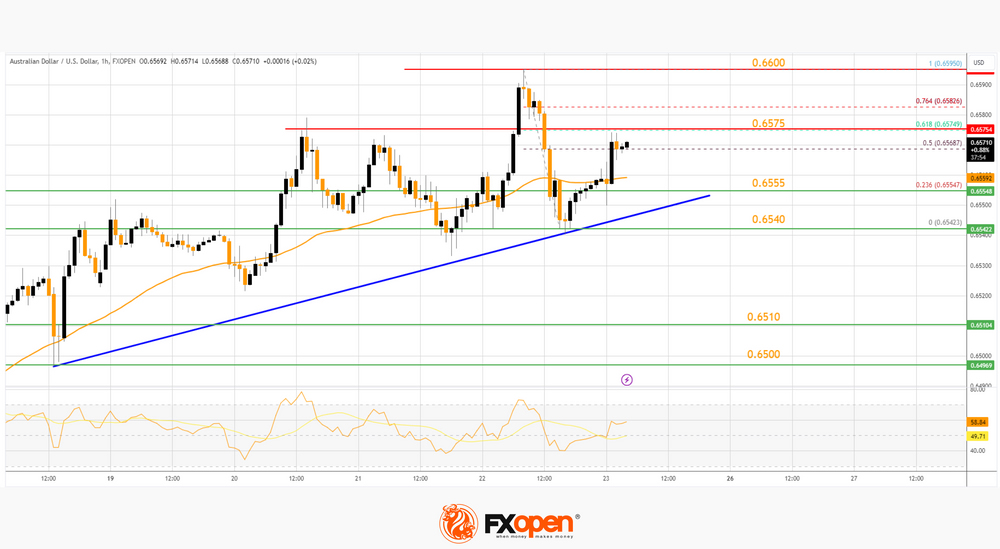
The pair is now consolidating near the 50% Fib retracement level of the downward move from the 0.6595 swing high to the 0.6542 low. On the upside, the AUD/USD chart indicates that the pair is now facing resistance near 0.6575.
The 61.8% Fib retracement level of the downward move from the 0.6595 swing high to the 0.6542 low is also near 0.6575. The first major resistance might be 0.6600. An upside break above the 0.6600 resistance might send the pair further higher.
The next major resistance is near the 0.6650 level. Any more gains could clear the path for a move toward the 0.6720 resistance zone.
If not, the pair might correct lower below the 50-hour simple moving average at 0.6555. There is also a key bullish trend line forming with support at 0.6555. The next support could be 0.6540. If there is a downside break below the 0.6540 support, the pair could extend its decline toward the 0.6510 zone. Any more losses might signal a move toward 0.6450.
NZD/USD Technical Analysis
On the hourly chart of NZD/USD on FXOpen, the pair also followed AUD/USD. The New Zealand Dollar formed a base above the 0.6130 level and started a decent increase against the US Dollar.
The recent low was at 0.6178 before the pair climbed above the 0.6190 resistance and the 50-hour simple moving average. There was a move above the 50% Fib retracement level of the downward move from the 0.6217 swing high to the 0.6178 low.
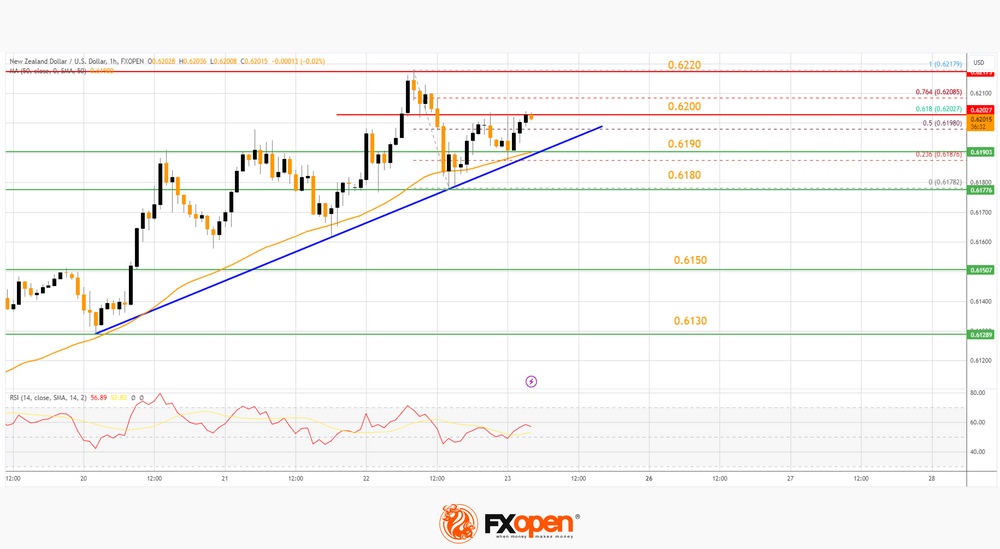
On the upside, the pair is facing resistance near the 0.6200 zone. It is near the 61.8% Fib retracement level of the downward move from the 0.6217 swing high to the 0.6178 low.
The NZD/USD chart suggests that the RSI is stable above 50. The next major resistance is near the 0.6220 level. A clear move above the 0.6220 level might even push the pair toward the 0.6280 level. Any more gains might clear the path for a move toward the 0.6350 resistance zone in the coming days.
On the downside, there is a support forming near 0.6190. There is also a bullish trend line forming with support at 0.6190. The next major support is 0.6180. If there is a downside break below the 0.6180 support, the pair might slide toward the 0.6130 support. Any more losses could lead NZD/USD in a bearish zone to 0.6050.
Trade over 50 forex markets 24 hours a day with FXOpen. Take advantage of low commissions, deep liquidity, and spreads from 0.0 pips. Open your FXOpen account now or learn more about trading forex with FXOpen.
This article represents the opinion of the Companies operating under the FXOpen brand only. It is not to be construed as an offer, solicitation, or recommendation with respect to products and services provided by the Companies operating under the FXOpen brand, nor is it to be considered financial advice.
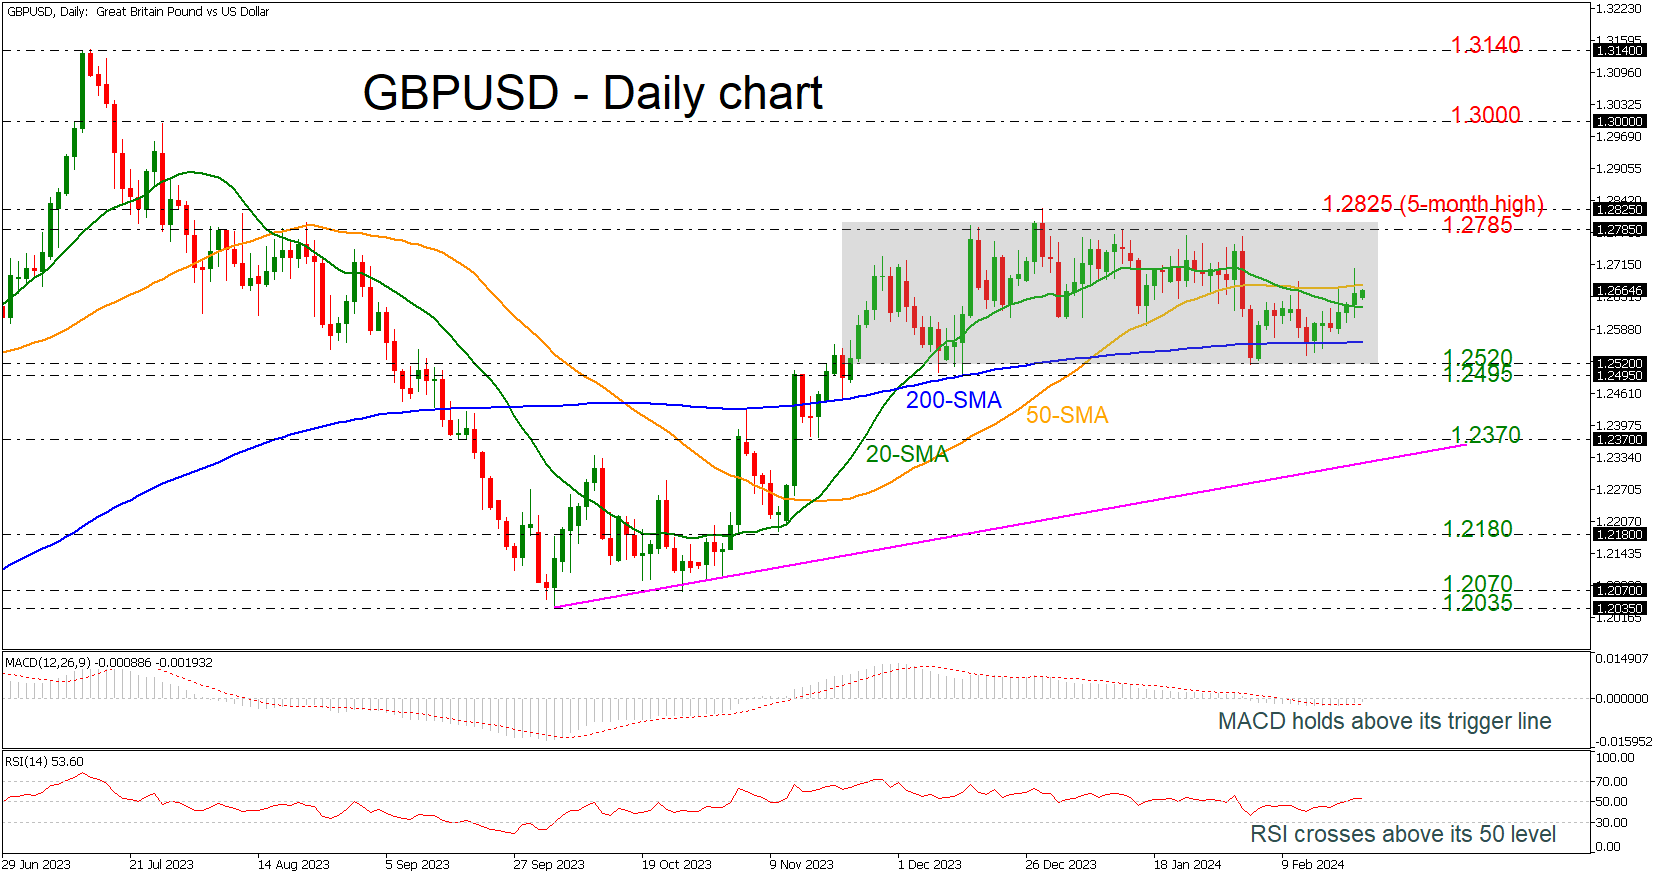
GBPUSD Tries to Strengthen Bullish Move Above SMAs
- GBPUSD rebounds off 200-day SMA
- But still holds in trading range in short-term
- RSI and MACD have weak momentum
GBPUSD is making an attempt to climb above the short-term simple moving averages (SMAs), posting three straight green days but is still developing within the three-month trading range of 1.2520-1.2785.
According to technical oscillators, the MACD jumped above its trigger line but is still standing beneath its trigger line with weak momentum, while the RSI is moving sideways above its neutral threshold of 50.
If the price extends above the SMAs, then it may again challenge the upper boundary of the channel at 1.2785 and the five-month high of 1.2825. Steeper increases may change the outlook to a bullish one, heading towards the 1.3000 psychological mark.
On the other hand, a drop below the 200-day SMA at 1.2560 could open the way for a rest near the 1.2495-1.2520 support area, which encapsulates the lower boundary of the range, before meeting the medium-term uptrend line at 1.2370. Any losses below this line could switch the picture to bearish, hitting the 1.2180 barricade.
All in all, GBPUSD has been trading within a consolidation area since November 24 and only a break above 1.2825 or below 1.2495 could clear the next direction in the near-term view.
Nasdaq 100 Technical: Bulls Rescued by Nvidia (Again)
- A 16% rally seen in Nvidia (ex-post earnings) has led the Nasdaq 100 to recoup its entire loss of -3.5% from last Friday, 16 February high to Wednesday, 21 February low.
- The current positive momentum and trend conditions of Nvidia may assert a further positive feedback loop back into the Nasdaq 100.
- Watch the key pivotal support at 17,650 with the next intermediate resistance at 18,220/270 for Nasdaq 100.
What a roller coaster and wild ride it has been for the Nasdaq 100 which threaded on an initial minor corrective decline trajectory of -3.5% from its last Friday, 16 February high to this Wednesday, 21 February low.
Since the publication of our prior analysis, the price actions of the US Nas 100 Index (a proxy for the Nasdaq 100 futures) have indeed shaped a further pushdown and met the first intermediate support of 17,350 (printed an intraday low of 17,324 during late US session on Wednesday, 21 February).
Thereafter within four hours, the Index rallied by +1.8% and pushed higher yesterday, 22 February to recoup all the prior losses inflicted from last Friday. In the past two sessions, it has gained by +4.1% from Wednesday, 21 February intraday low of 17,324 to retest its current all-high level of 18,043 of 12 February (printed an intraday high of 18,037 during yesterday’s US session).
The remarkable “V” shaped rally has been attributed to the stunning +16.4% rally seen on the share price of Nvidia (the third biggest market cap component stock of Nasdaq 100) after it posted better than expected Q4 2023 earnings and issued positive guidance on its revenue in the current Q1 2024 quarter of around US$24 billion the surpassed analyst’s expectation of US$21.9 billion on the average.
Given the significant influence on the share price movement of Nvidia towards the US Nas 100 Index which can be traced back to a high positive 20-day correlation coefficient of 0.85 between the two as of yesterday, 22 February. Hence, it will be paramount to analyse the momentum and trend trajectory of Nvidia’s share price movement.
Medium-term and major uptrend phases intact for Nvidia
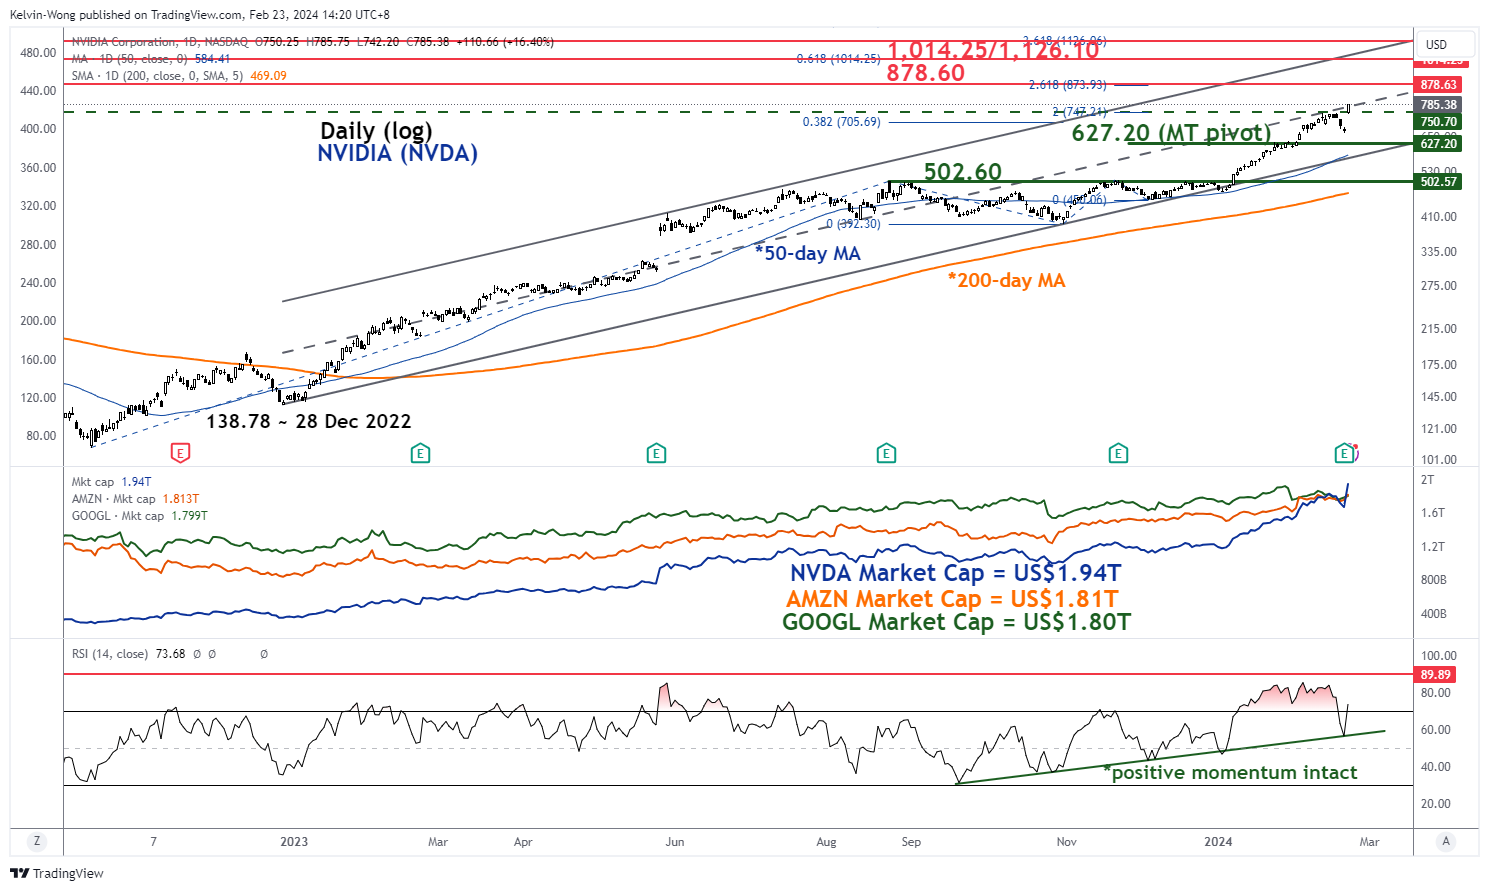
Fig 1: Nvidia medium-term and major trends as of 22 Feb 2024 (Source: TradingView, click to enlarge chart)
The medium-term upside momentum of Nvidia remains intact as depicted by the daily RSI momentum indicator which has been supported by a parallel ascending trendline support since 21 September 2023 and managed to stage a rebound right above the 50 level yesterday.
This positive momentum reading is likely to support the ongoing medium-term uptrend and major uptrend phases in place since the 31 October 2023 low and 28 December 2022 low respectively.
If the 627.20 key medium-term pivotal support holds, its medium-term uptrend phase trajectory remains intact potentially with the next medium-term resistances to watch at 878.60 and 1,014.25/1,126.10).
Nasdaq 100 may see another fresh all-time high
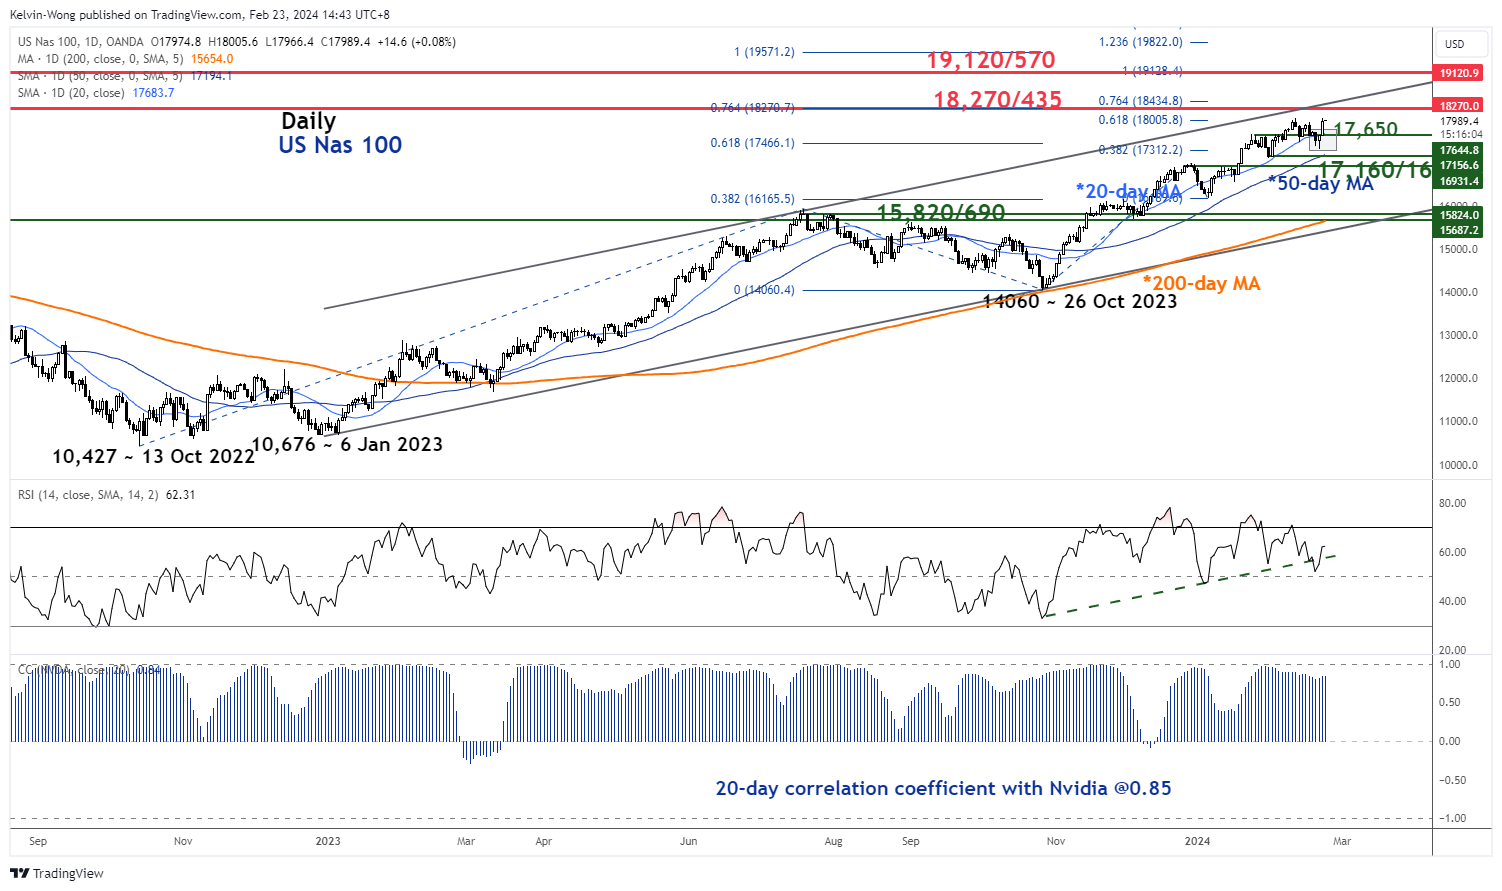
Fig 2: US Nas 100 medium-term & major trends as of 23 Feb 2024 (Source: TradingView, click to enlarge chart)
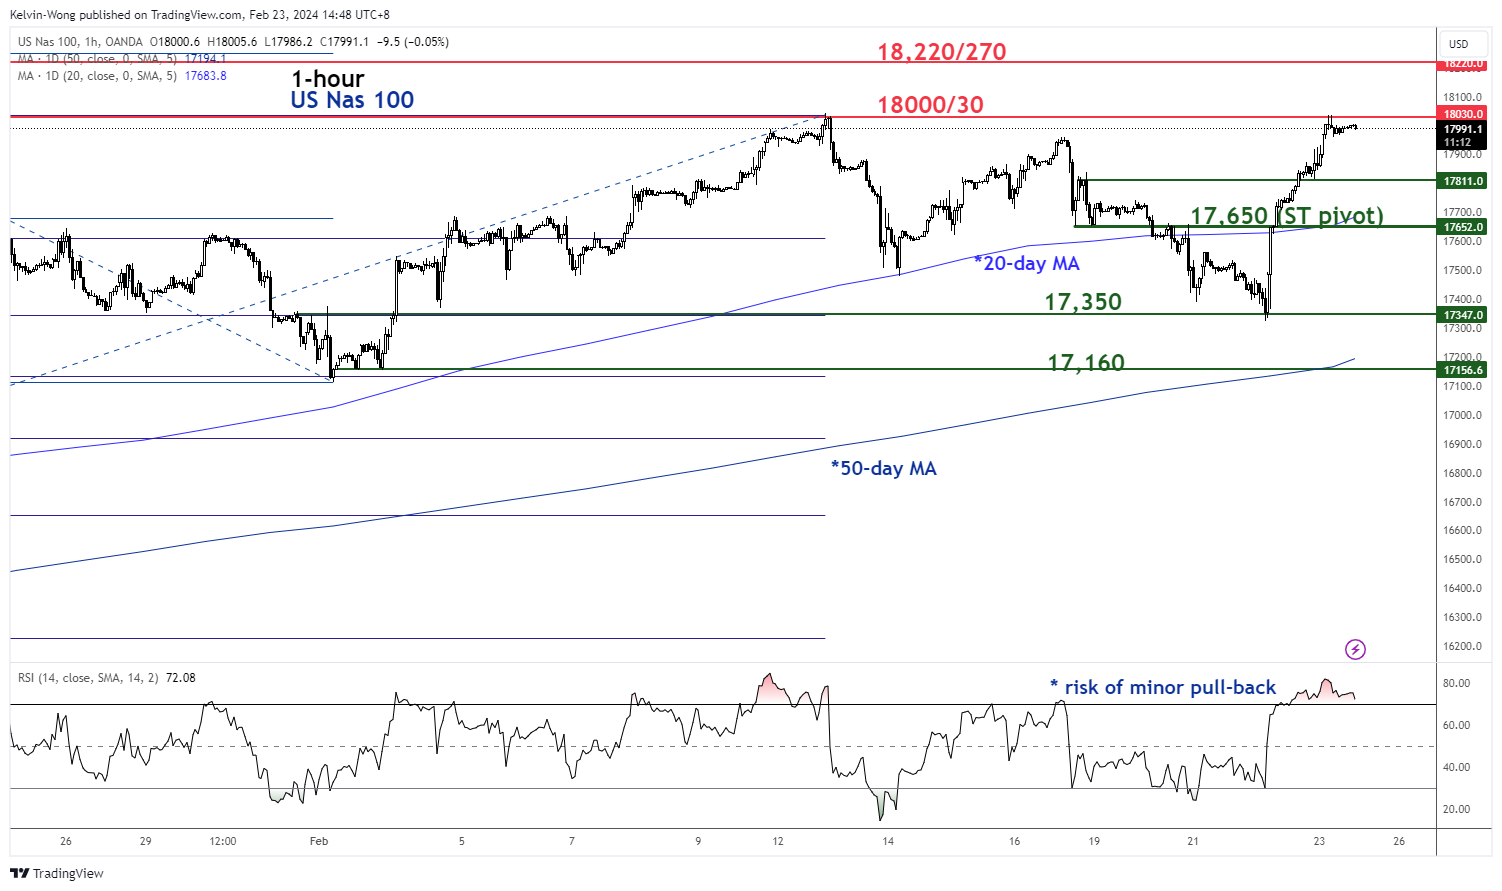
Fig 3: US Nas 100 short-term trend as of 23 Feb 2024 (Source: TradingView, click to enlarge chart)
Yesterday’s “V-shaped” rally in the price actions of the Index and the integration back above its 20-day moving average has increased the odds of a new potential short-term impulsive upmove sequence for its short and medium-term uptrend phases.
Given the current rally has been swift and abrupt that led its hourly RSI momentum indicator to hit a rather extreme overbought level of 81.70 which in turn may see the risk of an imminent minor pull-back below the first intermediate resistance of 18,030 (close to the current all-time high level of 18,043 printed on 12 February).
If the potential minor pull-back manages to hold above the 17,650 short-term pivotal support (20-day moving average & close to the 61.8% Fibonacci retracement of yesterday’s rally from the 21 February low to the 22 February high), the Index may continue its short-term impulsive upmove sequence with the next intermediate resistance to watch at 18,220/270.
However, failure to hold at 17,650 negates the bullish tone to expose the next intermediate supports of 17,350 and 17,160 (also the upward-sloping 50-day moving average).
Fed Waller Suggests Delaying Rate Cuts by a Few Months (!) Should Not Have Substantial Impact
Markets
“What’s the rush?” Fed governor Waller briefly and brightly summed up the string of Fed comments overnight (impact to be reflected in European open given Japanese close). The strength of the economy and recent inflation data mean it is appropriate to be patient, careful, methodical, deliberative… you name it! The Fed is in no great urgency to ease monetary policy. In absence of major economic shocks, Waller suggested that delaying rate cuts by a few months (!) should not have a substantial impact on the real economy in the near term. Fed vice-chair Jefferson joined the chorus by stressing the danger of easing too much/too soon as it can lead to a stalling or reversal in inflation progress. Fed governor Cook repeated the mantra that more evidence is needed to judge that inflation is on a sustainable path to the 2% inflation target. Apart from hawkish Fed comments, economic activity data yesterday confirmed the current global picture: Europe is slowly recovering from a standstill with (German) manufacturing still a drag. UK growth holds up better than expected and the US economy hums along after beating the recession odds in 2023. Meanwhile, European selling pressure remains elevated/rising on the back of wage dynamics. US weekly jobless claims continue to point at a tight US labour market (201k). The combination of Fed speak (Jefferson), eco data and risk sentiment (huge rally on stellar Nvidia earnings) pushed core bonds lower with front ends of the curve underperforming. US yields added 4.6 bps (2-yr) to 0.3 bps (10-yr) with the very long end outperforming (-2.2 bps). German yield changes varied between +5.2 bps (2-yr) and -3.3 bps (30-yr). The euro made an attempt to take out 1.09 after European PMI’s but the move lacked dash. Eventually the pair closed near opening levels around 1.0820 in a technical move which suggests that this week’s comeback is already running out of steam. Major European and US equity benchmarks ended with gains of 1.2% to almost 3% (Nasdaq).
Today’s eco calendar is empty apart from ECB consumer inflation expectations. General risk sentiment and technical factors can guide trading. Recent string of data and central bank speak suggests a firm floor below core bond yields short term. Short term underperformance of US Treasuries can help balancing the dollar even in case of bullish risk sentiment. Thursday’s PCE deflators are the next benchmark.
News & Views
GfK UK Consumer confidence unexpectedly dropped in January for the first time in four months. The headline index eased from -19 to -22, while a small further improvement was expected. The setback was visible in most sub-indices of the survey. Consumers turned less optimistic both on the economic situation last year (-43 from -41) as on expectations for next 12 months (-24 from -22). Climate for major purchases was seen deteriorating from -20 to -25. UK consumer also turned less positive over their personal finances over the previous year. Expectations on personal finances for the next 12 months were unchanged. The sub-index on savings intentions rose from 27 to 29. The overall headline confidence index substantially improved throughout last year as inflationary pressures eased, but now shows tentative signs of topping out even as the PMI’s yesterday (composite at 53.3) suggested that growth in the UK might on a better footing.
Chinese new home prices declined again in January (-0.37% M/M), the eighth consecutive monthly decline. Prices were down 1.24% Y/Y. Also prices of used houses fell further at the start of the year (-0.67% M/M; -4.45% Y/Y). The January data illustrate ongoing pressure in the real estate market which weighs on confidence and hampers the overall economic performance of the Chinese economy. There were some very tentative signs of bottoming/improvement. The number of cities (total number 70) that reported a monthly decline in new home prices eased from 62 to 56, with 11 cities including Shanghai reported a monthly rise. Chinese Banks earlier this week sharply reduced the 5-yr Prime loan rate by 25 bps to 3.95% in an effort by policy makers to support the ailing real estate market.
Up Go Stocks, Down Go Bonds
We knew that yesterday was going to be a good day – at least for the stock markets, given that Nvidia defied the expectations that it would - maybe – fail to deliver $20bn sales in the latest quarter. But the company announced $22bn sales. And because a potential misstep from Nvidia was seen as a major risk of a downside correction in stock markets, equity bulls broke their chains free after the blowout earnings. The star of the past two years, the most important stock on planet Earth, or the AI revolution’s mascot Nvidia ended up jumping 16% in a single session and stole the title of the biggest one day jump from Meta – which had just obtained this title after its latest quarterly report a couple of weeks ago. Nvidia added $277 billion to its market cap just yesterday. Morgan Stanley raised its price target from $750 to $795, and Bank of America raised its target from $800 to $925. Allez, let’s round it up to $1000 and see if Nvidia could hit that $1000 mark!
Euphoria and fun aside, the expectation that the narrow stock rally, mainly shouldered by tech, would broaden up has dissipated like dust in the sky in the aftermath of the first earnings season of the year. Tech, and everything related to tech is doing just fine. And the others surf on that optimism. The S&P500 rallied more than 2% and hit a fresh record yesterday and the rally is accelerating above the October 2022 to now ascending range. Nasdaq 100 soared 3% and traded close to an ATH. The Dow Jones industrial, European Stoxx 600 and Japanese Nikkei 225 traded at an ATH as well.
Investors are still wondering whether the US stocks haven’t become too expensive – because the S&P500’s PE ratio is around 23. In this context, Japanese stocks, which also benefit from the AI boom, extra-low Japanese rates, and super cheap Japanese yen trade with a PE ratio of only 16. That makes the Japanese stocks a good alternative for investors who want to increase their AI exposure and diversify geographically. Nikkei’s two heavy weights: Tokyo Electron – that makes semiconductor manufacturing equipment and Adventest – which builds chip-testing machines are both doing great.
And oh, there is also the idea that the Chinese chipmakers would be a cheap option to the US and Japanese counterparts. Yes, the Chinese chipmakers have no option but to fill in the gap from the US export ban. The Chinese companies will be constrained to buy Made-in-China chips, and the Chinese government will put all its weight to make things work – because they can’t afford to fall behind the biggest technology race of the decade. But investing in China implies taking the Chinese government risk. The question is: is growth potential in China big enough to take that risk? At this point, when the world is rushing to AI, I don’t think that the Chinese demand is necessarily needed. (Answer: not necessarily). And speaking of China – real quick – the latest data showed that new home prices dropped the most in 10 months. China’s property crisis gives no signs of improving. On the contrary.
FX and commodities
The cheery mood in the global stock markets was completely decoupled with the gloomy mood in the sovereign space. The US 2 and 10-year yields rose yesterday because some more Federal Reserve (Fed) members warned about cutting the US rates too early and too much. Yesterday’s stronger-than-expected manufacturing and housing data came as further evidence that the US economy doesn’t necessarily need rate cuts in a rush. But the US dollar appetite was nowhere to be found, the dollar index remains offered into the 100-DMA. The 3-month risk reversals of the USD against EM currencies showed that option traders are the least bullish on the US dollar against EM currencies since 2007. That’s interesting, because the US economic data continues to surprise to the upside. The Fed rate cut expectations are being scaled back, yet the dollar doesn’t gain the attraction that it deserves. That’s a good thing, mind you, to prevent the US inflation from spilling to the rest of the world, but it’s not fully rational.
Anyway, in Europe, inflation data came as no surprise while the PMI data showed that activity hit an 8-month high in February. But cracks are widening with German manufacturing falling to the lowest levels since October. Still, the German 10-year bund yield rose to 2.50% and the EURUSD shortly tested its 50-DMA – near 1.0883 – to the upside yesterday and is trying to clear its 200-DMA sustainably. The retreat in dovish European Central Bank (ECB) expectations support the euro’s rebound against the greenback, as the market pricing now suggests less than 100bp cut from the ECB this year.
In energy, US crude advanced to $79 per barrel yesterday after a lower-than-expected jump in US oil inventories last week, while nat gas futures are having a hard time rebounding after a dip to 1.55. The European nat gas futures continue to push lower as traders are selling nat gas for next winter – a sign of confidence that Europe will continue to receive the Russian gas shipments as we near the second anniversary of Russia’s invasion of Ukraine. Europe is not less shocked faced with a war on its continent but is clearly less capable of putting more restrictions on Russian energy – given the cost-of-living crisis and Germany’s descent into hell. Therefore, buying defense stocks is a better way to navigate through war in Europe than buying nat gas futures.
AI Surge Fuels Stock Market Gains
In focus today
The main event today will be the German Ifo print for February. The Ifo survey covers many more companies than the PMIs and it has somewhat contrasted the uptick seen in manufacturing PMIs previously. Moreover, the Ifo survey is yet to bottom out and expectations have not moved up in contrast to the ZEW.
Economic and market news
What happened overnight
Things were generally quiet overnight. In China, prices of newly built homes in tier-1 cities fell 0.7% y/y. Both Fed Governors Lisa Cook and Cristopher Waller suggested they needed more confidence that inflation was normalizing before they could cut rates, with Waller specifically noting he would need "at least another couple of months of inflation data". We expect the Fed will deliver its first cut in May.
What happened yesterday
Yesterday was a great day for stock prices as it seems that AI-optimism fuelled a market boom, after Nvidia beat quarterly earnings expectations by some margin. Tech stocks were the big winner with the Nasdaq Composite up 2.96%, but broader indices such as the MSCI world and European STOXX600 also gained, with the latter hitting an ATH driven particularly by tech stocks.
We also got a slew of data from the euro area. First, euro area composite PMIs for February drew a mixed picture with service PMIs beating expectations and manufacturing PMIs declining, especially due to a plunge in German manufacturing PMIs. The figures indicated increasing price pressure in services, which is a worrying sign for the ECB. The ECB minutes from the January meeting showed policymakers signalling patience and caution in easing too early. Final HICP inflation confirmed the flash headline inflation estimate of 2.8% y/y but suggested softer underlying inflation momentum than the flash estimate, however, this was in large part due to one-offs and tax increases.
We also got PMIs from both the UK and US, which overall were not game changers, reflected also in muted market reactions. The UK figures suggested modest growth in Q1 2024 especially due to services, while US PMIs painted a positive outlook for manufacturing which rose to 51.5, especially due to new orders (domestic and foreign), while services saw weaker incoming new business.
Equities: Global equities were markedly higher yesterday with so many interesting aspects. Nikkei 225 made the first all-time high in nearly 35 years, up almost 17% year to date. Stoxx 600 set new all-time high together with S&P500, and Nasdaq had its best session in more than a year. We make two conclusions: This is not just about seven stocks in the US. Secondly, tomorrow it has been two years since Russia invaded Ukraine, the war is still ongoing and MSCI world has returned more than 20% in the same period. Please be careful in underestimating the power of macro impact on financial markets and overestimating the impact of geopolitics. In US yesterday, Dow +1.2%, S&P 500 +2.1%, Nasdaq +3.0% and Russell 2000 +1.0%. Asian markets are mixed this morning with the Japanese market closed. US and European futures are marginally higher.
FI: 10y European yields spiked 5bp on the better-than-expected French PMI data, however it was quickly reversed following the abysmal German manufacturing PMI. Through the mid-day session with the final euro area inflation print and the ECB minutes yields gradually declined. Although none of the two inputs resulted in dovish vibes, the yield decline extended through the slightly lower than expected US PMI in the afternoon. Noteworthy, the better than anticipated jobless claims did not change markets. 10y Bunds ended 1bp lower on the day at 2.44% after breaking 2.5% through the day. The European curves bear flattened around the 10y point, with markets taking out central bank easing expectations now pointing to ECB rate cuts worth less than 100bp this year, while the long end rallied 4bp.
FX: Another good day for the SEK, which rose together with NZD and GBP, while NOK and JPY were the biggest loses. EUR/USD was on a roller coaster ride amid mixed signals from the release of flash PMIs first rising close to 1.09 before ending the day where it started just above the 1.08 level.
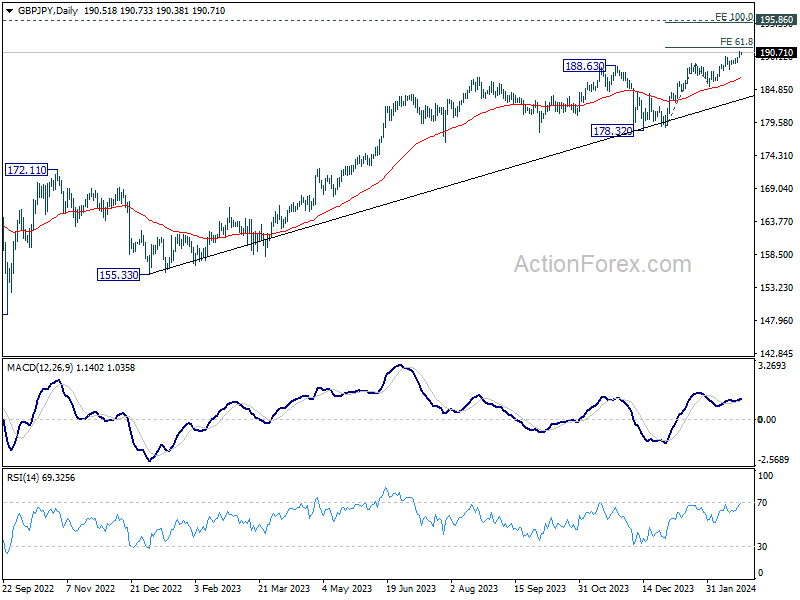
GBP/JPY Daily Outlook
Daily Pivots: (S1) 190.02; (P) 190.43; (R1) 191.00; More...
Intraday bias in GBP/JPY remains on the upside at this point. Current rally is in progress for 61.8% projection of 178.71 to 188.90 from 185.21 at 191.50. Firm break there will target 100% projection at 195.40. On the downside, below 189.05 minor support will turn intraday bias neutral and bring consolidations again, before staging another rally.
In the bigger picture, up trend from 123.94 (2020 low) in in progress. Medium term outlook will stay bullish as long as 178.32 support holds. Next target is 195.86 long term resistance (2015 high).
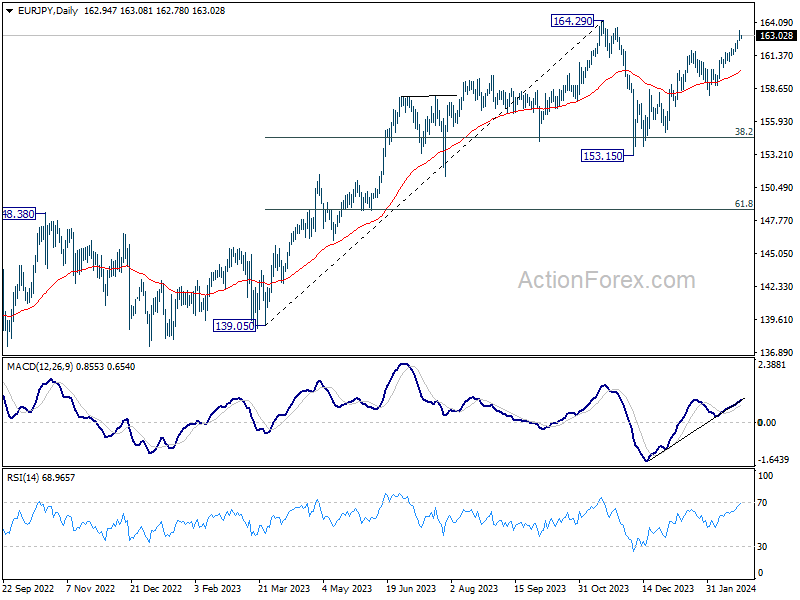
EUR/JPY Daily Outlook
Daily Pivots: (S1) 162.48; (P) 162.97; (R1) 163.44; More...
Intraday bias in EUR/JPY remains on the upside, as rise from 153.15 is in progress for retesting 164.29 high. Decisive break there will confirm larger up trend resumption. On the downside, however, below 161.93 minor support will turn intraday bias neutral and bring consolidations, before staging another rally.
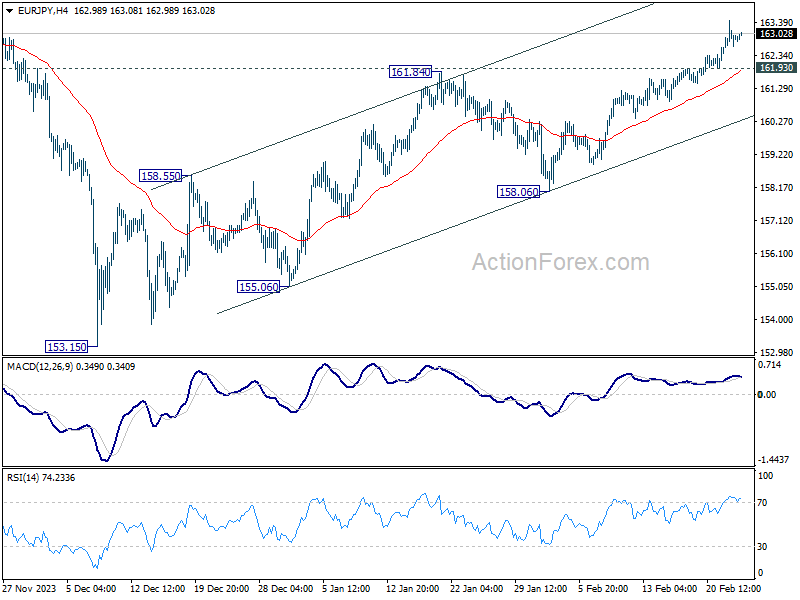
In the bigger picture, price actions from 164.29 medium term top are seen as a correction to rise from 139.05 only. As long as 148.38 resistance turned support holds (2022 high), larger up trend from 114.42 (2020 low) is expected to resume through 164.29 at a later stage. Next target would be 169.96 (2008 high).
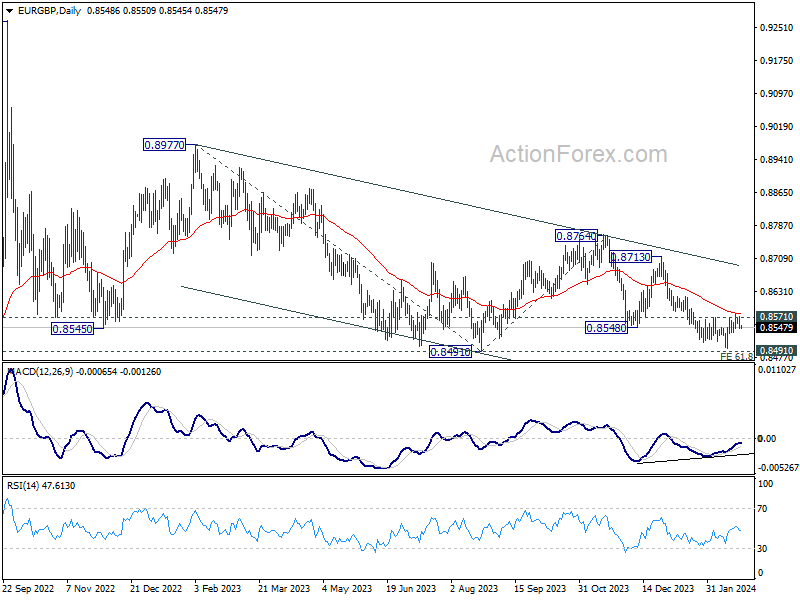
EUR/GBP Daily Outlook
Daily Pivots: (S1) 0.8538; (P) 0.8556; (R1) 0.8567; More...
Intraday bias in EUR/GBP remains neutral at this point and outlook is unchanged. On the downside, break of 0.8535 minor support will bring retest of 0.8491/7 support zone. Firm break there will resume larger decline. However, considering bullish convergence condition in 4H MACD, sustained break of 0.8571 will confirm short term bottoming, and turn bias back to the upside for stronger rebound.
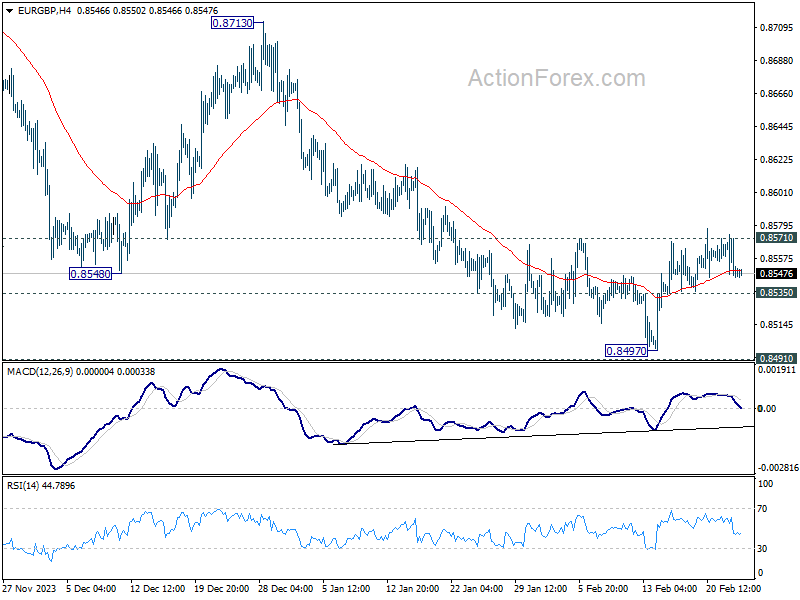
In the bigger picture, fall from 0.8764 is seen as another leg in the whole down trend from 0.9267 (2022 high). Outlook will stay bearish as long as 0.8713 resistance holds. Break of 0.8491 will target 61.8% projection of 0.8977 to 0.8491 from 0.8764 at 0.8464.
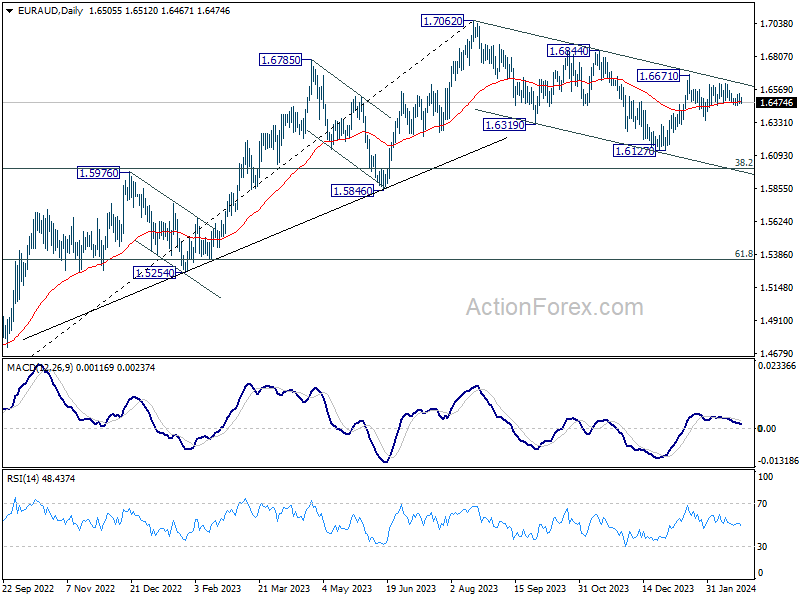
EUR/AUD Daily Outlook
Daily Pivots: (S1) 1.6470; (P) 1.6504; (R1) 1.6541; More...
Intraday bias in EUR/AUD remains neutral at this point. On the upside, decisive break of 1.6671 will revive the case that whole correction from 1.7062 has completed with three waves down to 1.6127. Further rally should then be seen to 1.6844 resistance for confirmation. Nevertheless, below 1.6455 minor support will turn bias to the downside for 1.6348 and possibly below.
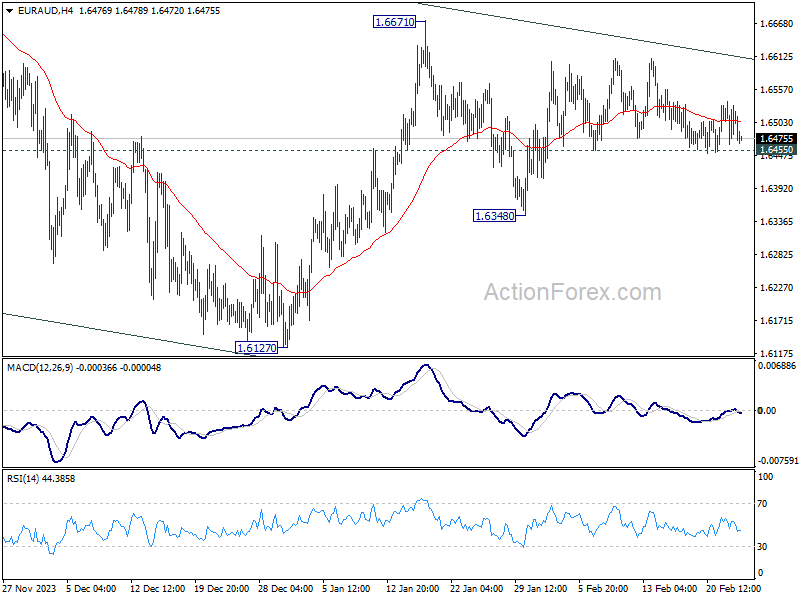
In the bigger picture, fall from 1.7062 medium term top is seen as a correction to the up trend from 1.4281 (2022 low). Break of 1.6844 resistance will argue that this up trend is ready to resume through 1.7062 high. In case of another fall, strong support should be seen around 1.5846 and 38.2% retracement of 1.4281 to 1.7062 at 1.6000 to bring rebound.