
Sample Category Title
Crypto Market Fluctuates But Does Not Move
Market picture
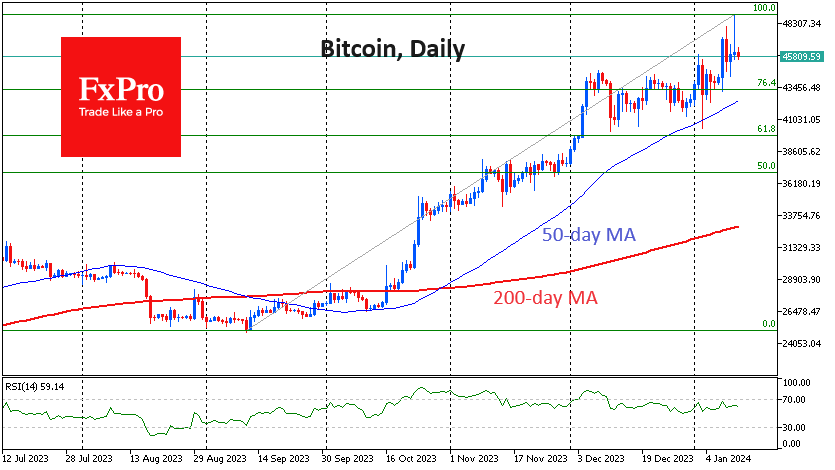
Cryptocurrency market capitalisation is at the same level as the previous day at $1.76 trillion, with the market showing impressive intraday amplitude on Thursday, gaining and then losing around 7% across the major instruments.
At the start of spot ETP trading, the price of bitcoin was close to $49K but was pushed back to $46K, where it is now. It seems that some investors have moved from crypto exchanges to owning the first cryptocurrency through an exchange-traded product.
The launch of spot ETPs is a positive long-term move that supports the reputation and liquidity of the cryptocurrency market, but it by no means avoids a bumpy start to the journey – just like the launch of bitcoin futures on the Chicago exchange.
The first cryptocurrency’s volatility has increased significantly over the past three days, but the price has repeatedly been brought back to the $46K area. On the other hand, we haven’t seen the much-anticipated ‘sell on the facts’ reaction yet.
Technically, such a correction could drag the price below $40K, but the markets need an accompaniment from the deteriorating macroeconomic outlook. Without it, the first cryptocurrency may well drift towards $50K or see another long sideways consolidation, as it did in November.
News background
The influx of institutional investment will increase trading volumes and crypto market liquidity and may even reduce bitcoin volatility in the long run, DRC believes.
It is not worth expecting funds to buy Bitcoin for tens of billions of dollars in the following weeks. But in the long run, there will be demand for cryptocurrencies.
Justin Sun, founder of Tron Blockchain, was optimistic about the approval of spot bitcoin ETFs in the US and said Asian markets would follow.
South Korean authorities have announced a ban on cryptocurrency ETFs. According to the Financial Services Commission of South Korea (FSC), the regulator considers financial stability and investor protection to be orders of magnitude higher than populist decisions.
Jamie Dimon, CEO of JP Morgan, once again spoke out against cryptocurrencies. According to him, “BTC is being used for human and drug trafficking, tax evasion and terrorist financing.” At the same time, the bank itself is one of the participants in BlackRock’s Spot Bitcoin ETF.
Technical Outlook and Review
DXY:
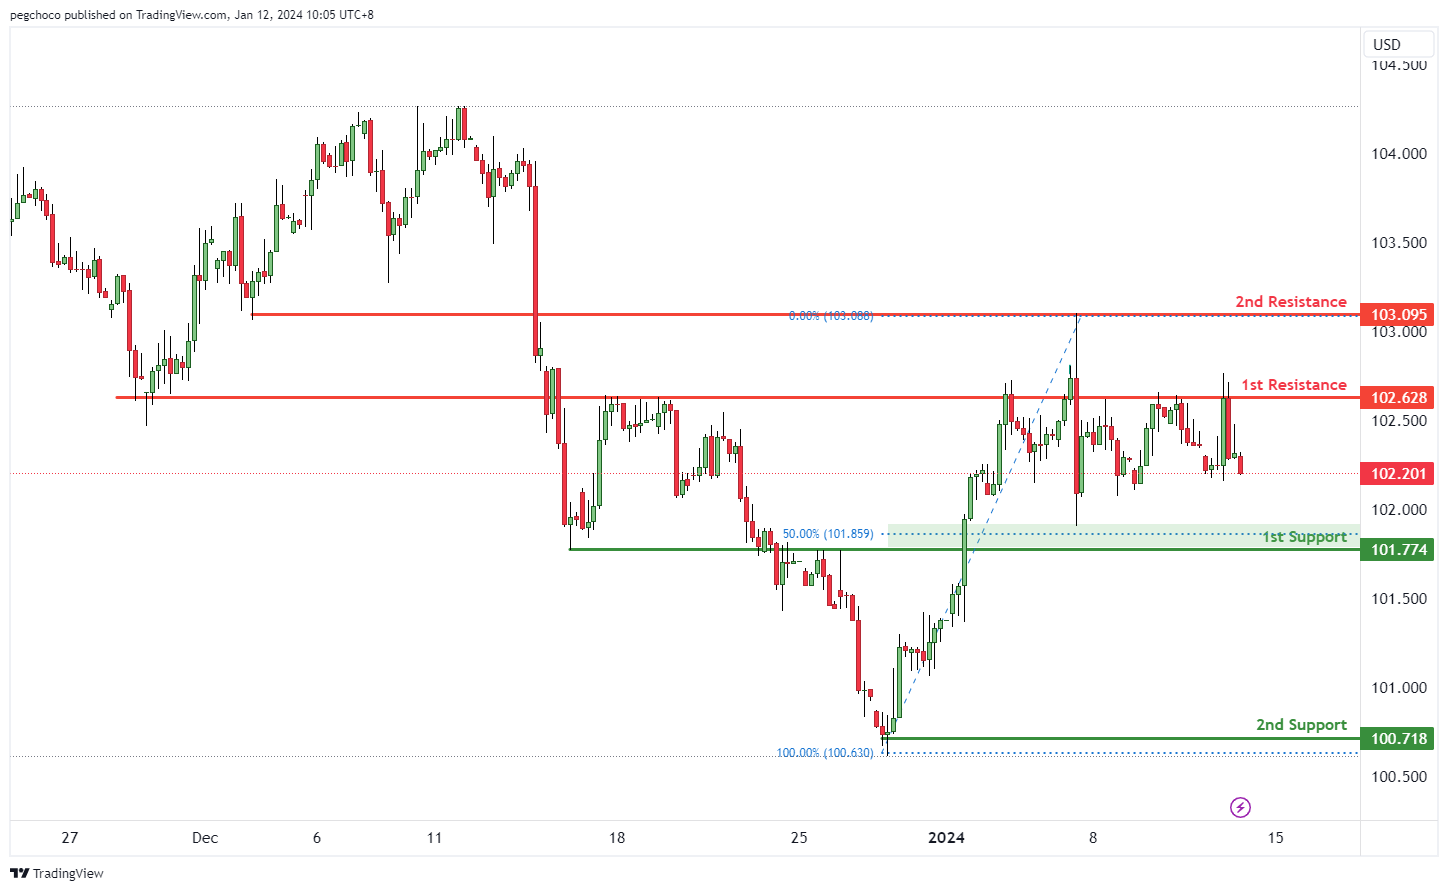
The DXY (US Dollar Index) chart currently demonstrates a bearish overall momentum, indicating a weaker stance for the US Dollar. This momentum suggests the potential for a bearish continuation towards the 1st support level.
The 1st support at 101.77 is recognized as an overlap support and coincides with the 50% Fibonacci Retracement level. This confluence of factors makes it a significant potential support zone, indicating a level where buyers may step in, temporarily supporting the DXY.
The 2nd support at 100.71 is identified as a swing low support, further reinforcing its importance as a potential support area.
On the resistance side, the 1st resistance at 102.62 is categorized as an overlap resistance, suggesting a level where selling pressure or a potential reversal may occur.
The 2nd resistance at 103.09 is also considered an overlap resistance, adding to its significance as a potential barrier to the price’s upward movement in the context of the bearish momentum.
EUR/USD:
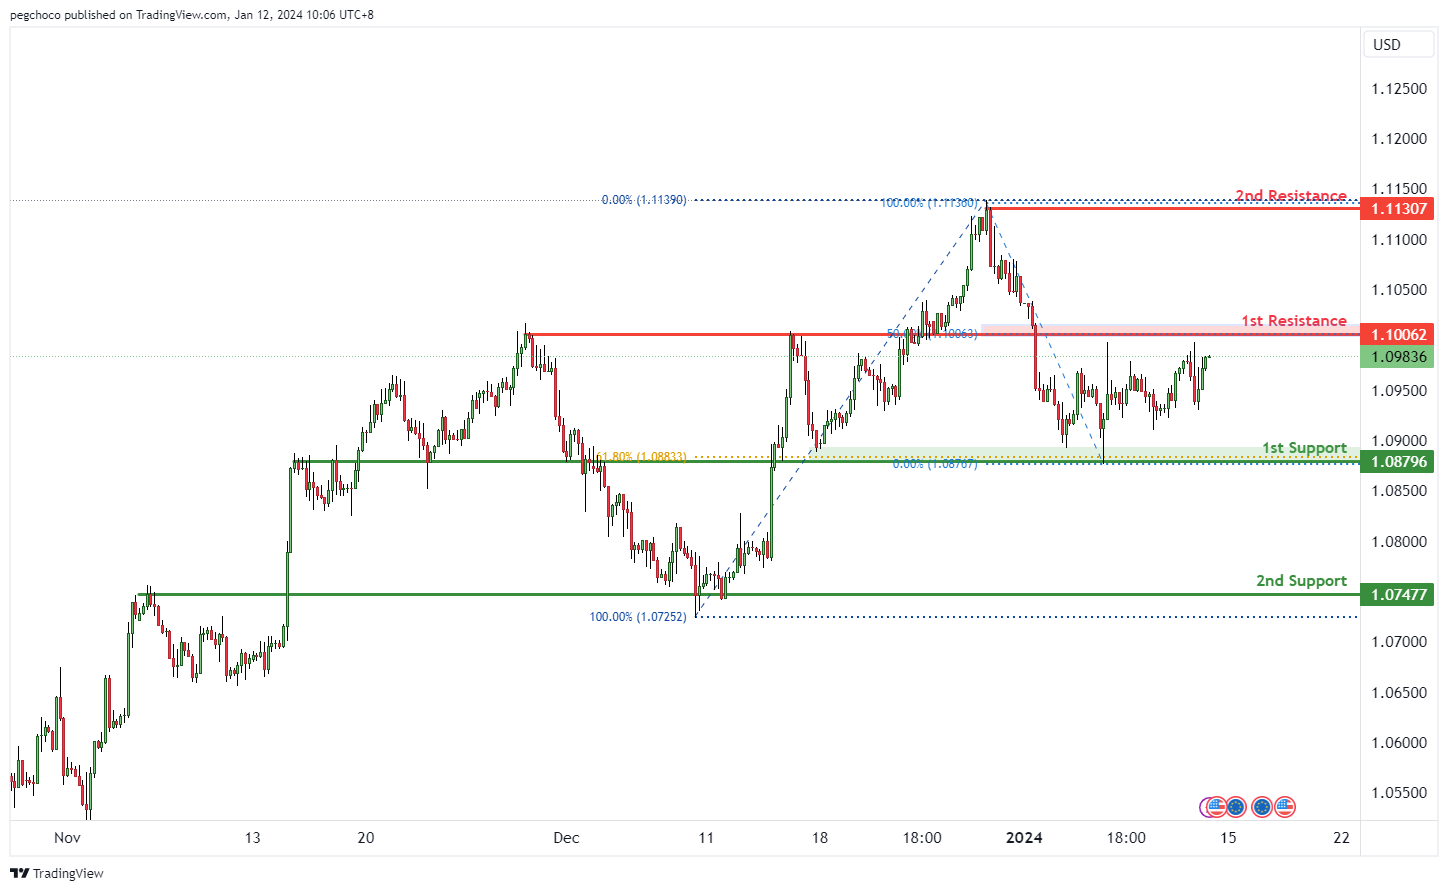
The EUR/USD chart currently exhibits a neutral overall momentum, suggesting a lack of strong directional bias in the near term. Given this neutral stance, there’s a potential scenario where the price may fluctuate between the 1st resistance and 1st support levels.
The 1st support at 1.0879 is identified as an overlap support and aligns with the 61.80% Fibonacci Retracement level. This confluence of factors makes it a significant potential support zone, indicating a level where buyers may show interest in the EUR/USD pair, potentially providing temporary support.
The 2nd support at 1.0747 is categorized as an overlap support, further reinforcing its significance as a potential support area.
On the resistance side, the 1st resistance at 1.1006 is marked as an overlap resistance, suggesting a level where selling pressure or a potential reversal may occur.
The 2nd resistance at 1.1130 is categorized as a swing high resistance, indicating a point where price has previously encountered resistance or reversal.
EUR/JPY:
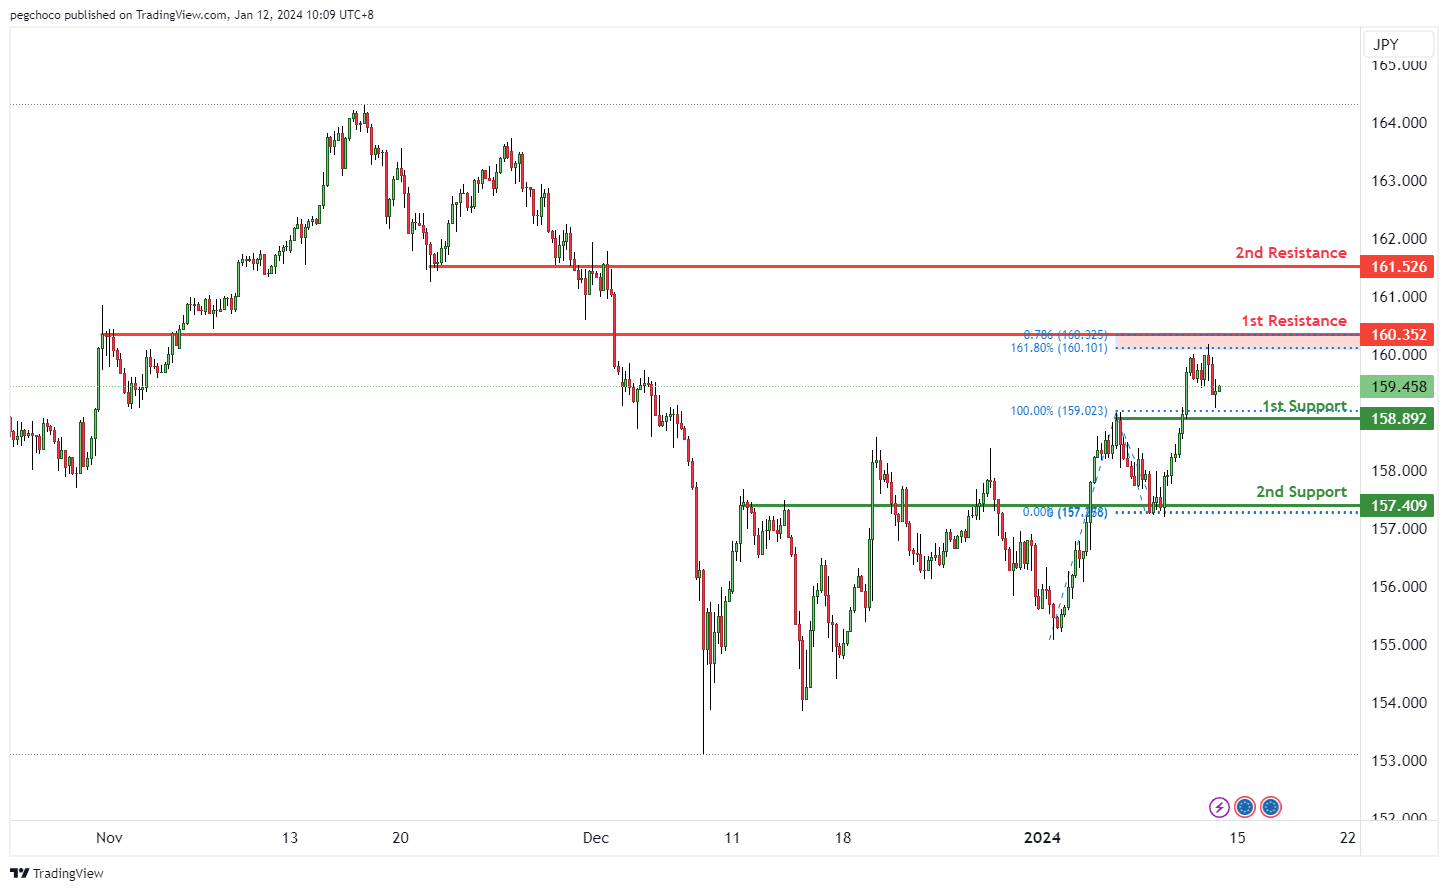
The EUR/JPY chart currently maintains a bullish overall momentum, indicating strength in the Euro relative to the Japanese Yen. This momentum suggests the potential for a bullish bounce off the 1st support level with a subsequent move towards the 1st resistance level.
The 1st support at 158.89 is identified as a pullback support, making it a significant level where buyers may step in, providing temporary support for EUR/JPY. Additionally, this level aligns with the 161.80% Fibonacci Extension and the 78.60% Fibonacci Projection, indicating a confluence of Fibonacci levels, further reinforcing its importance as a potential support zone.
Furthermore, there is a 2nd support at 157.40, categorized as an overlap support, which adds to its significance as a potential support area.
On the resistance side, the 1st resistance at 169.35 is marked as a pullback resistance, where selling interest may emerge, and it also aligns with the 161.80% Fibonacci Extension and the 78.60% Fibonacci Projection, indicating Fibonacci confluence.
The 2nd resistance at 161.52 is categorized as an overlap resistance, which may act as a barrier to any further upward price movement.
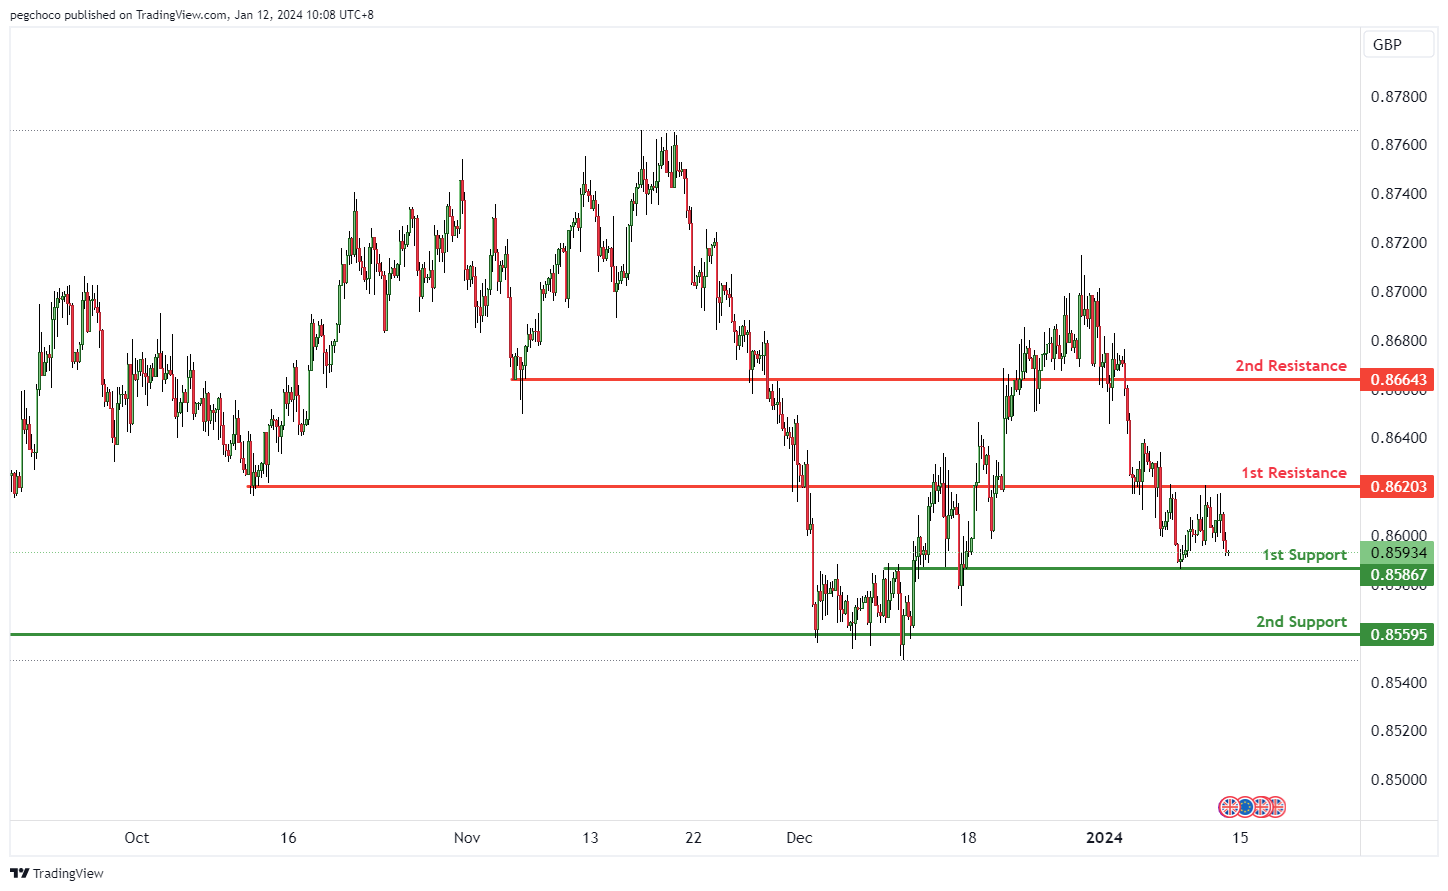
EUR/GBP:
The EUR/GBP chart currently exhibits a bearish overall momentum, indicating weakness in the Euro relative to the British Pound. This momentum suggests the potential for a bearish continuation towards the 1st support level.
The 1st support at 0.8586 is marked as an overlap support, indicating a level where buyers may find interest and temporarily halt the bearish momentum.
Additionally, there is a 2nd support at 0.8559, categorized as multi-swing low support, which further strengthens its significance as a potential support zone.
On the resistance side, the 1st resistance at 0.8620 is identified as an overlap resistance, indicating a potential area where selling interest may emerge, causing a bearish reaction.
The 2nd resistance at 0.8664 is categorized as pullback resistance, reinforcing its significance as a potential barrier for any upward price movement.
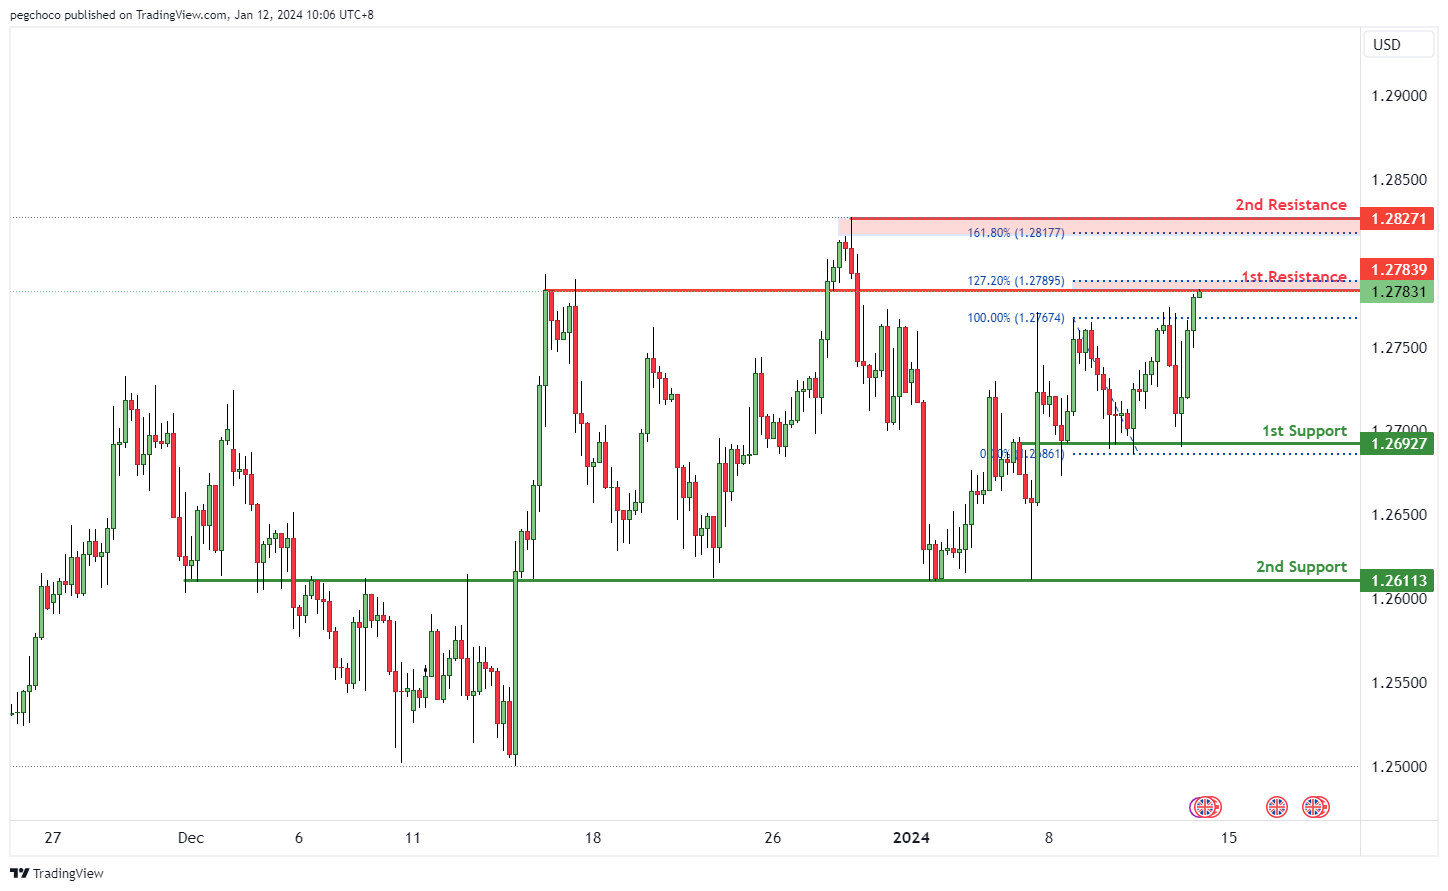
GBP/USD:
The GBP/USD chart currently shows a bearish overall momentum, indicating a stronger US Dollar relative to the British Pound. In the short term, there is a potential scenario where the price reacts bearishly off the 1st resistance level and drops towards the 1st support.
The 1st support at 1.2692 is identified as an overlap support, making it a significant potential support level where buyers may step in and provide temporary support for the GBP/USD pair.
The 2nd support at 1.2611 is also categorized as an overlap support, reinforcing its significance as a potential support area.
On the resistance side, the 1st resistance at 1.2783 is considered a pullback resistance and aligns with the 127.20% Fibonacci Extension level, making it a strong potential barrier for the price.
The 2nd resistance at 1.2827 is marked as a swing high resistance and aligns with the 161.80% Fibonacci Extension level, adding to its significance as a potential point of reversal or resistance.
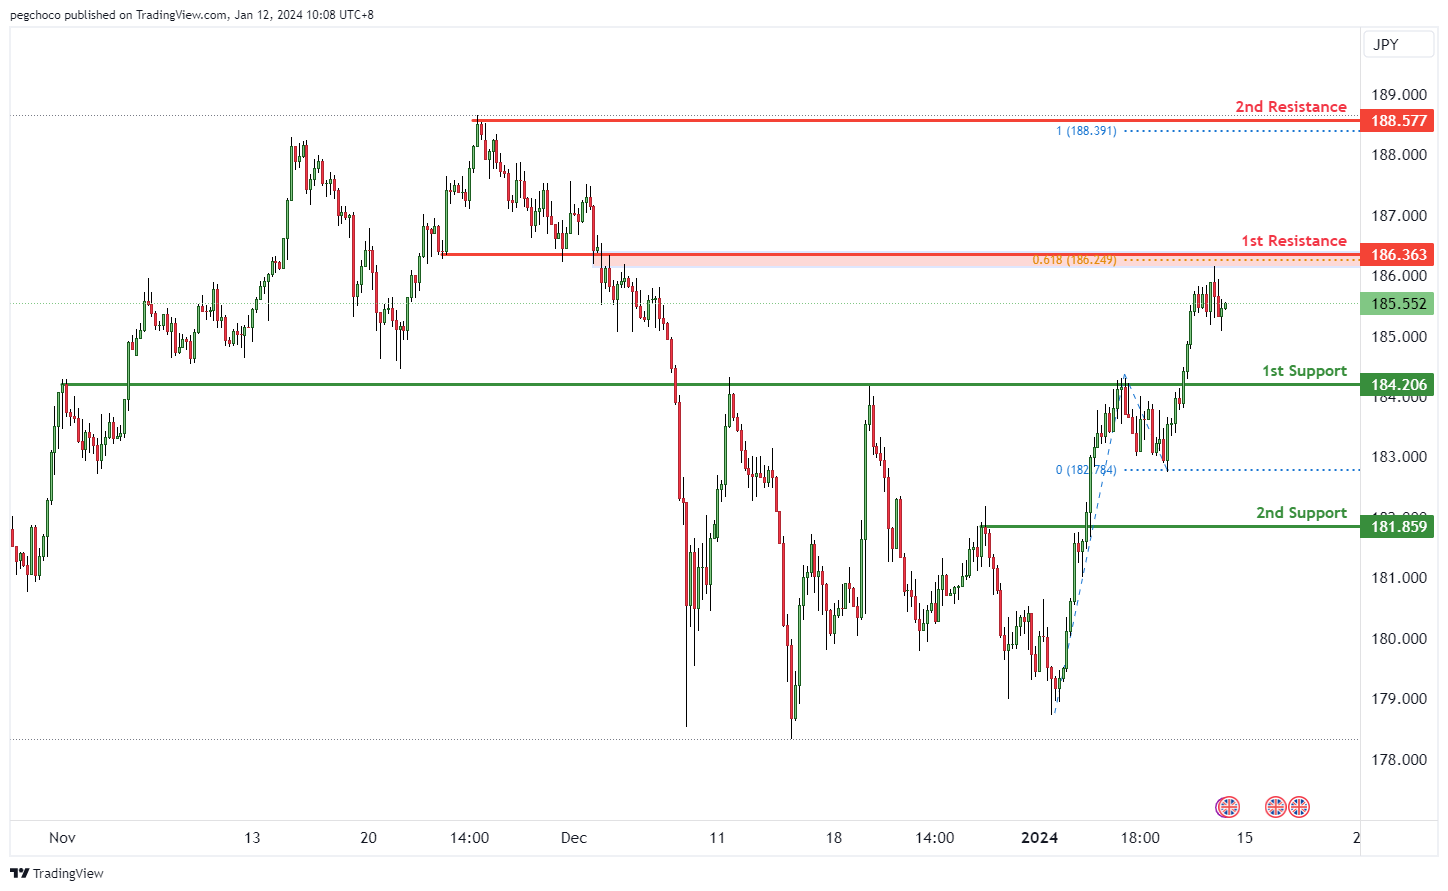
GBP/JPY:
The GBP/JPY chart currently has a bearish overall momentum, suggesting weakness in the British Pound relative to the Japanese Yen. This momentum indicates the potential for a bearish continuation towards the 1st support level.
The 1st support at 184.20 is identified as a pullback support, indicating a level where buyers might step in, providing temporary support for the GBP/JPY pair.
There is also a 2nd support at 181.85, categorized as pullback support as well, reinforcing its significance as a potential support area.
On the resistance side, the 1st resistance at 186.36 is marked as an overlap resistance, suggesting a potential area where selling interest may emerge, causing a bearish reaction.
The 2nd resistance at 188.57 is a swing high resistance and also aligns with the 100% Fibonacci Projection level, making it a strong potential barrier for further price advancement.
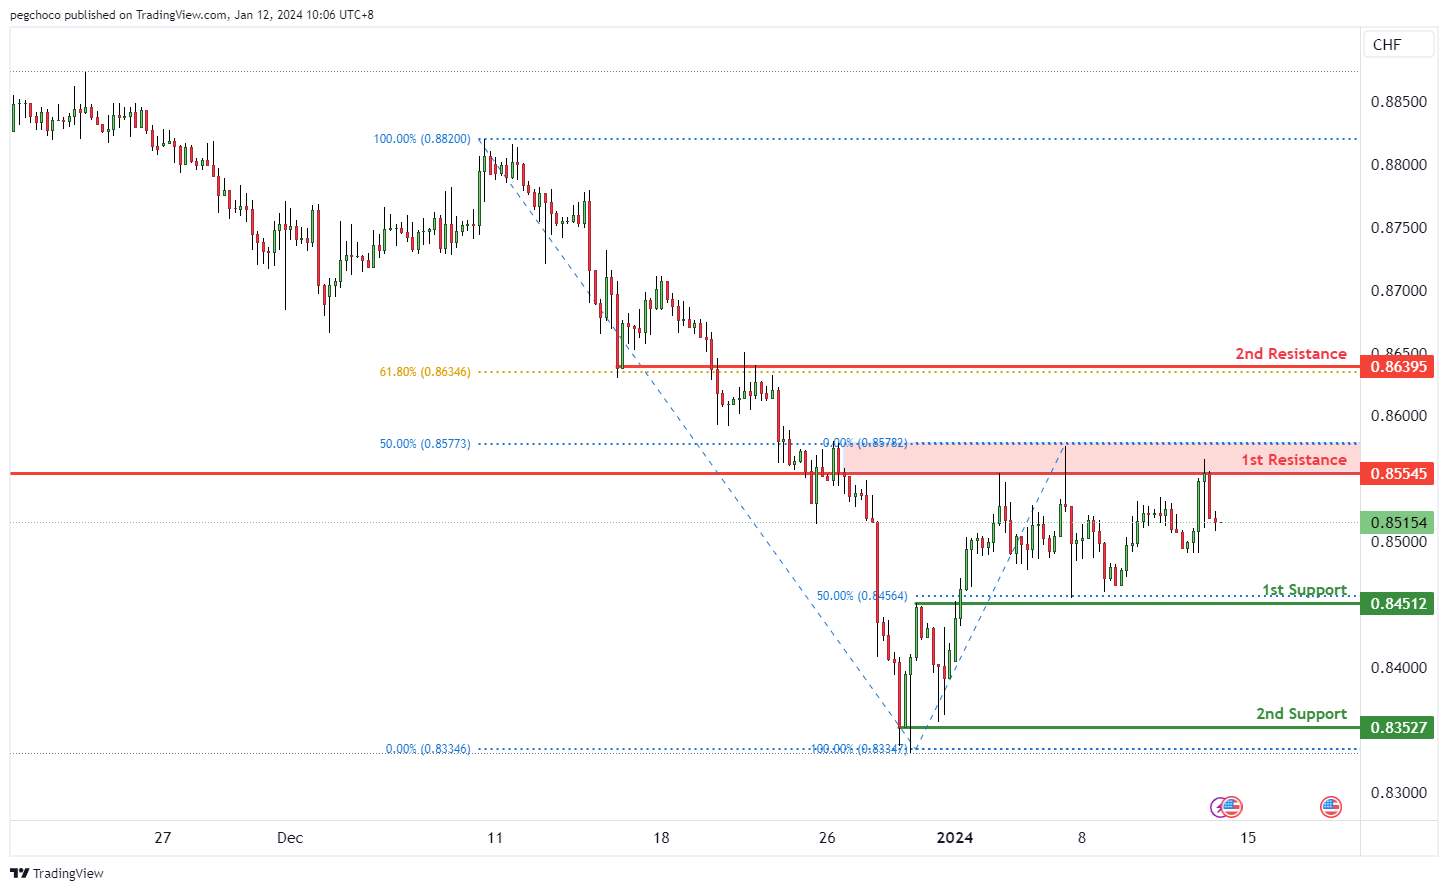
USD/CHF:
The USD/CHF chart currently exhibits a bearish overall momentum, suggesting a stronger Swiss Franc compared to the US Dollar. There is potential for a bearish continuation towards the 1st support level.
The 1st support at 0.8451 is considered an overlap support and aligns with the 50% Fibonacci Retracement level. This confluence of technical factors makes it a significant potential support zone, where selling pressure may temporarily abate, providing a potential bounce for USD/CHF.
The 2nd support at 0.8352 is categorized as multi-swing low support, further reinforcing its importance as a potential support area.
On the resistance side, the 1st resistance at 0.8554 is marked as an overlap resistance and coincides with the 50% Fibonacci Retracement level, making it a strong potential barrier for the price.
The 2nd resistance at 0.8639 is categorized as an overlap resistance and aligns with the 61.80% Fibonacci Retracement level, adding to its significance as a potential point of reversal or resistance.
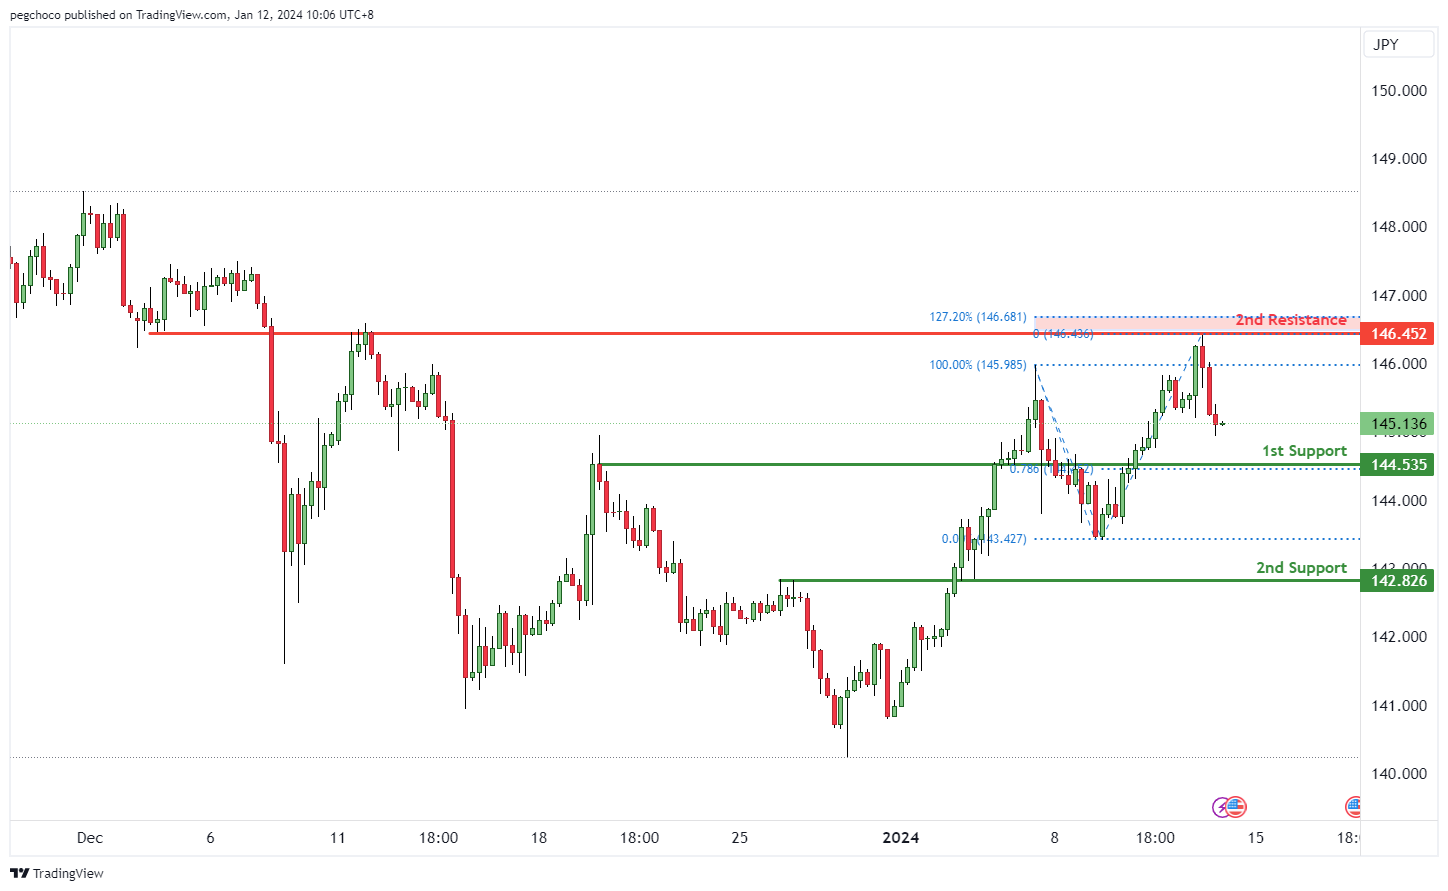
USD/JPY:
The USD/JPY chart currently displays a bearish overall momentum, indicating a weaker US Dollar compared to the Japanese Yen. This momentum suggests the potential for a bearish continuation towards the 1st support level.
The 1st support at 142.75 is identified as a pullback support and aligns with the 50% Fibonacci Retracement level. This level is significant as it suggests a potential area where buying interest may emerge, providing temporary support for USD/JPY.
The 2nd support at 140.73 is categorized as multi-swing low support, further reinforcing its significance as a potential support zone.
On the resistance side, the 1st resistance at 145.34 is marked as a swing high resistance. Swing highs often act as points of reversal or resistance in price movement.
The 2nd resistance at 146.56 is categorized as an overlap resistance, adding to its significance as a potential barrier for the price.'
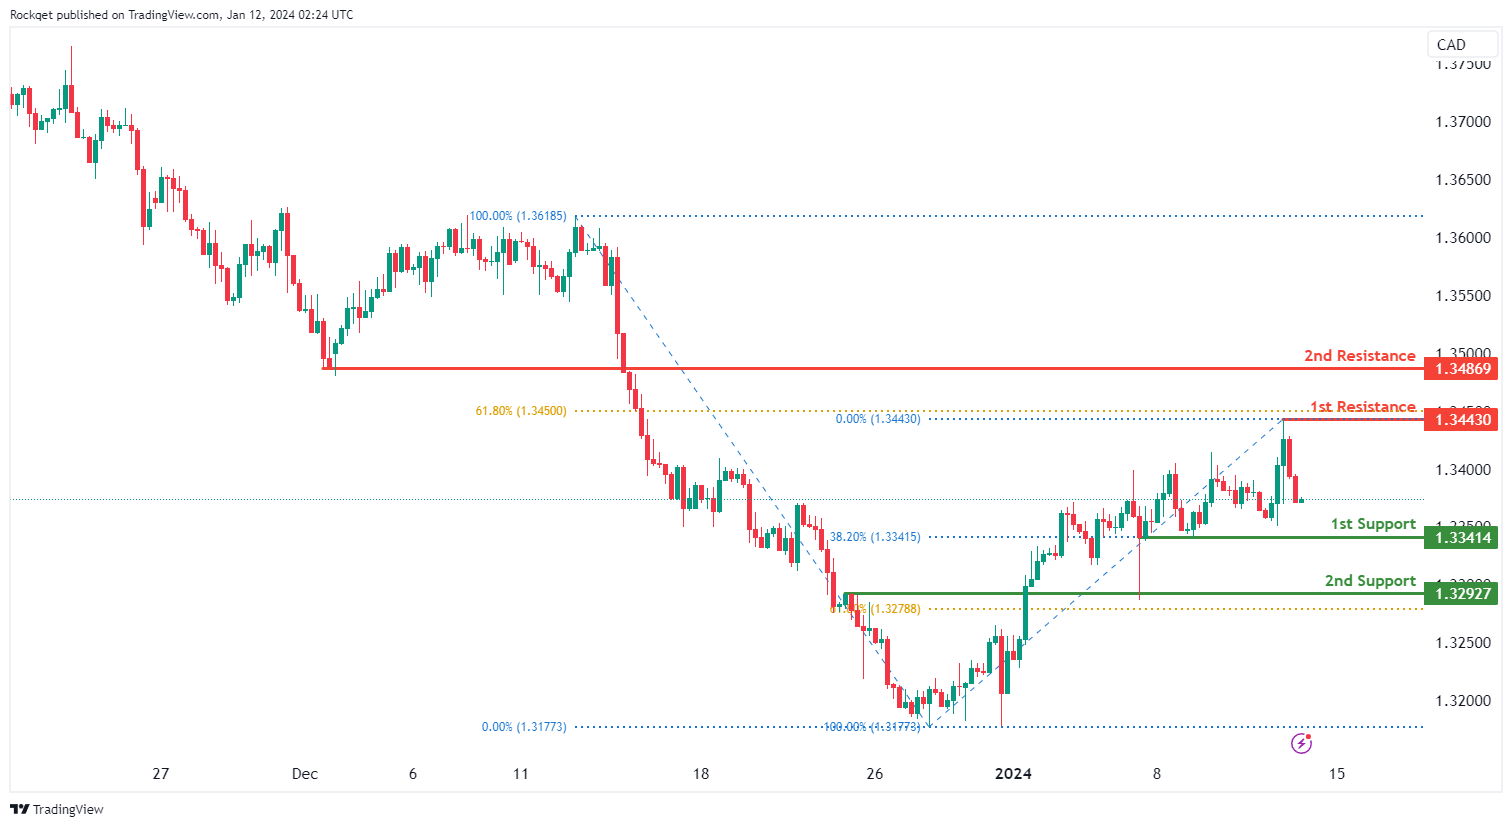
USD/CAD:
The USD/CAD chart currently exhibits an overall bullish momentum. However, there is a potential scenario for price to fall towards the 1st support before making a bullish bounce.
The 1st support level at 1.3341 is identified as a pullback support that aligns with the 38.20% Fibonacci retracement level. Further below, the 2nd support level at 1.3292 is marked as an overlap support that aligns close to the 61.80% Fibonacci retracement level, further reinforcing its importance as a key support level.
To the upside, the 1st resistance level at 1.3443 is identified as a pullback resistance that aligns close to the 61.80% Fibonacci retracement level. Higher up, the 2nd resistance level at 1.3486 is also noted as a pullback resistance, further reinforcing its significance as a potential resistance zone.
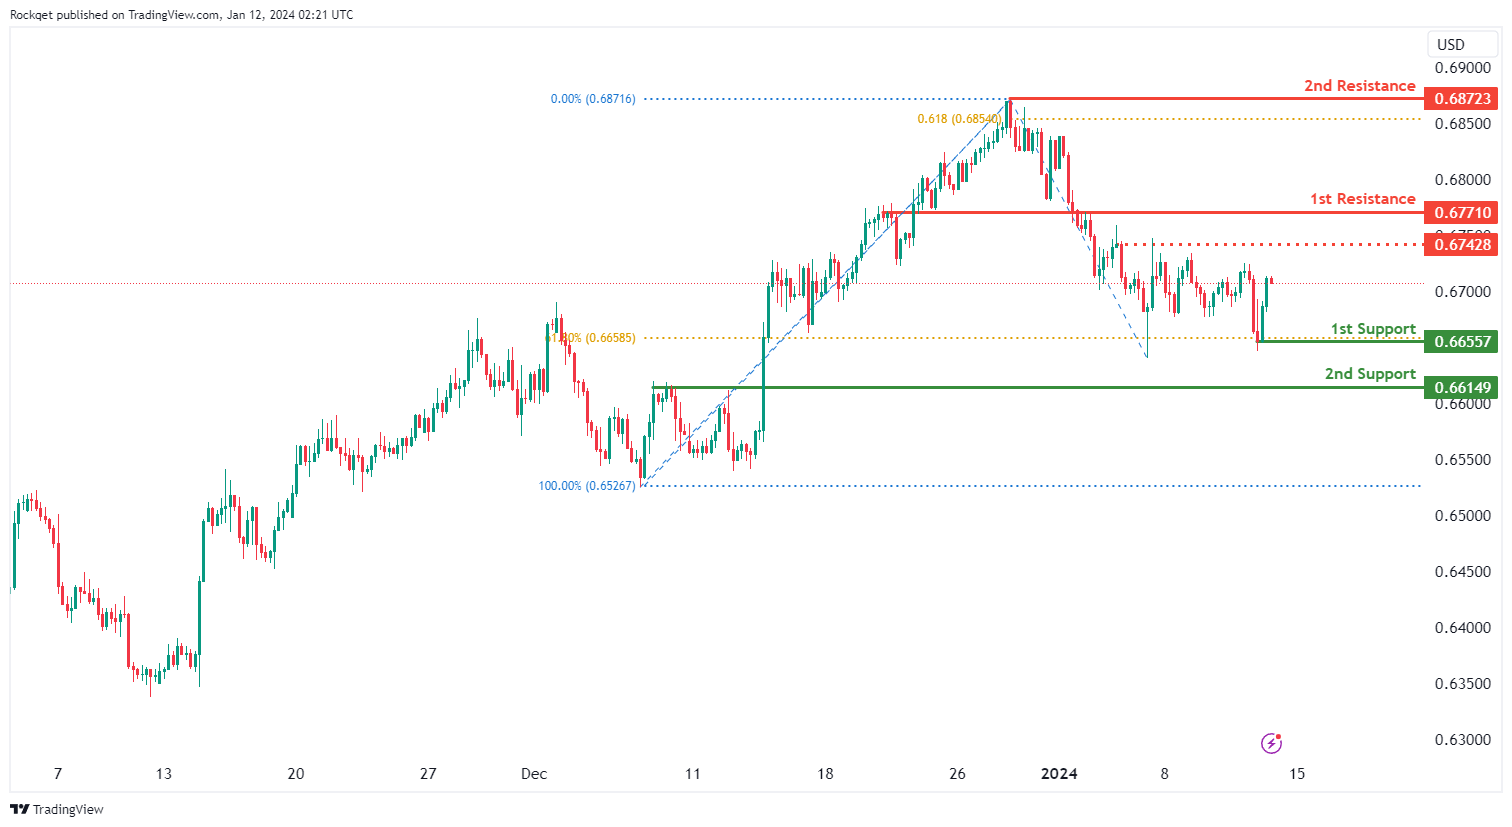
AUD/USD:
The AUD/USD chart currently exhibits a neutral bias. However, there is a potential scenario for price to make a bullish rise towards the 1st resistance should it break above the intermediate resistance.
The intermediate resistance level at 0.6742 is identified as a pullback resistance while the 1st resistance level at 0.6771 is identified as an overlap resistance. Higher up, the 2nd resistance level at 0.6872 is noted as a swing-high resistance that aligns close to the 61.80% Fibonacci projection level, suggesting a potential barrier for further upside movement.
To the downside, the 1st support level at 0.6655 is identified as a pullback support that aligns with the 61.80% Fibonacci retracement level. Further below, the 2nd support level at 0.6614 is also marked as an pullback support, further reinforcing its importance as a key support level.
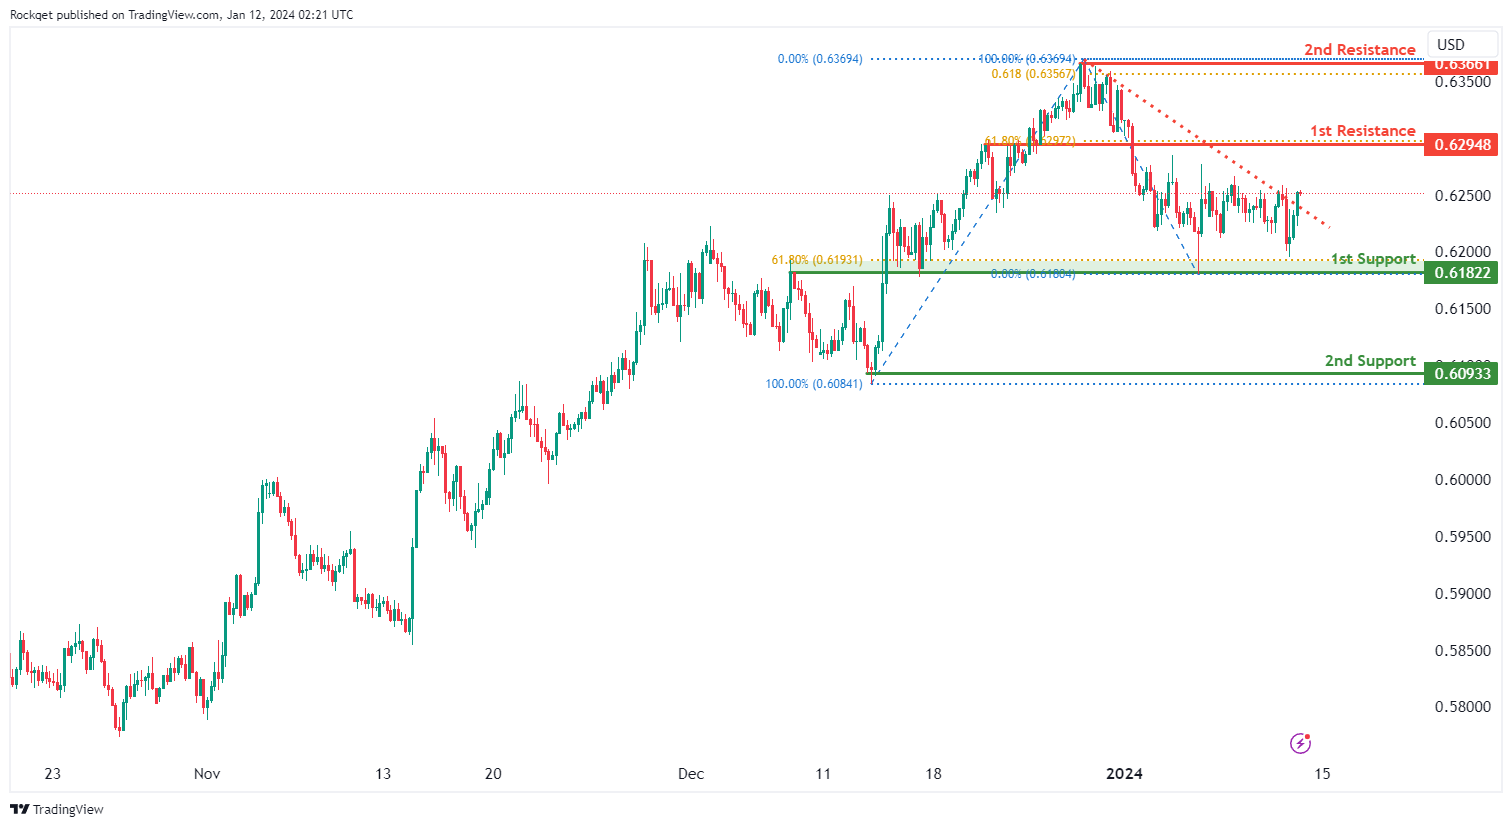
NZD/USD
The NZD/USD chart currently exhibits a neutral bias. However, there is a potential scenario for price to make a bullish rise towards the 1st resistance should it break above the descending trendline.
The 1st resistance level at 0.6294 is identified as an overlap resistance that aligns with the 61.80% Fibonacci retracement level. Higher up, the 2nd resistance level at 0.6366 is noted as a swing-high resistance that aligns close to the 61.80% Fibonacci projection level, suggesting a potential barrier for further upside movement.
To the downside, the 1st support level at 0.6182 is identified as an overlap support that aligns close to the 61.80% Fibonacci retracement level. Further below, the 2nd support level at 0.6093 is marked as a swing-low support, further reinforcing its importance as a key support level.
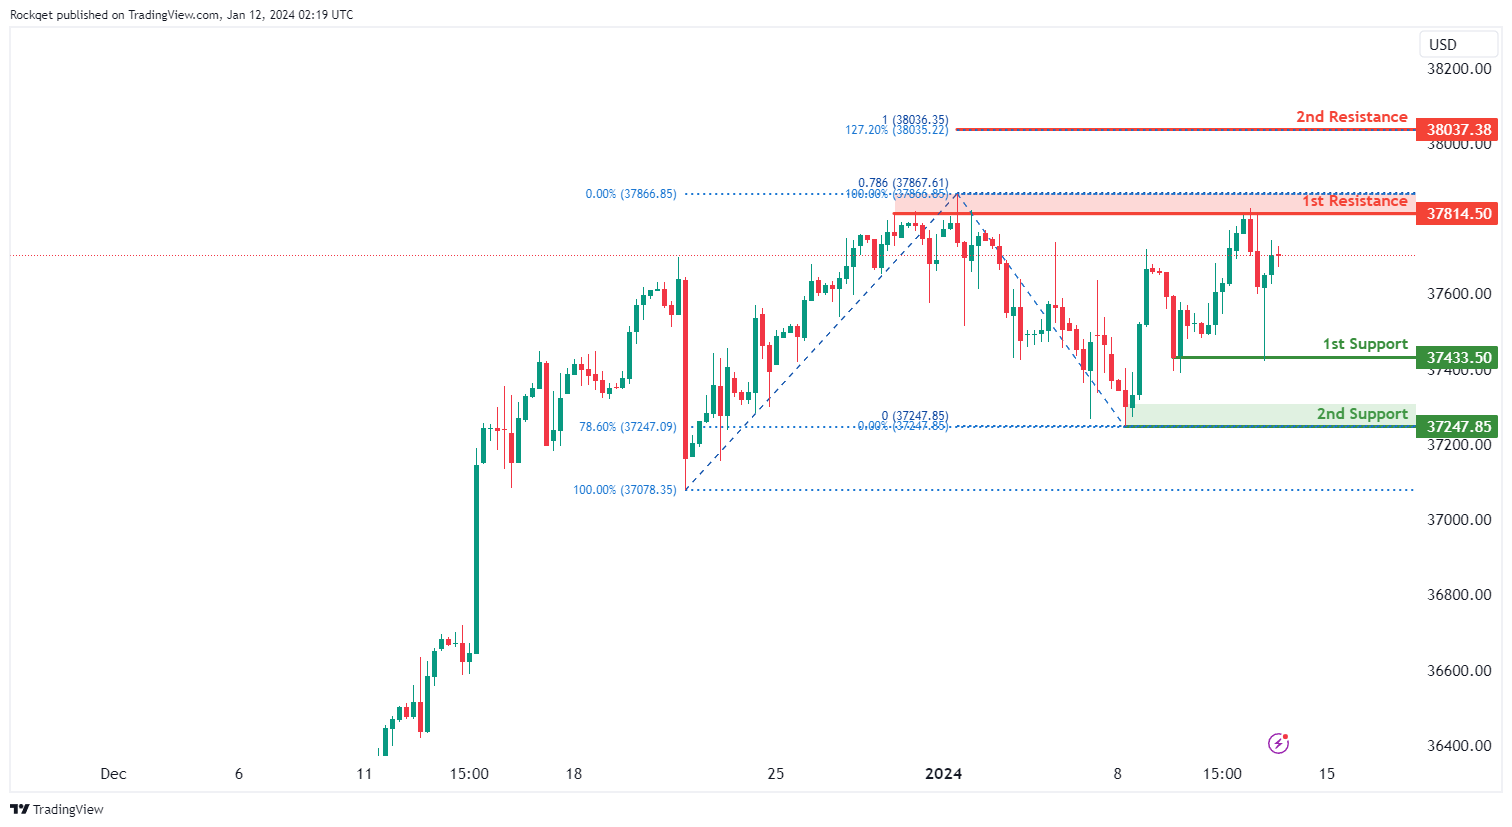
DJ30:
The DJ30 chart currently displays an overall bullish momentum. In this context, there is a potential scenario for price to make a bullish continuation towards the 1st resistance.
The 1st resistance level at 37,814.50 is identified as a pullback resistance that aligns close to the 78.60% Fibonacci projection level. Higher up, the 2nd resistance level at 38,037.38 is recognized as a resistance that aligns with a confluence of Fibonacci levels i.e. the 127.20% extension and the 100.00% projection, adding significance to this potential resistance level.
On the support side, the 1st support level at 37,433.50 is identified as a pullback support. Further below, the 2nd support level at 37,247.85 is also recognized as a pullback support that aligns with the 78.60% Fibonacci retracement level, further adding to its potential as a key support zone.
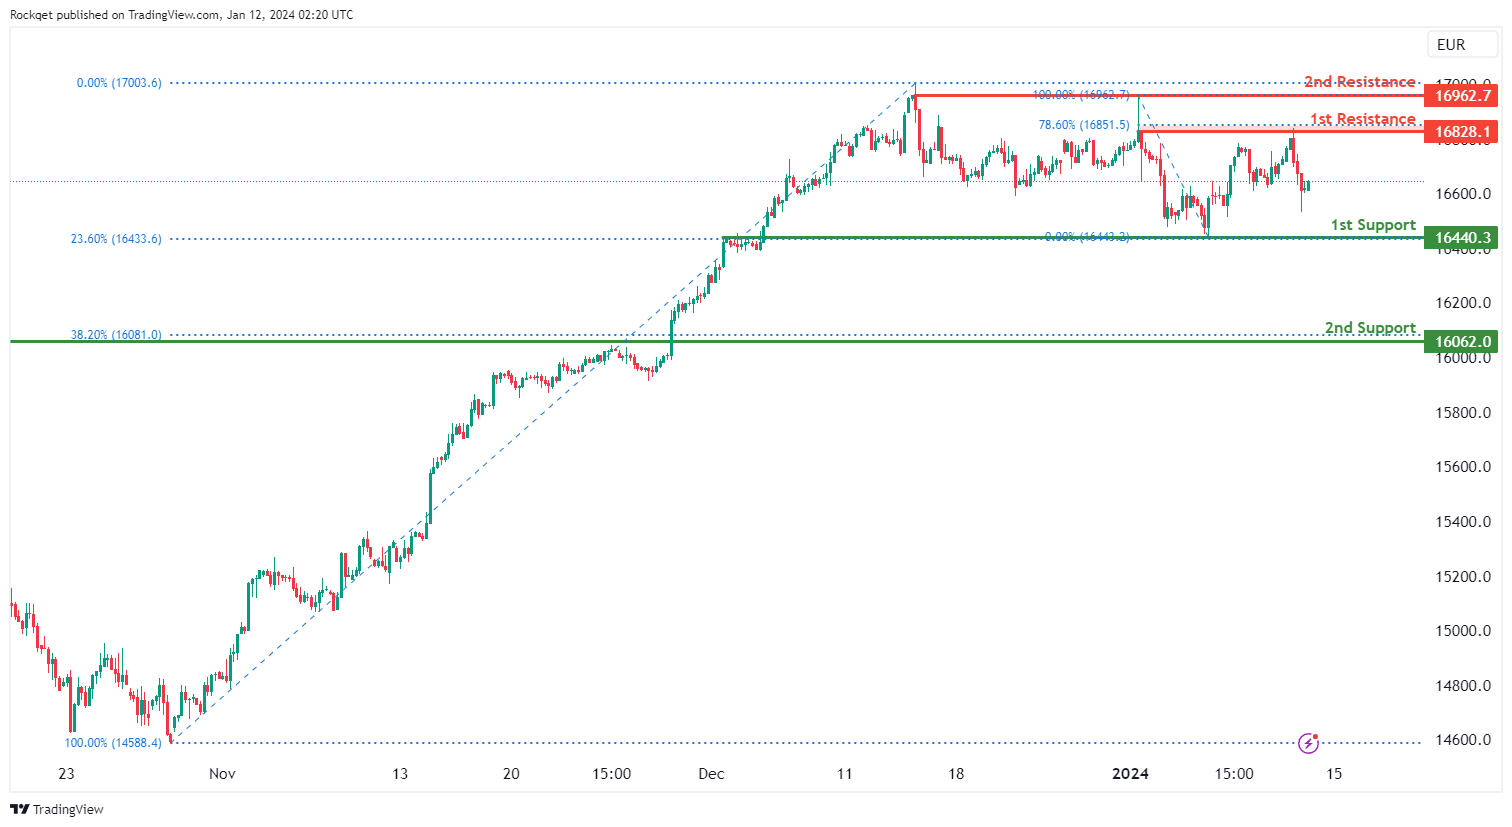
GER40:
The GER40 chart currently displays an overall bullish momentum. In this context, there is a potential scenario for price to make a bullish continuation towards the 1st resistance.
The 1st resistance level at 16,828.10 is identified as a pullback resistance that coincides with the 78.60% Fibonacci retracement level. Higher up, the 2nd resistance level at 16,962.70 is also noted as a pullback resistance, further reinforcing its potential as a barrier to upward movement.
On the support side, the 1st support level at 16,440.30 is identified as an overlap support that aligns with the 23.60% Fibonacci retracement level. The 2nd support level at 16,062.00 is recognized as a pullback support that aligns with the 38.20% Fibonacci retracement level, adding to its potential significance as a level of historical importance.
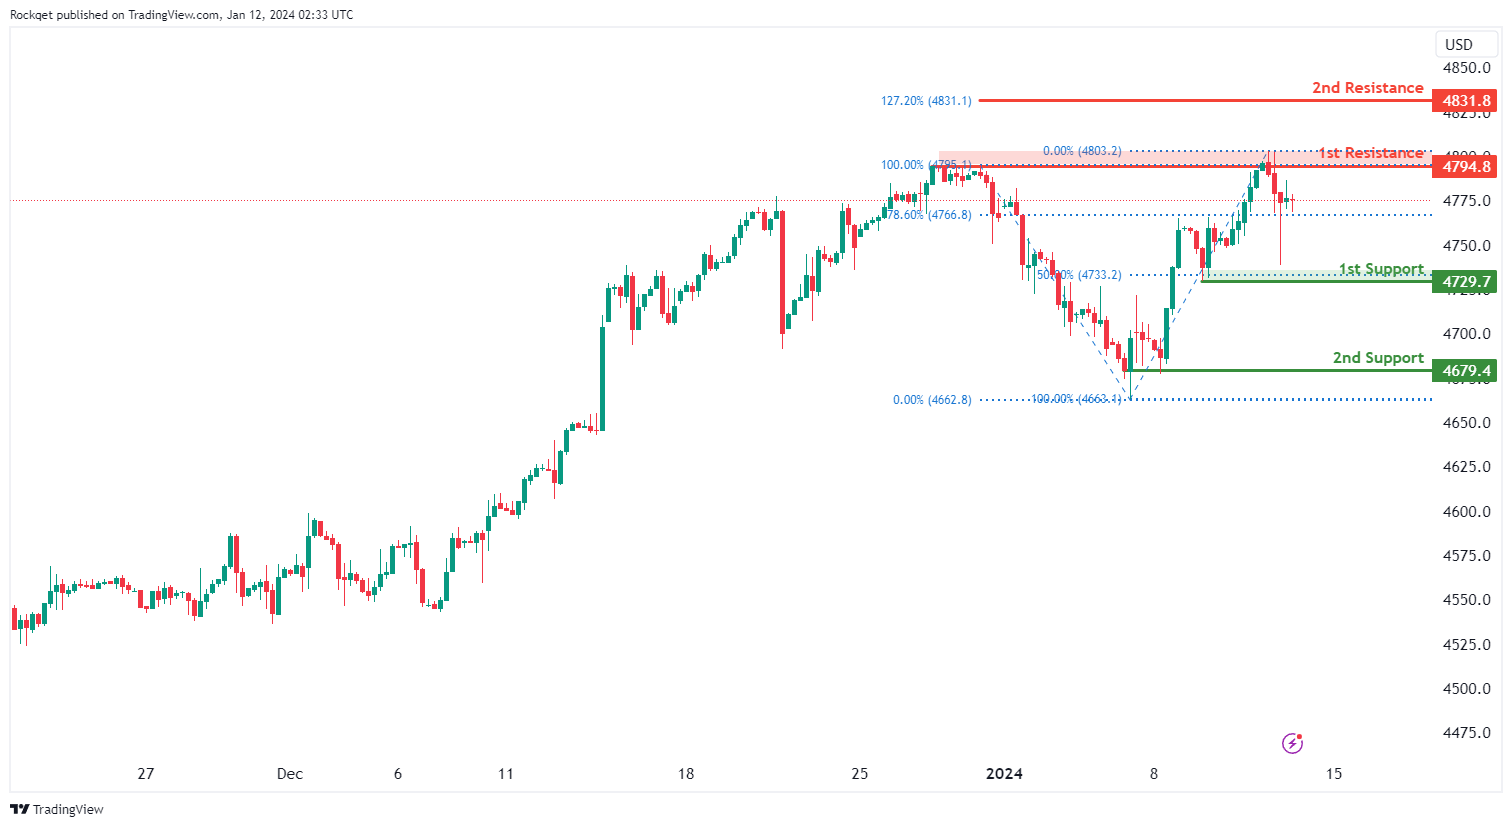
US500:
The US500 chart currently displays an overall bullish momentum. In this context, there is a potential for price to make a bullish continuation towards the 1st resistance.
The 1st resistance level at 4,794.80 is identified as a pullback resistance. Higher up, the 2nd resistance level at 4,831.80 is identified as a resistance that aligns with the 127.20% Fibonacci extension level.
On the support side, the 1st support level at 4,729.70 is identified as a pullback support that aligns with the 50.00% Fibonacci retracement level. Further below, the 2nd support level at 4,679.40 is recognized as a swing-low support, adding to its potential as a support level.'
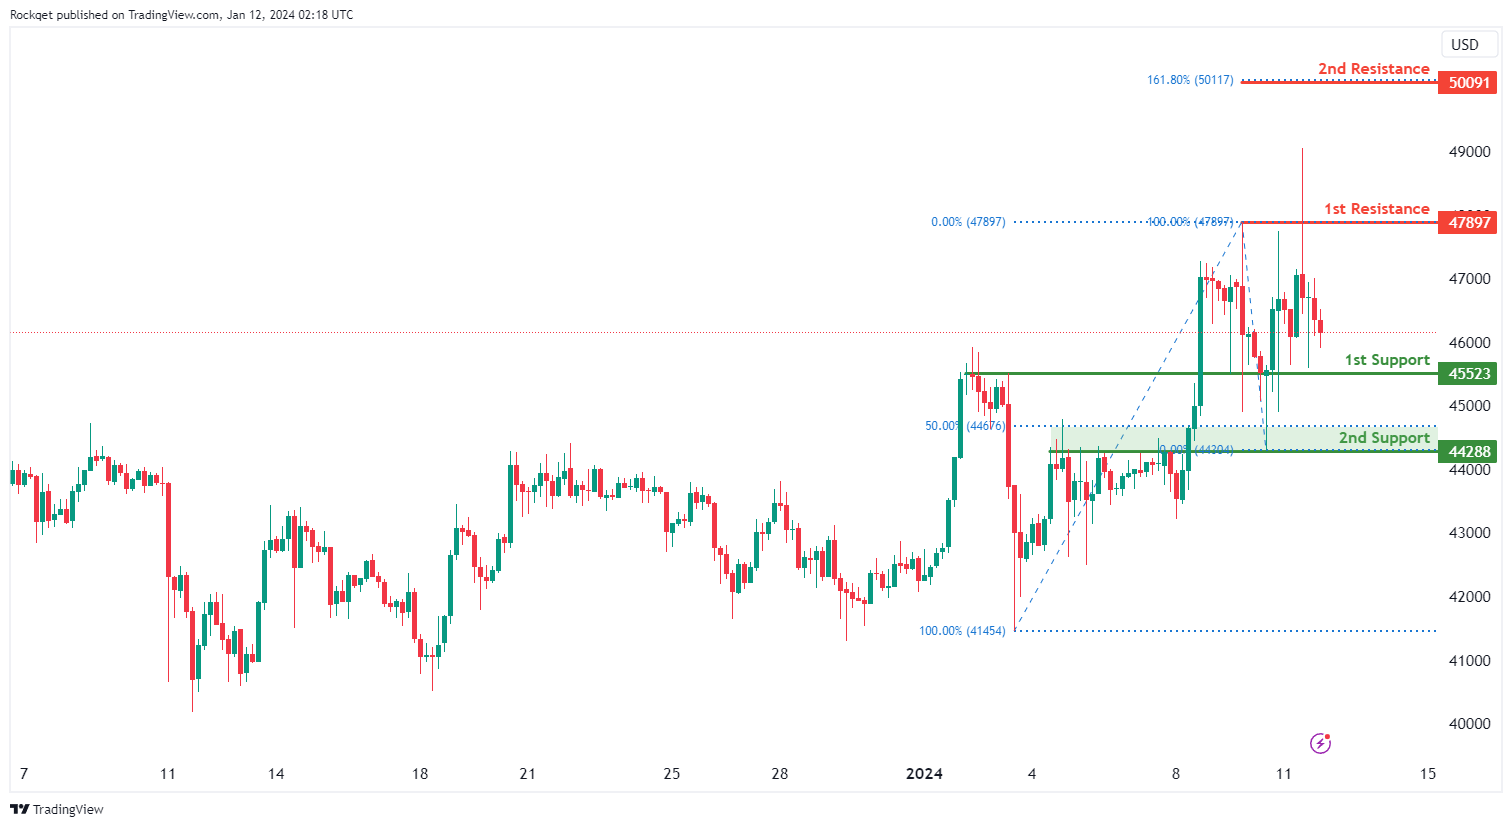
BTC/USD:
The BTC/USD chart currently exhibits a neutral bias, indicating a potential for price to fluctuate between the 1st resistance and the 1st support.
The 1st support level at 45,523 is identified as an overlap support. Further below, the 2nd support level at 44,288 is also recognized as an overlap support that aligns close to the 50.00% Fibonacci retracement level, adding to its potential as a key support.
On the resistance side, the 1st resistance level at 47,897 is identified as a pullback resistance. Higher up, the 2nd resistance level at 50,091 is recognized as a resistance that aligns with the 161.80% Fibonacci extension level, suggesting a level where selling interest could materialize.
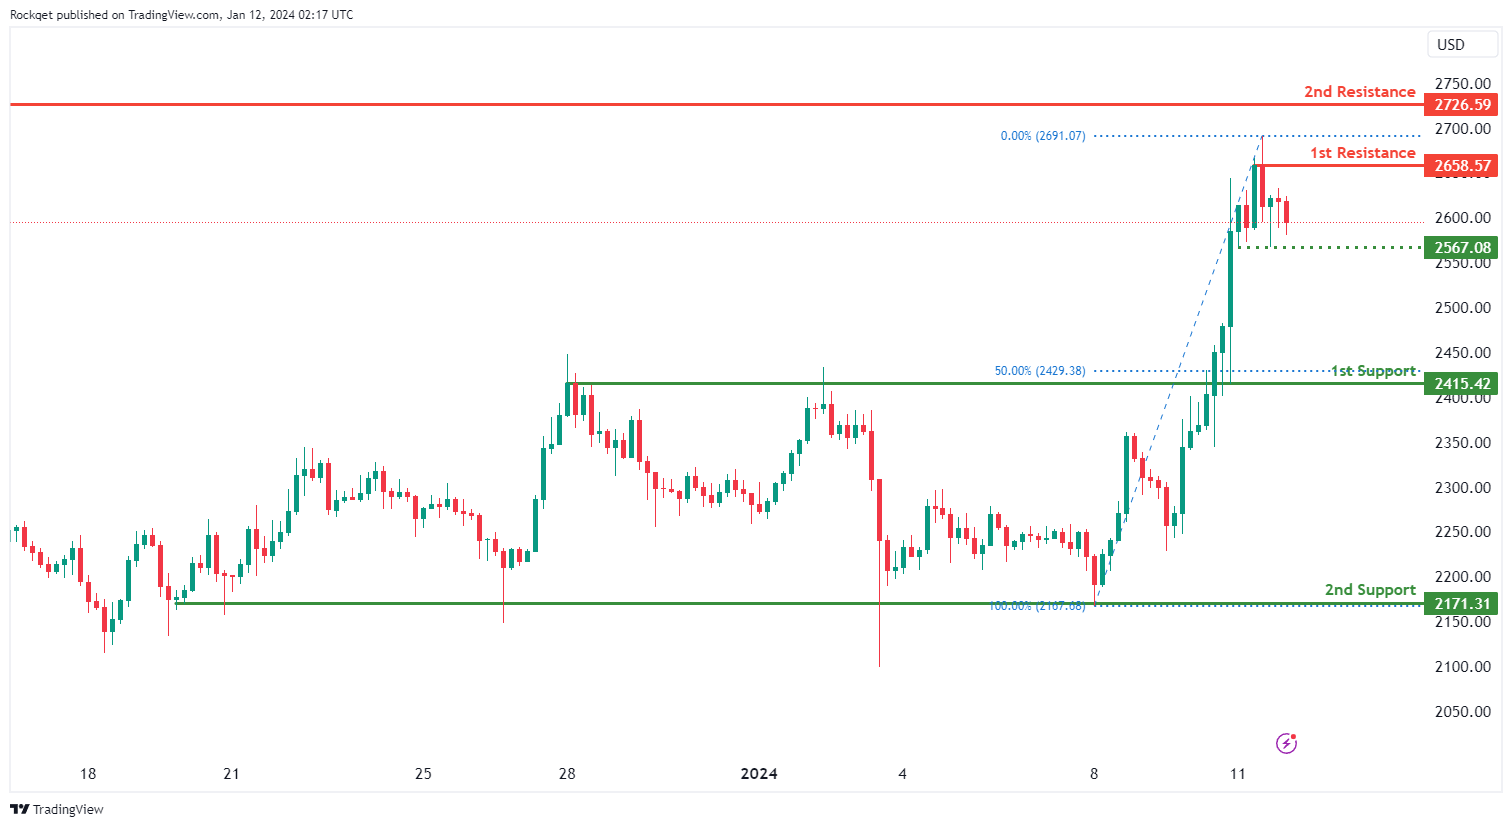
ETH/USD:
The ETH/USD chart currently exhibits an overall bullish momentum. However, there is a potential scenario for price to fall towards the intermediate support before making a bullish bounce.
The intermediate support level at 2,567.08 is identified as a pullback support while the 1st support level at 2,415.42 is also noted as a pullback support that aligns close to the 50.00% Fibonacci retracement level. Further below, the 2nd support level at 2,171.31 is recognized as a multi-swing-low support, adding to its potential as a key support.
On the resistance side, the 1st resistance level at 2,658.57 is identified as a pullback resistance. Higher up, the 2nd resistance level at 2,726.59 is also recognized as a pullback resistance, suggesting a potential barrier for further upside movement.
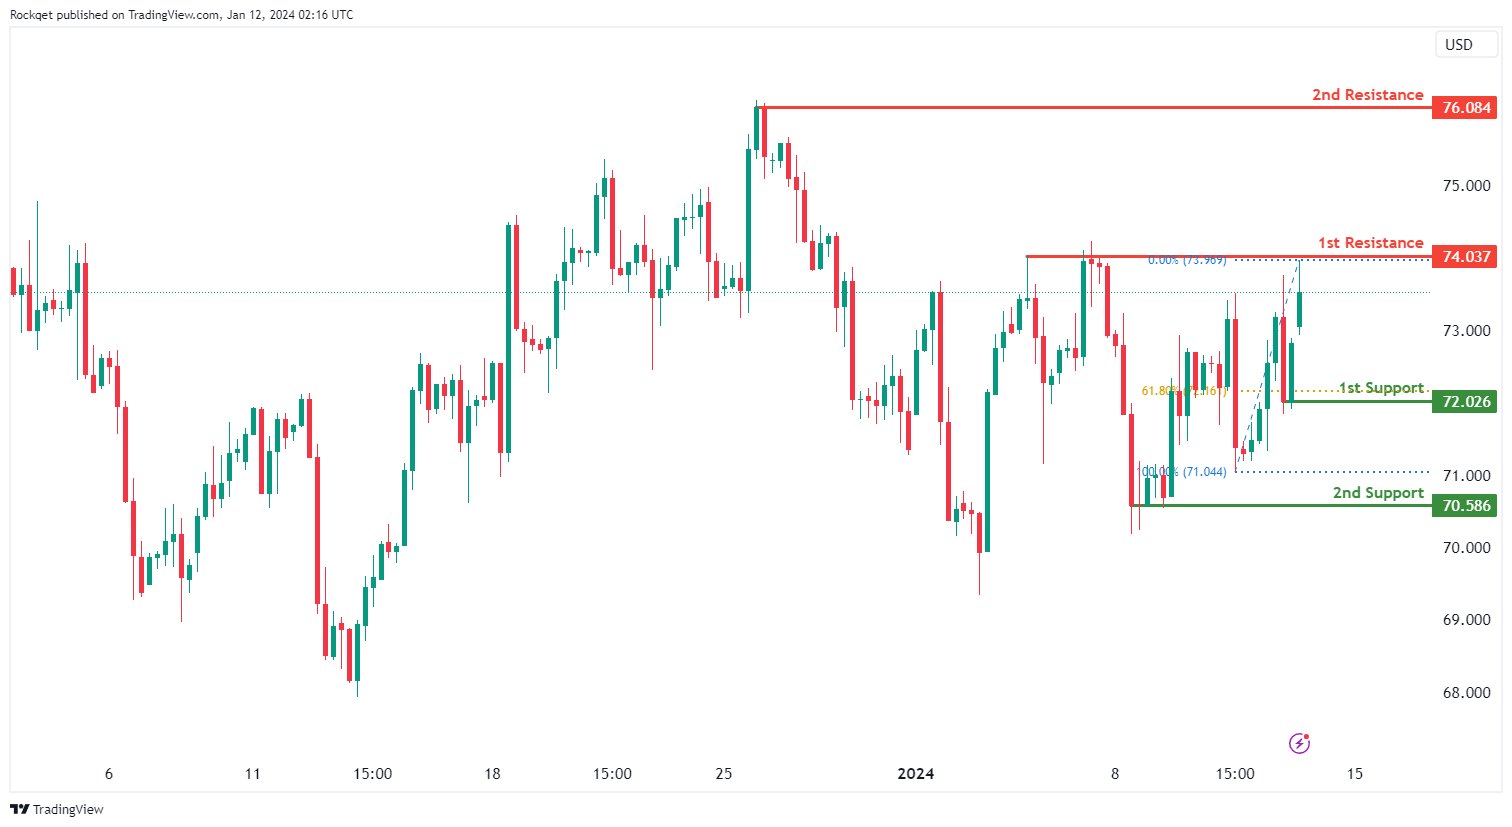
WTI/USD:
The WTI (West Texas Intermediate) chart currently exhibits a neutral bias, indicating a potential for price to fluctuate between the 1st resistance and the 1st support.
The 1st resistance level at 74.03 is identified as a pullback resistance. Higher up, the 2nd resistance level at 76.08 is noted as a swing-high resistance, suggesting a potential barrier for further upside movement.
To the downside, the 1st support level at 72.02 is identified as a pullback support that aligns close to the 61.80% Fibonacci retracement level. Further below, the 2nd support level at 70.58 is also marked as a pullback support, further reinforcing its importance as a key support level.
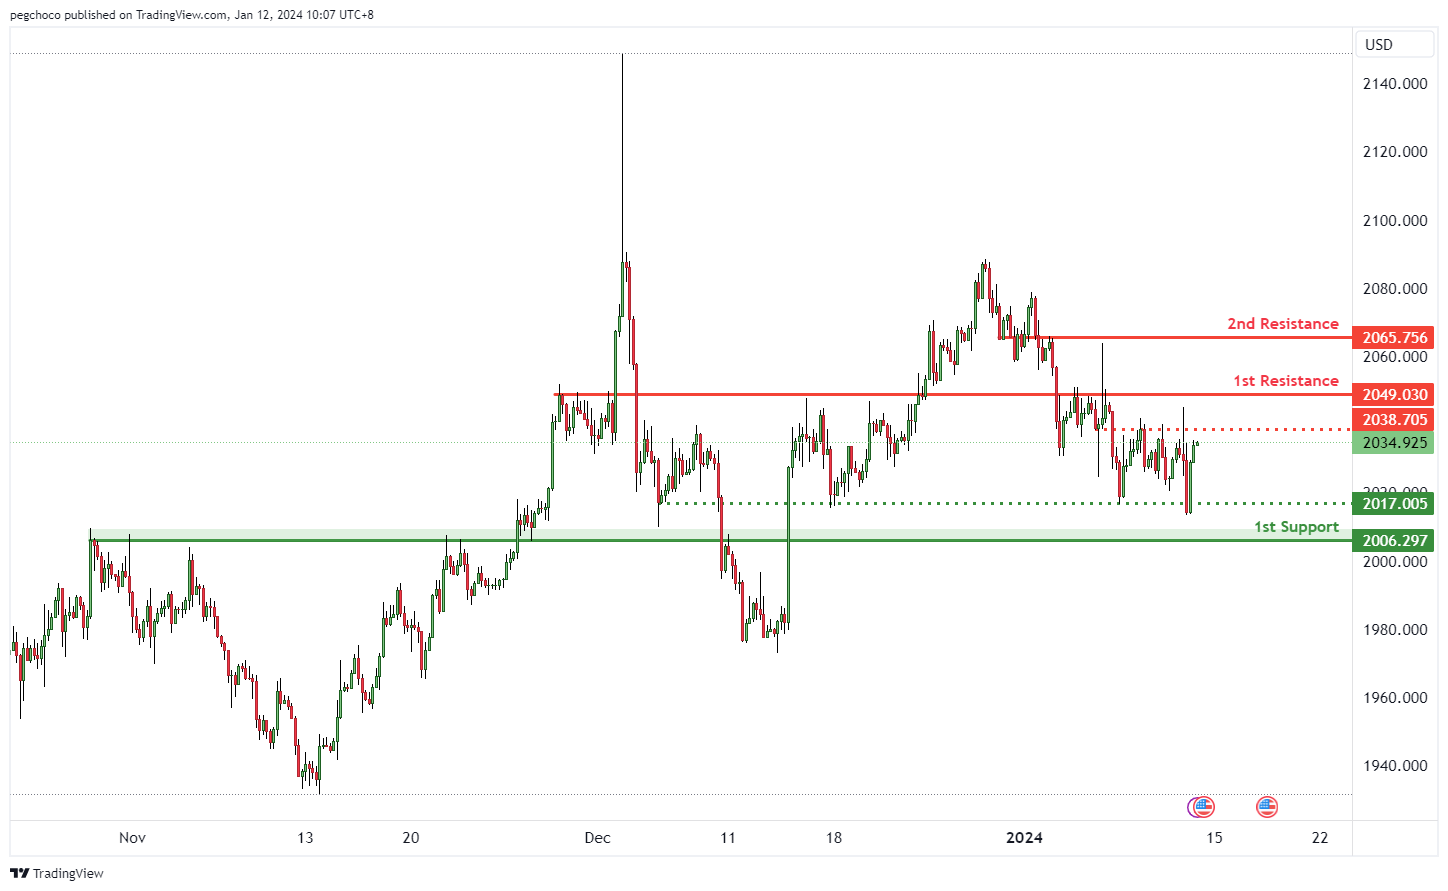
XAU/USD (GOLD):
The XAU/USD chart currently exhibits a bearish overall momentum, suggesting weakness in the price of Gold relative to the US Dollar. This momentum indicates the potential for a bearish reaction off the 1st resistance level, followed by a drop towards the 1st support level.
The 1st support at 2006.29 is identified as a pullback support, indicating a level where buyers might step in, providing temporary support for the XAU/USD pair.
There is also an intermediate support at 2017.00, which is categorized as a multi-swing low support, further reinforcing its significance as a potential support area.
On the resistance side, the 1st resistance at 2049.03 is considered an overlap resistance, suggesting a potential area where selling interest may emerge, leading to a bearish reaction.
The 2nd resistance at 2065.75 is another overlap resistance, indicating a potential barrier to further price advancement.
Additionally, there is an intermediate resistance at 2038.44, marked as an overlap resistance, further adding to the potential resistance levels for XAU/USD.
AUD/USD and NZD/USD Eye Key Upside Break
AUD/USD is moving higher and might rally if it clears 0.6725. NZD/USD is also rising and could extend its increase above the 0.6255 resistance zone.
Important Takeaways for AUD USD and NZD USD Analysis Today
- The Aussie Dollar started a fresh increase above the 0.6680 and 0.6695 levels against the US Dollar.
- There is a key bearish trend line forming with resistance near 0.6715 on the hourly chart of AUD/USD at FXOpen.
- NZD/USD is showing positive signs above the 0.6220 support.
- There is a major bearish trend line forming with resistance near 0.6255 on the hourly chart of NZD/USD at FXOpen.
AUD/USD Technical Analysis
On the hourly chart of AUD/USD at FXOpen, the pair started a fresh increase from the 0.6650 support. The Aussie Dollar was able to clear the 0.6680 resistance to move into a positive zone against the US Dollar.
The bulls pushed the pair above the 50% Fib retracement level of the downward move from the 0.6725 swing high to the 0.6647 low. There was a close above the 0.6695 resistance and the 50-hour simple moving average.
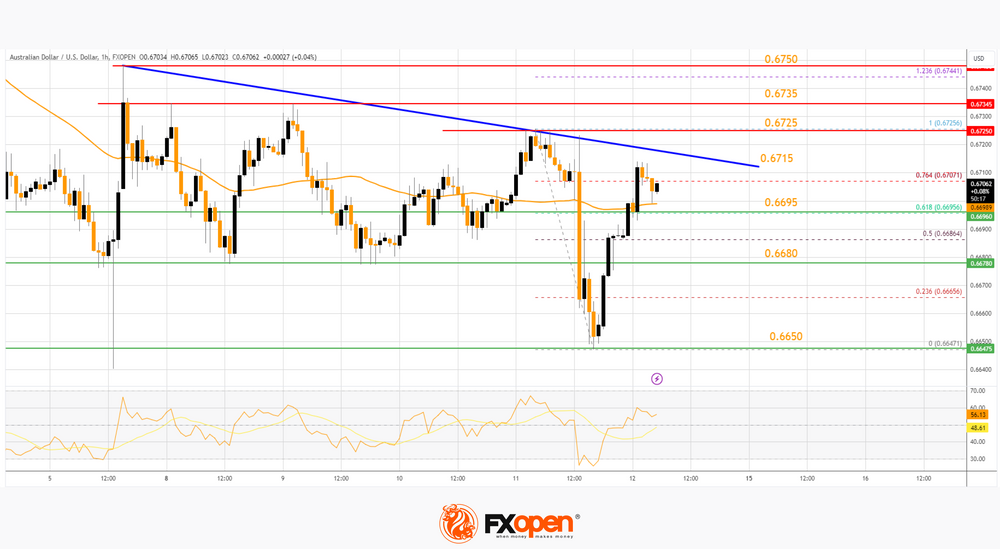
Finally, the pair spiked above the 76.4% Fib retracement level of the downward move from the 0.6725 swing high to the 0.6647 low. On the upside, the AUD/USD chart indicates that the pair is now facing resistance near a key bearish trend line at 0.6715.
The first major resistance might be 0.6725. An upside break above the 0.6725 resistance might send the pair further higher. The next major resistance is near the 0.6750 level. Any more gains could clear the path for a move toward the 0.6820 resistance zone.
If not, the pair might correct lower below the 50-hour simple moving average at 0.6695. The next support could be 0.6680. If there is a downside break below the 0.6680 support, the pair could extend its decline toward the 0.6650 zone. Any more losses might signal a move toward 0.6600.
NZD/USD Technical Analysis
On the hourly chart of NZD/USD on FXOpen, the pair started a steady increase from the 0.6200 level. The New Zealand Dollar broke the 0.6220 resistance to start the recent increase against the US Dollar.
The pair settled above 0.6235 and the 50-hour simple moving average. It tested the 0.6260 zone and is currently consolidating gains above the 23.6% Fib retracement level of the upward wave from the 0.6195 swing low to the 0.6258 high.
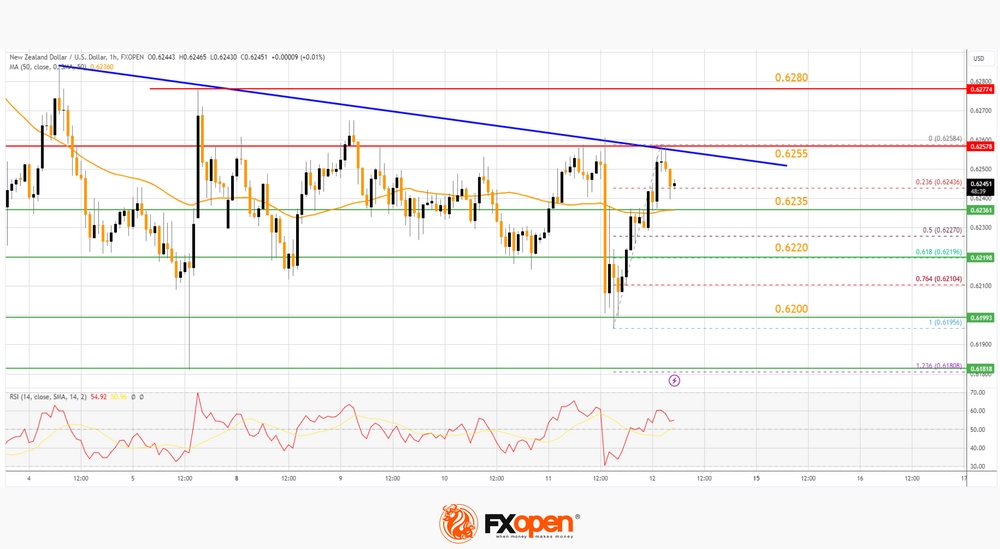
The NZD/USD chart suggests that the RSI is still above 50 and signaling more upsides. On the upside, the pair might struggle near 0.6255 and a major bearish trend line.
The next major resistance is near the 0.6280 level. A clear move above the 0.6280 level might even push the pair toward the 0.6320 level. Any more gains might clear the path for a move toward the 0.6400 resistance zone in the coming days.
On the downside, there is a support forming near the 50-hour simple moving average at 0.6235. The next major support is near the 61.8% Fib retracement level of the upward wave from the 0.6195 swing low to the 0.6258 high at 0.6220.
If there is a downside break below the 0.6220 support, the pair might slide toward the 0.6200 support. Any more losses could lead NZD/USD in a bearish zone to 0.6160.
This article represents the opinion of the Companies operating under the FXOpen brand only. It is not to be construed as an offer, solicitation, or recommendation with respect to products and services provided by the Companies operating under the FXOpen brand, nor is it to be considered financial advice.
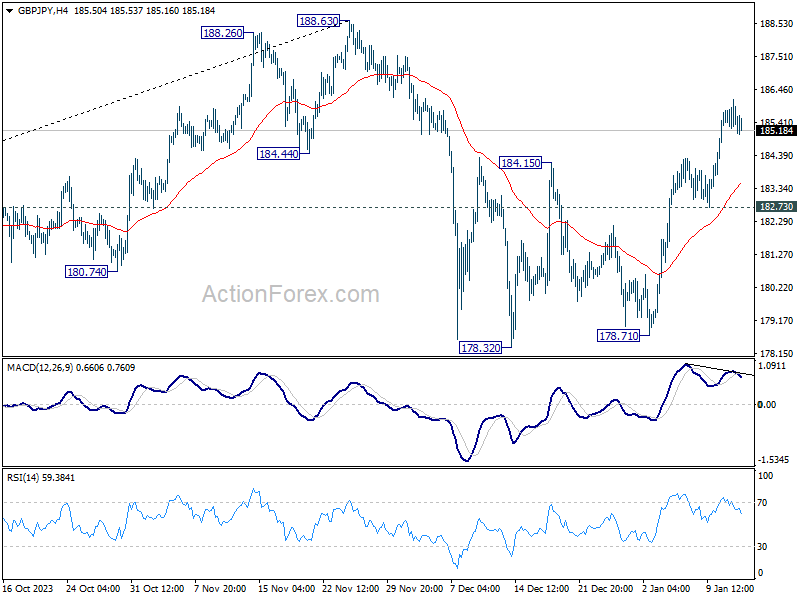
GBP/JPY Daily Outlook
GBP/JPY's rebound 178.32 is in progress and intraday bias stays on the upside. Current rise should target a test on 188.63 high. On the downside, break of 182.73 support is needed to indicate completion of the rebound. Otherwise, further rally will remain in favor in case of retreat.
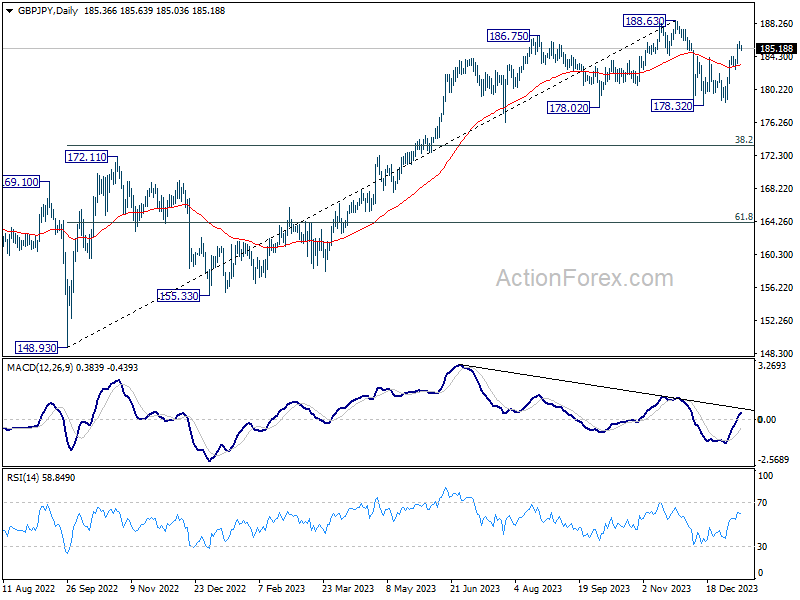
In the bigger picture, price actions from 188.63 medium term top are seen as a correction to the up trend from 148.93 (2022 low) only. As long as 172.11 resistance turned support holds, larger up trend from 123.94 (2020 low) is still in favor to resume through 188.63 at a later stage.
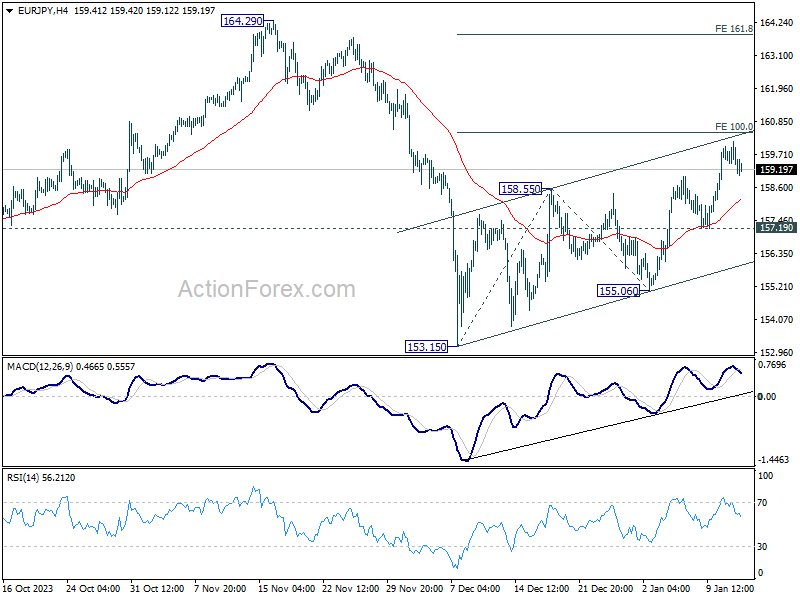
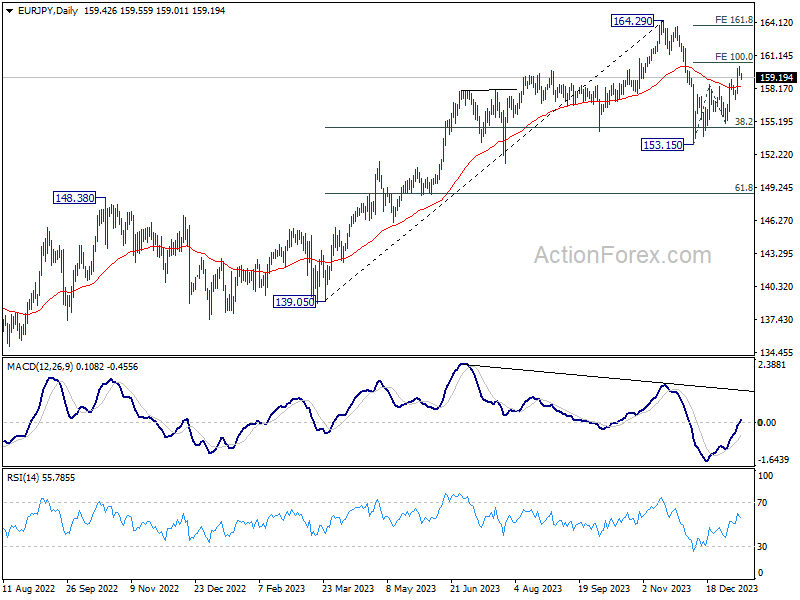
EUR/JPY Daily Outlook
Daily Pivots: (S1) 159.15; (P) 159.66; (R1) 159.95; More...
Despite loss of upside momentum, further rally is expected in EUR/JPY for now. Rebound from 153.15 would target 100% projection of 153.15 to 158.55 from 155.06 at 160.46. Firm break there will target 161.8% projection at 163.79. However, break of 157.19 support will argue that the rebound has completed, and turn bias back to the downside.
In the bigger picture, price actions from 164.29 medium term top are tentatively seen as a correction to rise from 139.05 for now. As long as 148.48 resistance turned support holds (2022 high), larger up trend from 114.42 (2020 low) could still resume through 164.29 at a later stage.
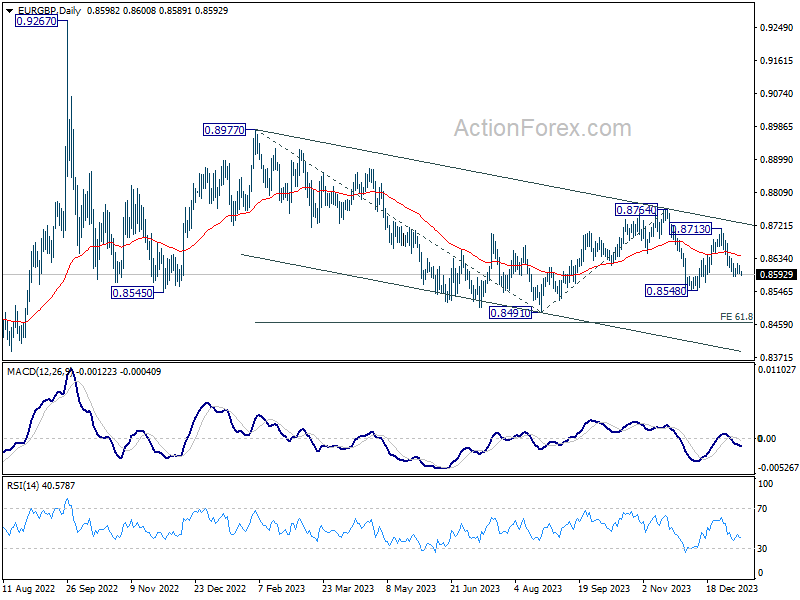
EUR/GBP Daily Outlook
Daily Pivots: (S1) 0.8589; (P) 0.8603; (R1) 0.8612; More...
EUR/GBP is extending the consolidation from 0.8585 temporary low and intraday bias stays neutral. Further decline is in favor with 0.8638 minor resistance intact. On the downside, break of 0.8585 will resume the fall from 0.8713 to 0.8548 support first. Break there will target 0.8491 low next. However, break of 0.8638 will turn bias to the upside for stronger rebound.
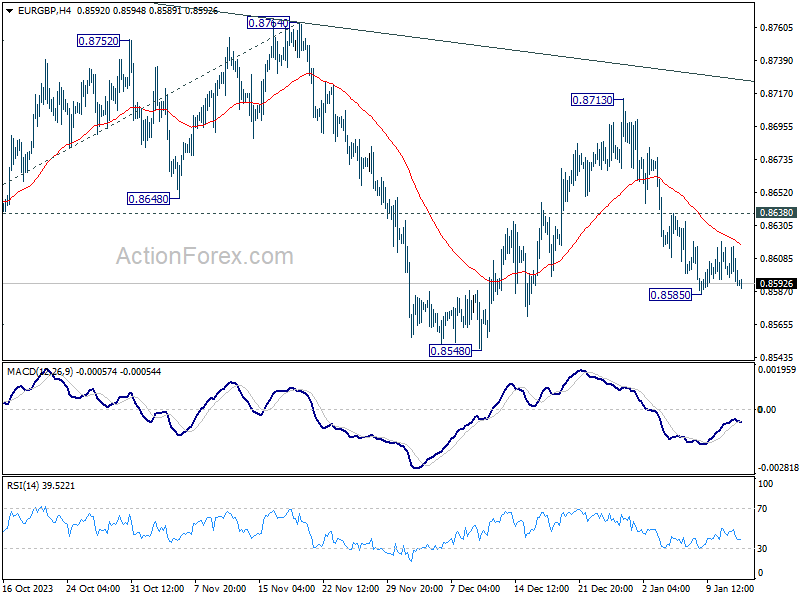
In the bigger picture, fall from 0.8764 is seen as another leg in the whole down trend from 0.9267 (2022 high). Outlook will stay bearish as long as 0.8764 resistance holds. Break of 0.8491 will target 61.8% projection of 0.8977 to 0.8491 from 0.8764 at 0.8464.
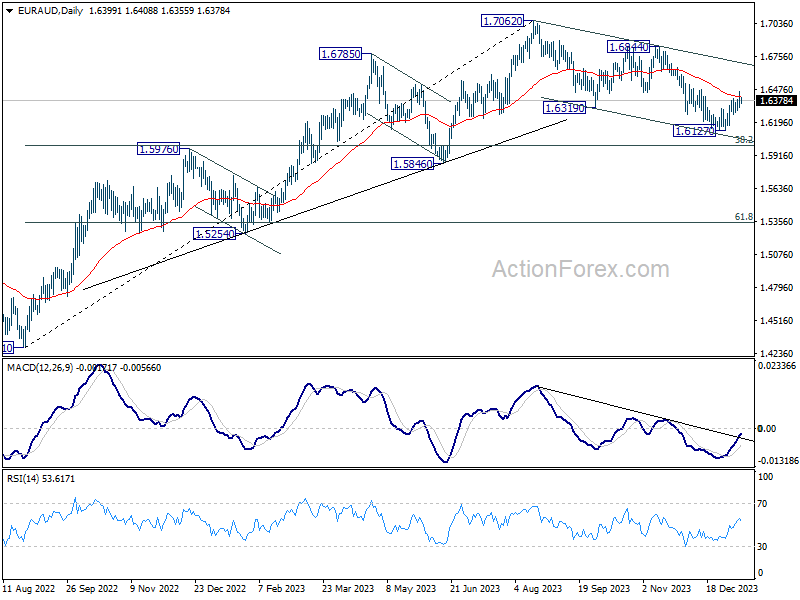
EUR/AUD Daily Outlook
Daily Pivots: (S1) 1.6337; (P) 1.6398; (R1) 1.6470; More...
EUR/AUD is trying to resume the rebound from 1.6127 by breaking 1.6398. Intraday bias is mildly on the upside for 1.6478 resistance. Firm break there will argue that whole correction from 1.7062 has completed, and target 1.6844 resistance for confirmation. Nevertheless, break of 1.6278 minor support will turn bias back to the downside for retesting 1.6127 low.
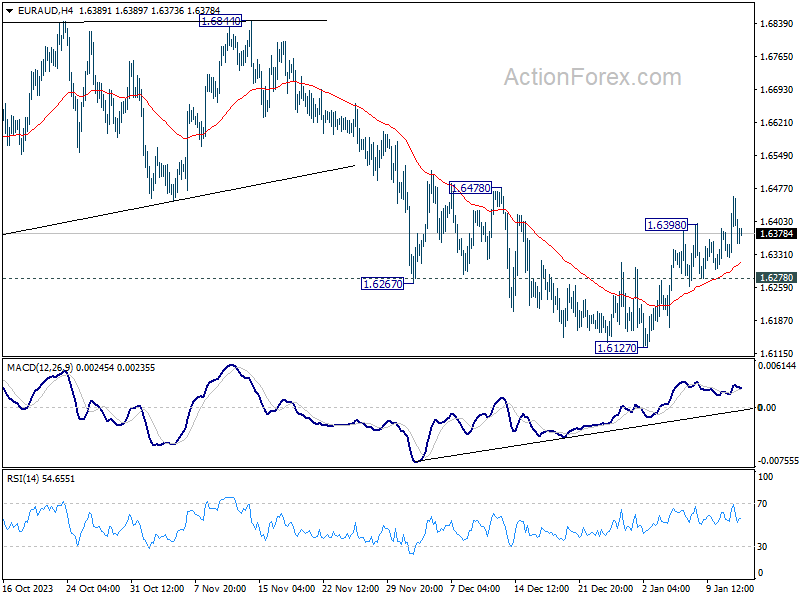
In the bigger picture, fall from 1.7062 medium term top is seen as correction to the up trend from 1.4281 (2022 low). Strong support should be seen around 1.5846 and 38.2% retracement of 1.4281 to 1.7062 at 1.6000 bring rebound. Break of 1.6844 will argue that this up trend is ready to resume through 1.7062 high.
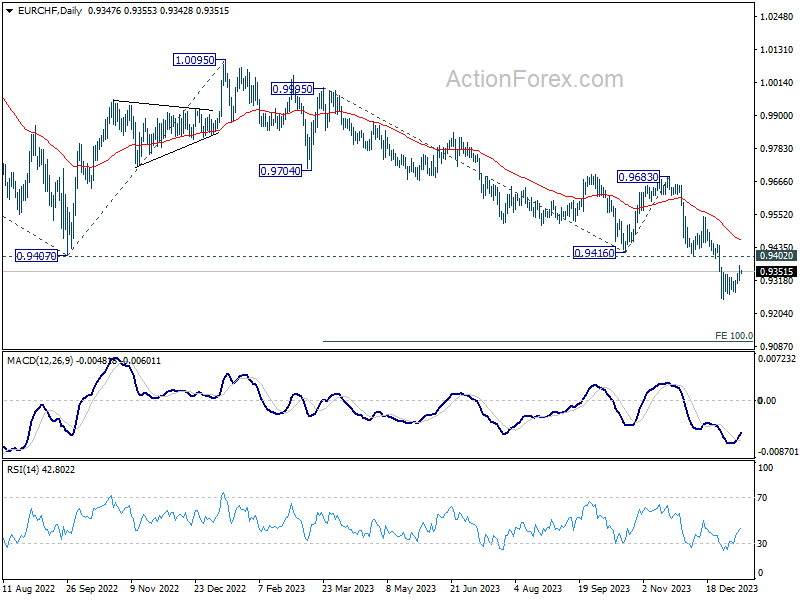
EUR/CHF Daily Outlook
Daily Pivots: (S1) 0.9321; (P) 0.9348; (R1) 0.9375; More...
EUR/CHF recovered higher today but outlook is unchanged. Intraday bias stays neutral first and outlook remains bearish with 0.9402 support turned resistance intact. On the downside, break of 0.9252 will resume larger down trend to 100% projection of 0.9995 to 0.9416 from 0.9683 at 0.9104 next.
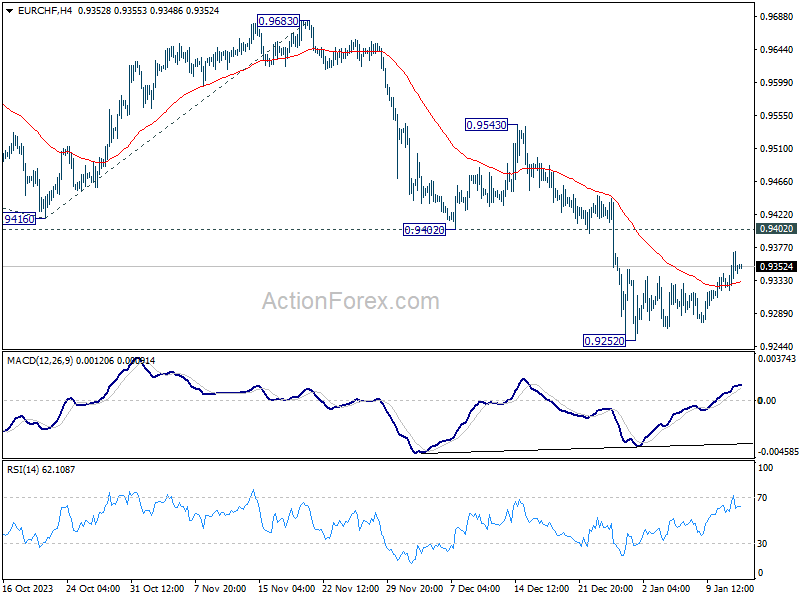
In the bigger picture, medium term outlook remains bearish as long as 0.9683 resistance holds. Current fall from 1.2004 (2018 high) is part of the multi-decade down trend. Next target is 61.8% projection of 1.1149 (2020 high) to 0.9407 from 1.0095 at 0.9018.
Dollar a Tad Softer in Uninspired Trading
Markets
Yesterday’s above-consensus US CPI numbers highlight the bumpy nature of the disinflationary process. It was reason enough for the likes of Barkin (Richmond Fed) and Mester (Cleveland Fed) to stay cautious. Both want more evidence with the latter stating that March is probably too soon for a rate cut. Goolsbee (Chicago) bluntly stated that the market was getting ahead of itself. The market reaction itself was muted with a kneejerk move higher in US yields quickly running into resistance. Failing to take out this week’s highs, a technical countermove occurred. Safe haven flows on rumours that the UK together with the US was about to carry out retaliatory missile strikes on Houthi targets extended the downleg. Net daily losses amounted to -3.2 (30-y) to -11.3 bps (2-y). German rate changes varied between -2.3 bps (2-y) and +0.8 bps (30-y). ECB’s Lagarde in an after-market speech said they are winning the inflation battle but joined her US colleagues in wanting confirmation from the data before switching the mindset to rate cuts. The Japanese yen erased previous losses on rising tensions in the Middle East. USD/JPY finished at 145.29 compared to an intraday high of 146.4. EUR/JPY’s adventure above 160 ended soon. EUR/USD experienced some CPI-induced volatility but in the end closed unchanged around 1.097. European stock markets fainted going into the close while Wall Street recovered from a weak open.
Oil prices gap higher this morning in response to the airstrikes. Brent is trading around $79.2/b. Equity markets trade mixed with Japan again outperforming. Stocks in China and South Korea lag. Taiwan is holding its nerves ahead of what are considered pivotal presidential elections this Saturday. The ruling Democratic Progressive Party wants to maintain the status quo vis-à-vis China and strengthen ties with western allies. Opposition candidates however seek to smoothen relations with the Chinese. European equities seem less bothered with geopolitics with futures pointing at a solid open. The dollar is a tad softer in uninspired trading. The economic calendar hasn’t much to offer to change that, unfortunately. Financial companies kick off the Q4 earnings season. US PPI’s are worth mentioning but matter only from an intraday perspective. From a technical point of view, EUR/USD 1.10 looks more prone for a test to the upside than 1.0875 to the downside. Yesterday’s setback has pushed the US 2-y yield back to the December lows of around 4.22%. This level has to hold for the technical picture not to weaken. The 10-y tenor continues to struggle around 4%.
News & Views
Bloomberg reports that Bank of Japan officials are likely to discuss cutting their growth and inflation forecasts when they meet next on January 23. A drop in oil prices could trigger a downward revision of CPI ex fresh food for fiscal year 2024 (starting in April) from 2.8% to 2.5%. In fiscal year 2025, the BoJ will continue to expect inflation below the 2% target. Officials are also likely to discuss a sharper cut in the growth forecast for this fiscal year after weaker-than-expected GDP figures in the third quarter, the sources said. The article strengthens market believe that the BoJ will continue pushing forward its real policy U-turn. Since the start of the year, this triggered new JPY weakness in combination with the rebound in core bond yields. EUR/JPY yesterday tested 62% retracement on the Nov/Dec correction lower at 160.07. USD/JPY made an attempt at 50% retracement on the same correction (146.08). Some safe haven flows related to the above mentioned US/UK strikes prevented a break higher, at least for now.
Chinese exports rose by 2.3% Y/Y in dollar terms in December, helped by favorable comparisons with a year ago when Covid ran through the country. Imports increased by 0.2% M/M, especially thanks to improved ties with Australia (25% increase). For the full-year 2023, Chinese exports dropped by 4.6% compared to record year 2022 marking a first decline since 2016. Full-year imports fell by 5.5% resulting in an $823bn trade surplus for 2023. Chinese inflation data were reported separately. CPI rose for the first time in three months, by 0.1% M/M, but the Y/Y-figure remains mired in negative territory (-0.3%). For 2023 as a whole, CPI inflation averaged only 0.2%. Core CPI held steady at 0.6% Y/Y in December. Factory-gate inflation (PPI) was negative for a fifteenth month running (-2.7% Y/Y), falling by 3% over 2023.
US and UK Launch Airstrikes on Yemen’s Houthis
In focus today
Following the airstrike launched by the US and UK against Houthi rebel target in Yemen overnight (see more below), geopolitics will be on top of the agenda.
Today, in the UK, we get the monthly GDP estimate for November. It will be interesting to see whether it mirrors the positive momentum indicated by PMIs, which have hovered in expansionary territory the past months.
The US December PPI is also due for release today. Yesterday, both headline and core CPI picked up 0.3% m/m, which markets took as a hawkish signal, but with an overall muted impact.
In Sweden we get housing price statistics (CET 06.00) for December and the Riksbank's Deputy Governor Aino Bunge will attend an event at the Ekonomichefsdagarna conference organised by Kommunalekonomernas förening (KEF) to discuss the economic situation and current monetary policy.
We look to Asia over the weekend, as on Saturday Taiwan will elect a new President as well as parliament. In Taiwan, polls are not allowed 10 days before the election but the most recent surves show a pretty tight margin between DPP's William Lai and KMT's Hou Yu-ih. Lai leads with 36% support vs 31% for Hou. DPP is currently in power and a victory for Lai would mean more of the same with an independence leaning stance whereas a victory by Hou could ease tensions a bit as KMT has generally had a less confrontational stance towards Beijing, although still not being in favour of unification. Also if Lai wins he will have a weaker mandate than current president Tsai Ing-wen who got close to 60% of the votes in 2020 and DPP will likely lose the majority in the Taiwanese parliament.
Finally, early morning European time on Monday, China is expected to lower the policy rate, the Medium Lending Facility 1-year rate, by 10bp from 2.5% to 2.4%.
Economic and market news
What happened overnight: Geopolitics. Oil prices surged overnight, as the US and UK launched airstrikes on the Yemen Houthis, marking a significant escalation in the already tense situation around the Red Sea. The move was a response to the recent Houthi attacks on international shipping in the area, which has so far counted 27 attacks in the past two months, according to US officials. This has vastly reduced the number of containers passing through the Suez Canal, which have instead opted to sail the long way around Africa. As of this morning, Brent was up 1.9% at 78.9 USD/bbl., extending gains from yesterday whe Iran seized an oil tanker off the coast of Oman.
China. Headline CPI dropped again in December by 0.3% y/y, which was a little less than the -0.4% y/y expected by consensus. It was the third month in a row with deflation in headline CPI but again it was mainly driven by a decline in food prices (-3.7%). Core inflation (ex food and energy) was flat at 0.6% y/y so we are still not seeing broad-based deflation. Lower food prices is actually good for consumers as it lowers living costs and thus improves purchasing power. Chinese trade data were also better than expected showing a rise in exports from 0.5% y/y to 2.3% y/y (consensus 1.5% y/y). Since export prices are falling it corresponds to a rise in real terms of around 8%. It highlights that a) the headwind to the Chinese economy from weak exports is fading and b) the global manufacturing recession is easing. Imports rose from -0.6% y/y to 0.2% y/y (consensus -0.5% y/y).
Bank of Japan. Overnight, reports surfaced that the Bank of Japan is said to revise forecasts for inflation and growth down for the fiscal year 2024 (starting in April) at its meeting on 22-23 January. However, we stress that the projections further out are the ones of significance, of which there are no reports of changes. Officials continue to expect inflation to re-accelerate after a brief slowdown. We therefor do not see this as a gamechanger, although it highlights that the BoJ is likely to stay on hold at the January meeting. We expect the BoJ to exit the negative interest rate policy in April 2024.
What happened yesterday:
US CPI: The most anticipated news of the day was the release of the US CPI for December. Both surprised slightly to the upside, with headline printing at 0.3% m/m (cons. 0.2%), and core at 0.31% m/m (cons. 0.3%). Both the dollar and 10Y treasury yields gained on release, as markets tempered expectations of a March rate cut, but the movements more or less reversed over the day, with EUR/USD marginally down and yields flat. We got hawkish signals from Cleveland's Mester, who said that a March cut would be too soon. On balance, markets are still pricing in 6 rate cuts during the course of the year, which we think is too optimistic, and instead expect 4 rate cuts, with the first in March. See also Global Inflation Watch - Diverging Signals in December, 12 January for an overview of global latest inflation trends.
Energy markets: European gas prices declined about 0.5% in yesterday's session. After a mild start to the winter the freezing spell of the past week has been a test for the European gas supply, and it looks to have passed. As of Monday, the EU's gas storage was still 83% full, giving confidence that a lack of gas is unlikely to be a large problem going forward.
Riksbank: Finally, The Riksbank's Per Jansson said in a speech that inflation pressures have come down and that he is convinced that interest rates had peaked. He also signalled that the SEK is still on the Riksbank's radar, with the comment: "But exchange rates can fluctuate rapidly [...] and they can in turn affect inflation prospects".
Equities: Equities held tight on Thursday, although investors had several reasons to sell: Inflation was a little too hot, job data a little too strong and Fed speeches on the hawkish side. However, S&P 500 was down only -0.1% and VIX even dropped slightly. The limited equity impact is interesting and quite positive. Short-term positioning and sentiment is not as stretched long as one could have thought. That being said, investors were not happy. Defensives outperformed and yield sensitive sectors such as utilities and real estate were the losers of the day. Rotation story in the Nordics as well with high multiple stocks like Genmab or EQT selling off and investors piling into defensives like Carlsberg and Coloplast, up +4%. The Japanese rally is continuing this morning after another round of falling inflation figures. European futures are higher this morning and US a notch lower.
FI: The key highlight yesterday, the US CPI figure, yielded a whipsaw market reaction. While initially sending yields higher on a better than expected print, the 2y UST was up by 5bp, however it was quickly reversed. By the end of the day, European yields were virtually unchanged in the 10y point. Following the change of the10y Benchmark bond (Feb 2034), the Italy-Germany spread now stands at 157bp. Curves steepened from the front end, adding 2bp to the rate cut priced for this year to 141bp. Intraday though, markets added slightly more on the back of headlines suggesting that ECB's Vujcic said that once rates cuts starts, 50bp cuts cannot be excluded. Looking at the details though, he said that in his view they move in 25bp steps in an ideal world, which the media headline did not reflect. Yesterday afternoon, Fed's Mester said that a March rate cut is probably too early. Upon announcement of the 4.229% yield of yesterday's 30y 21bn UST supply, 30y yields reacted with a 5bp rally. Tonight, Austria and Sweden are up for a review by DBRS.
FX: Yesterday proved another quiet session in FX markets. The CPI-induced rally in USD was short-lived and EUR/USD remains within the 1.09-1.10 range. SEK traded slightly on the back-foot with EUR/SEK moving above the 11.25-level which contributed to lifting NOK/SEK back closer to parity amid NOK staying little changed. The recent JPY sell-off eased yesterday with USD/JPY now trading just above 145 but still more than 4 figures higher compared to new year.