
Sample Category Title
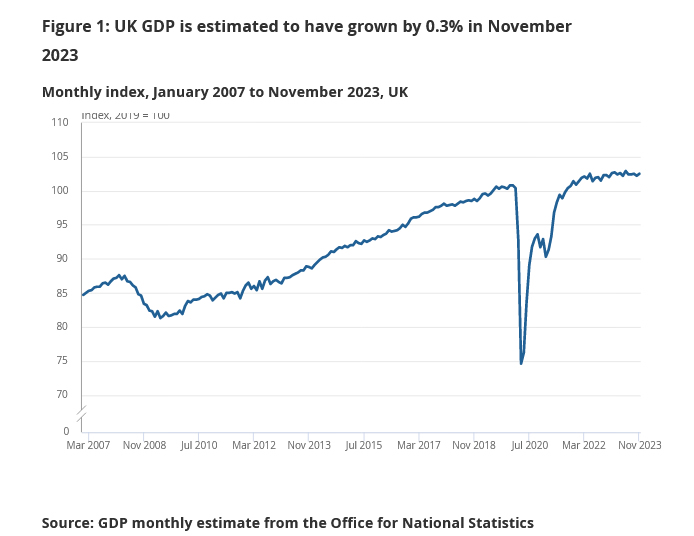
UK GDP grew 0.3% mom in Nov, but down -0.2% in the three month period
UK GDP grew 0.3% mom in November, above expectation of 0.2% mom. Services output rose 0.4% mom. Production output grew 0.3% mom. Construction sector fell-0.2% mom.
However, in the three months to November, GDP fell -0.2% compared with the prior three months period to August. Services showed no growth, production output fell by -1.5% and construction fell by -0.6% over the same period.
US CPI Bounce Goes Unheard, Focus on Bank Earnings
Yesterday’s US inflation report wasn’t exactly ideal. The headline inflation rose more than expected to 3.4% from 3.1% printed a month earlier. Shelter, electricity, and food prices drove the overall CPI index higher in December. Especially, the shelter costs increased by more than 6%. But if you don’t count food and energy price inflation, core inflation eased to 3.9% during the same month. And well, if you start getting the shelter cost off the calculation, the numbers were quite good. Of course, the metrics that disregard food, energy and shelter prices – like the core and supercore inflation – make little sense to Mr. and Ms. Everyone, as everyone eats, everyone uses energy and everyone needs a shelter. Yet, for the Federal Reserve (Fed), these items have volatile prices, so they prefer looking past these important categories. While doing so, inflation eased. Also, note that a rise in car prices also added to the inflationary pressures last month. But their weight is lower in the calculation of the PCE index. That’s why the Fed’s favourite inflation gauge – the PCE index which will be released by the end of the month - will likely be trending closer to the 2% target.
But all in all, yesterday’s inflation report was less than ideal, and the market reaction was mixed. The US 2 and 10-year first rose then fell, whereas you would expect a swift shift in dovish Fed expectations following a bigger-than-expected jump in US headline inflation. The equities were up and down, and the S&P500 closed the session very slightly in the negative while Nasdaq eked out even a small gain at yesterday’s close.
Disinflation remains the base case scenario for this year, housing costs are expected to fall – at some point – and that could counterweight the rising shipping costs caused by the Red Sea tensions and low water levels in the Panama Canal that also threaten food deflation that we saw last year. Yet some hawkish voices are rising at the Fed, at the start of this year. Fed’s Loretta Mester said that it’s probably too early to cut rates. Mr. Barkin also repeated that he’s looking for more evidence that inflation is headed toward the 2% target.
But it’s obvious that investors are not willing to trade the bad smell for now.
The US dollar index is under pressure after yet a stronger-than-expected inflation report, the EURUSD rebounded lower after hitting the 1.10 mark, as the euro bulls, or the dollar bears found no reasonable conviction to carry the rally above the 1.10 mark, and gold rebounded after hitting the 50-DMA, near $2013 per ounce. Activity on Fed funds futures still gives more than 70% chance for the first Fed rate hike to happen in March. But the Fed won’t find enough evidence that inflation will ease toward the 2% target as early as March. Consequently, there should be a readjustment in market expectations, and we will see the stock and bond prices make a corrective move to the downside.
Earnings season kicks off
Over the next few weeks, attention will be directed toward company earnings, and we will start digesting the earnings starting from the financial sector. The SPDR’s financials closed last year with more than a 20% rally thanks to optimism that the Fed would start cutting the interest rates sooner rather than later. The massive rebound in US long-term papers had a substantial positive impact on their balance sheets. Yet expectations for the US banks are not necessarily positive. First, the banks are expected to announce a 21% decline in their profits compared to the same period last year, as a result of higher costs to attract and maintain deposits in an environment of high inflation and higher Fed rates. Then, credit card delinquencies continue to rise. US consumer spending remained robust yet … people are not buying stuff that they can afford. The bad loans are therefore expected to be on the rise. On the corporate side, investment banking revenues will likely remain weak given that the M&A activity was subdued last year. And well, if the Fed starts cutting the interest rates and the economy slows, the banks will start seeing their net profit margin shrink. Therefore, the FactSet projections indicate that the S&P500’s financial sector could reveal the 4th highest yoy earnings decline among all 11 sectors for Q4, with an estimated downturn of -3.1%. If that’s the case, a correction in the S&P500 financials would only make sense after a more than 20% rally recorded in just two months. Anyway, I stop here and let the bank earnings tell the story.
Same story, different day
In energy, crude oil rebounded 2% yesterday and is better bid this morning on the back of rising tensions in the Red Sea. This time the news that Iran captured an oil tanker off the cost of Oman is pushing prices higher. Yet the Red Sea tensions have so far been insufficient to push the price of a barrel sustainably higher. Therefore, price rallies into and above the $75pb level could be interesting top selling opportunities for those willing to see the price of a barrel fall below the $70pb level.
On the corporate level, consolidation in the US energy sector is now shifting toward the nat gas companies. Chesapeake Energy agreed to merge with Southwestern Energy Company in an all-stock transaction worth $7.4bn. Chesapeake’s price rose 3% while Southwestern Energy lost 2.5%, and efficiencies could support a further correction for Chesapeake.
Nat gas futures have been rising in the US, yet the European TTF futures continue to fall despite snow and harsh winter weather. It is because the European gas storage is so full that some say that winter is already over in the gas market.
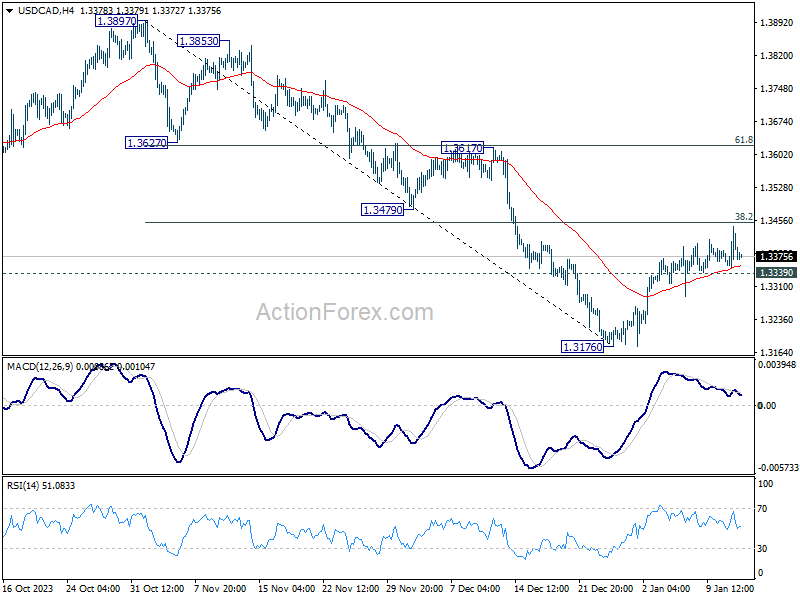
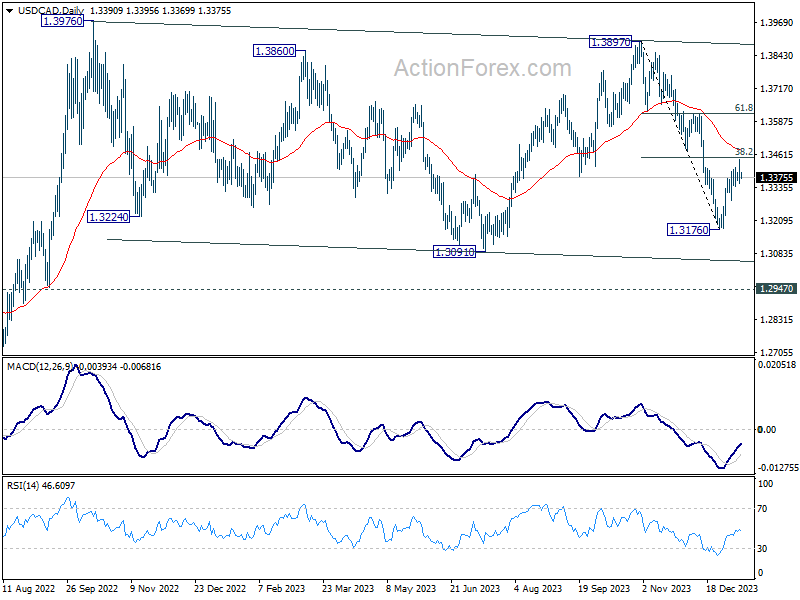
USD/CAD Daily Outlook
Daily Pivots: (S1) 1.3349; (P) 1.3396; (R1) 1.3441; More...
While USD/CAD continues to lose upside momentum, as seen in 4H MACD, further rally is in favor to 38.2% retracement of 1.3897 to 1.3176 at 1.3451. Firm break there will pave the way to 61.8% retracement at 1.3622. On the downside, however, break of 1.3339 minor support will turn bias back to the downside for 1.3176 low instead.
In the bigger picture, price actions from 1.3976 (2022 high) are viewed as a corrective pattern only. While fall from 1.3897 could still extend through 1.3091, strong support should emerge above 1.2947 resistance turned support to bring rebound. Overall, larger up trend from 1.2005 (2021 low) is still expected to resume at a later stage.
AUD/USD Daily Report
Daily Pivots: (S1) 0.6648; (P) 0.6687; (R1) 0.6727; More...
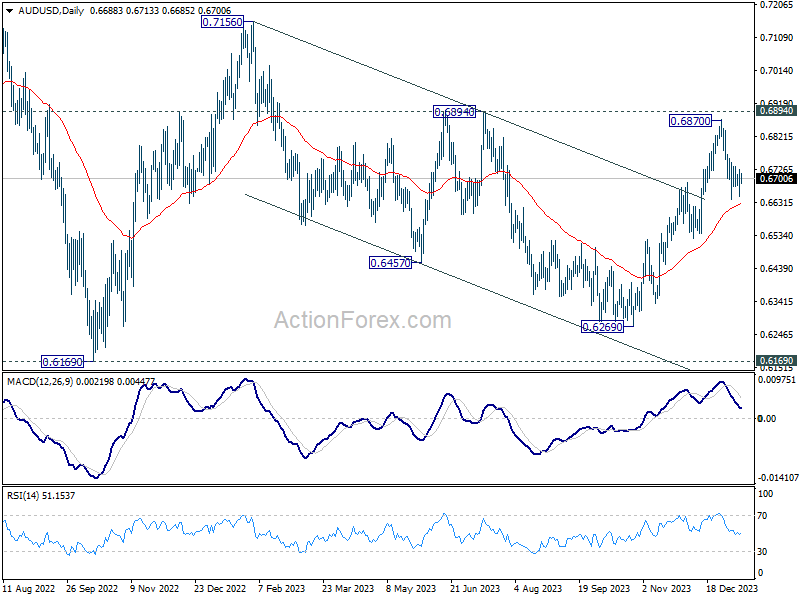
AUD/USD is staying in range above 0.6639 and intraday bias remains neutral. On the downside, break of 0.6639 will resume the fall from 0.6870 short term top to 0.6541 support next. On the upside, though, break of 0.6759 minor resistance will suggest that the pull back has completed already. Intraday bias will be turned back to the upside for 0.6870 resistance.
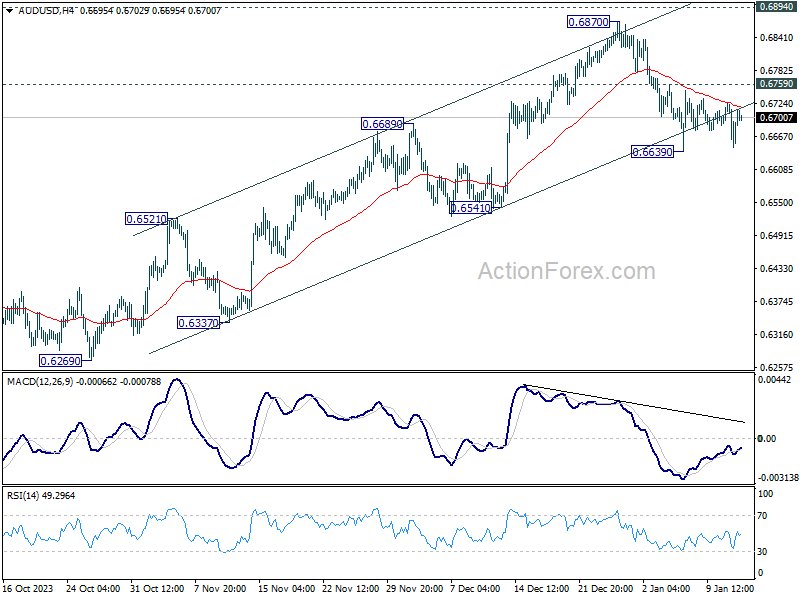
In the bigger picture, price actions from 0.6169 (2022 low) could be just a medium term corrective pattern to the down trend from 0.8006 (2021 high). Rise from 0.6269 is seen as the third leg of the pattern that could target 0.7156 on break of 0.6894 resistance. For now, range trading should be seen between 0.6169 and 0.7156 (2023 high), until further developments.
USD/JPY Daily Outlook
Daily Pivots: (S1) 144.81; (P) 145.61; (R1) 146.08; More...
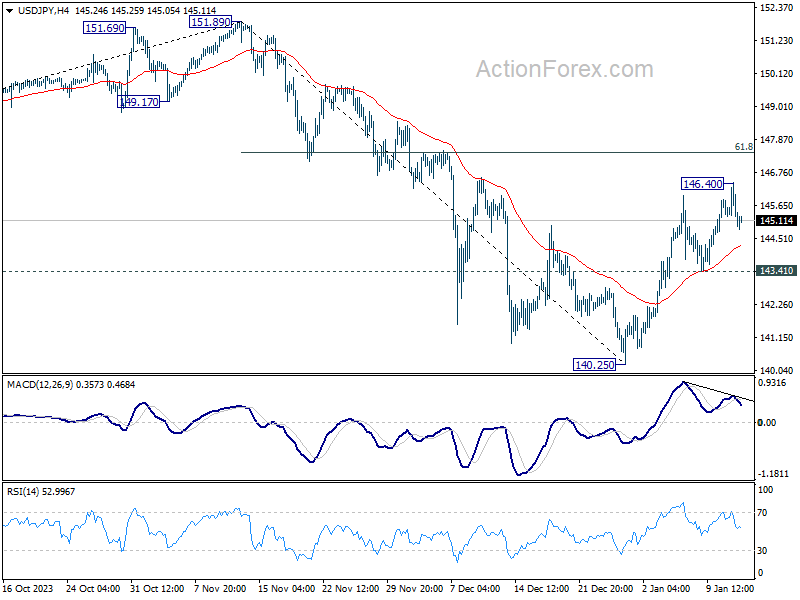
USD/JPY retreated after edging higher to 146.40 and intraday bias is turned neutral again. On the upside above 146.40 will resume the rebound from 140.25 to 61.8% retracement of 151.89 to 140.25 at 147.44. Upside should be limited there to bring reversal. On the downside, break of 143.41 will turn bias back to the downside for retesting 140.25 low.
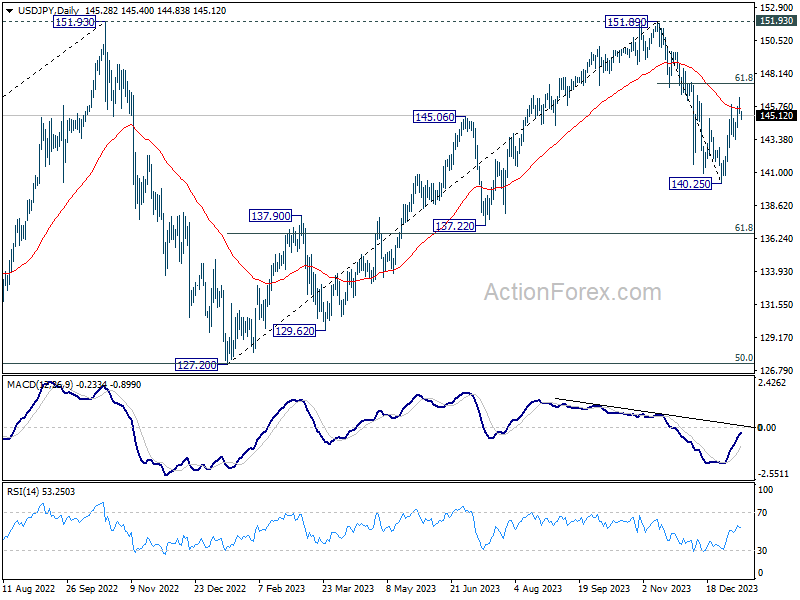
In the bigger picture, for now, fall from 151.89 is still seen as the third leg of the corrective pattern from 151.89. Another decline through 140.25 will target 61.8% retracement of 127.20 to 151.89 at 136.63. Sustained break there will pave the way to 127.20 support (2022 low). However, firm break of 147.44 fibonacci resistance will dampen this view and bring retest of 151.89 instead.
USD/CHF Daily Outlook
Daily Pivots: (S1) 0.8498; (P) 0.8518; (R1) 0.8528; More....
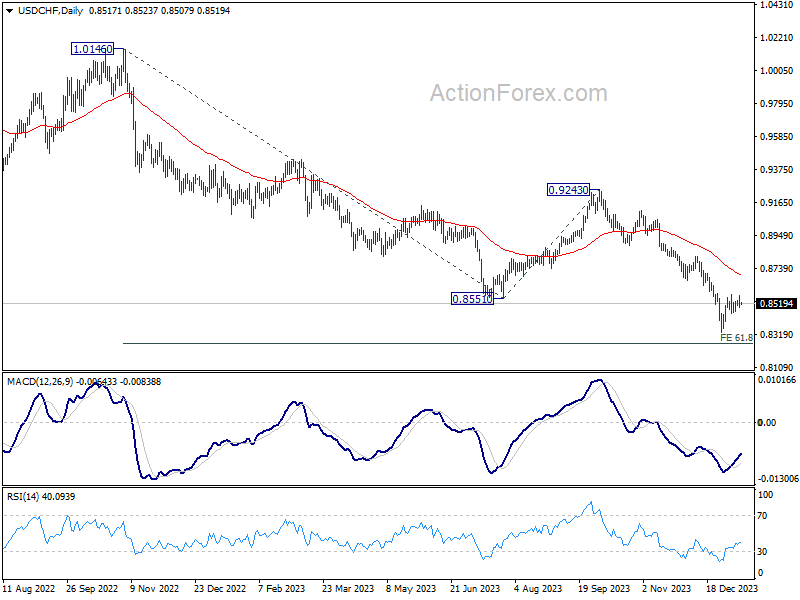
Intraday bias in USD/CHF remains neutral and outlook is unchanged. Consolidation from 0.8332 is extending and stronger recovery cannot be ruled out. But outlook will stay bearish as long as 0.8665 support turned resistance holds. On the downside, break of 0.8332 will resume larger fall from 0.9243 to 0.8257 projection level.

In the bigger picture, the down trend from 1.0146 (2022 high) is in progress. Next target is 61.8% retracement of 1.0146 to 0.8551 from 0.9243 at 0.8257. Sustained break there could prompt downside acceleration to 100% projection at 0.7648. This will now remain the favored case as long as 0.8819 resistance holds.
GBP/USD Daily Outlook
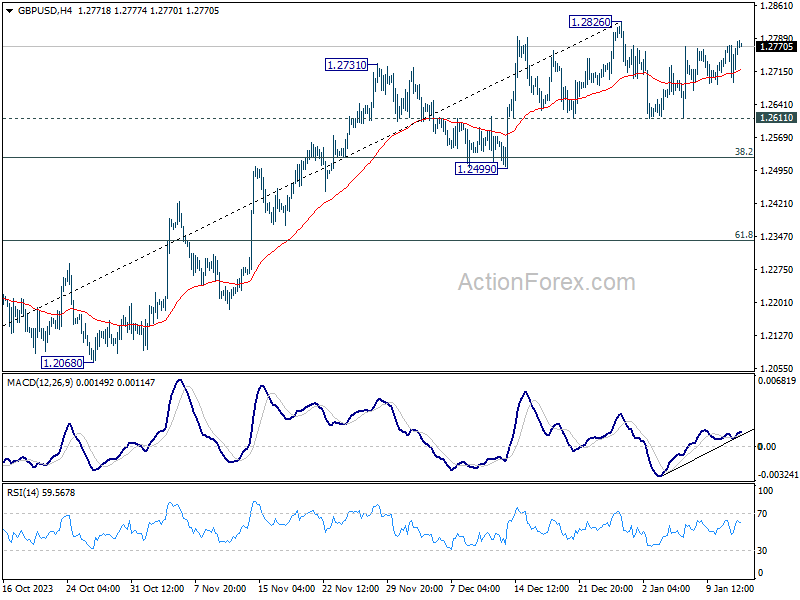
Daily Pivots: (S1) 1.2711; (P) 1.2742; (R1) 1.2795; More...
GBP/USD is staying in range below 1.2826 and intraday bias remains neutral at this point. On the upside, decisive break of 1.2826 high will resume whole rally from 1.2036. Nevertheless, break of 1.2611 will bring deeper correction to 1.2499 support instead.
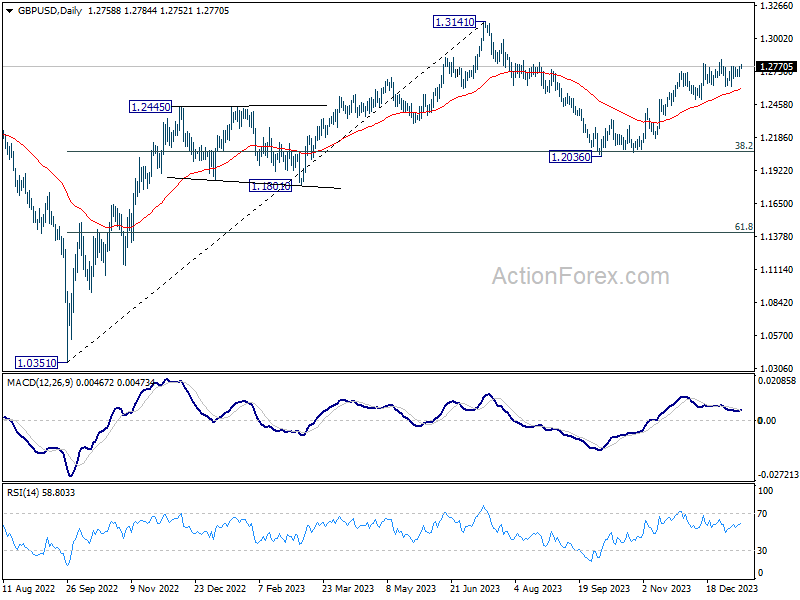
In the bigger picture, price actions from 1.3141 medium term top are seen as a corrective pattern to up trend from 1.0351 (2022 low). Rise from 1.2036 is seen as the second leg that's in progress. Upside should be limited by 1.3141 to bring the third leg of the pattern. Meanwhile, break of 1.2499 support will argue that the third leg has already started for 38.2% retracement of 1.0351 (2022 low) to 1.3141 at 1.2075 again.
Silver (XAGUSD) Remains Sideways
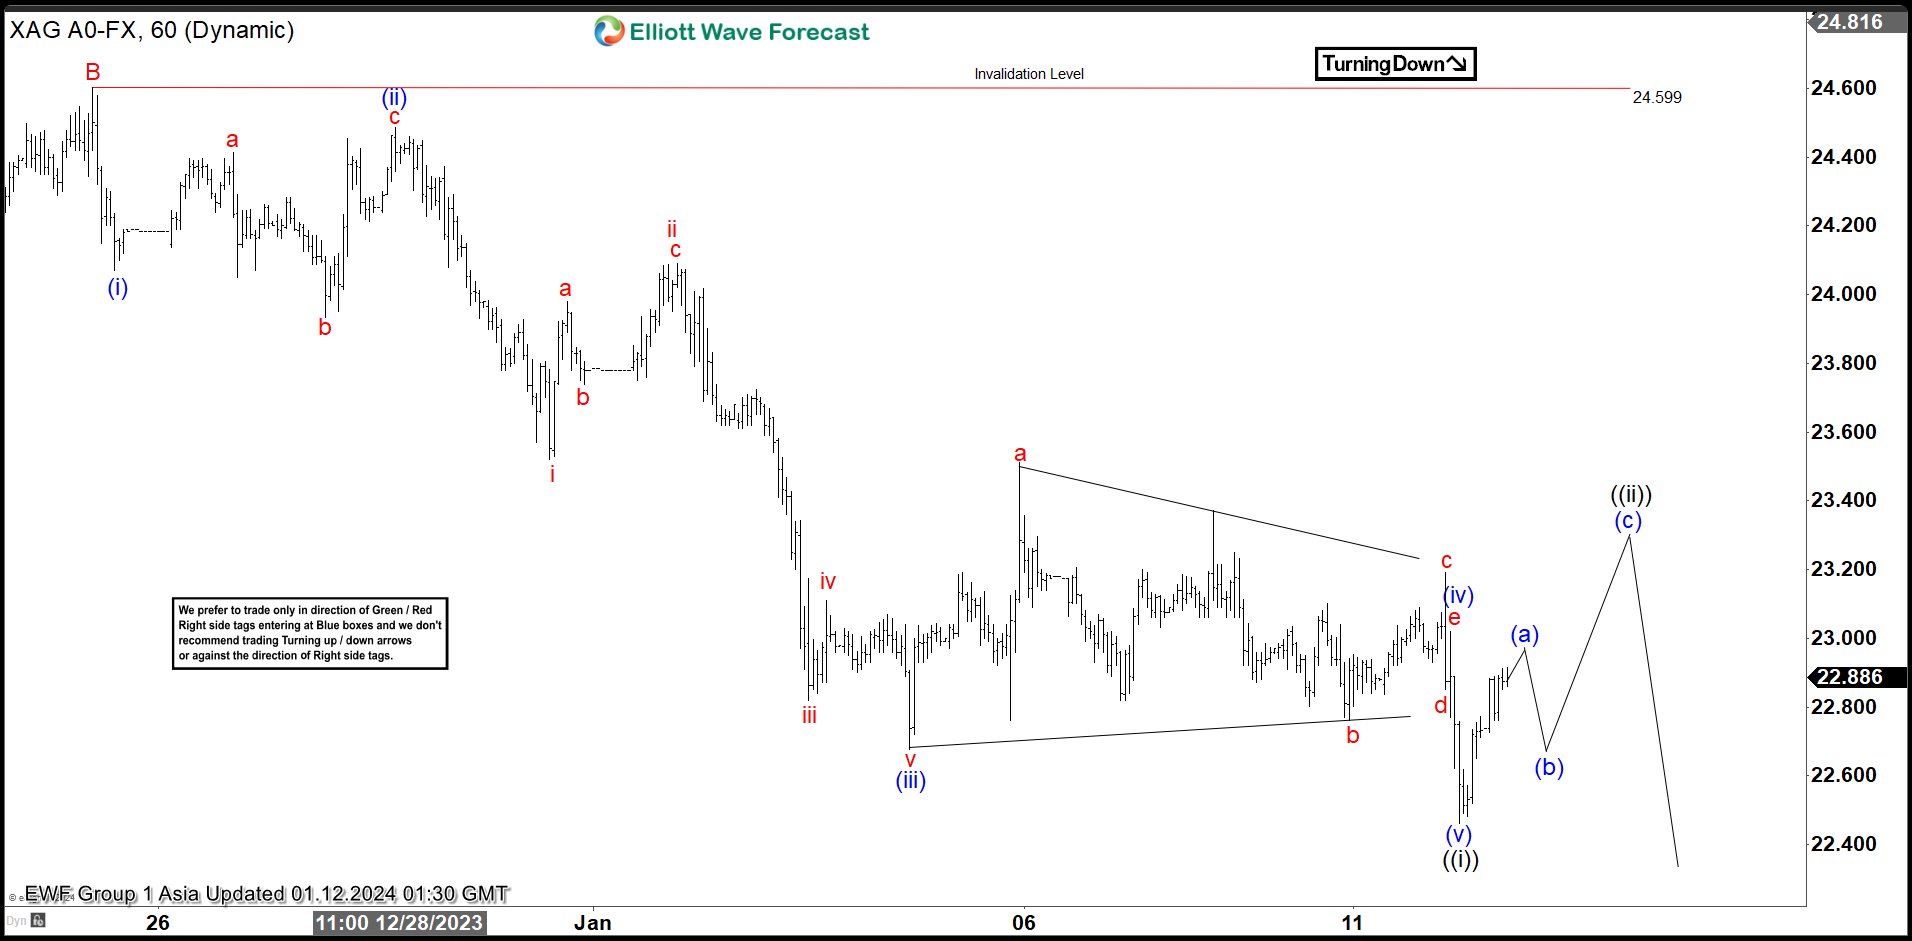
Short Term Elliott Wave view in Silver (XAGUSD) suggests that the metal shows a bearish sequence from 12.4.2023 high. The decline from 12.4.2023 high is unfolding as a zigzag Elliott Wave structure. Down from 12.4.2023 high, wave A ended at 22.49 and wave B rally ended at 24.6. The metal resumes lower in wave C which subdivides into a 5 waves impulsive structure.
Down from wave B, wave (i) ended at 24.07 and wave (ii) ended at 24.48. The metal then resumes lower in wave (iii) towards 22.67. Wave (iv) ended at 23.02 with internal subdivision as a triangle. Final leg wave (v) ended at 22.46 which completed wave ((i)) of C in higher degree. Rally in wave ((ii)) of C is in progress as a zigzag structure. Up from wave ((i)), expect the metal to extend higher to end the first leg wave (a) of the zigzag. Then it should pullback in wave (b) before turning higher again in wave (c) to complete wave ((ii)). Near term, as far as pivot at 24.6 high stays intact, expect rally to fail in 3, 7, or 11 swing for further downside.
Silver (XAGUSD) 60 Minutes Elliott Wave Chart
XAGUSD Elliott Wave Video
https://www.youtube.com/watch?v=E6GFGF9VVkY
EUR/USD Daily Outlook
Daily Pivots: (S1) 1.0936; (P) 1.0967; (R1) 1.1005; More...
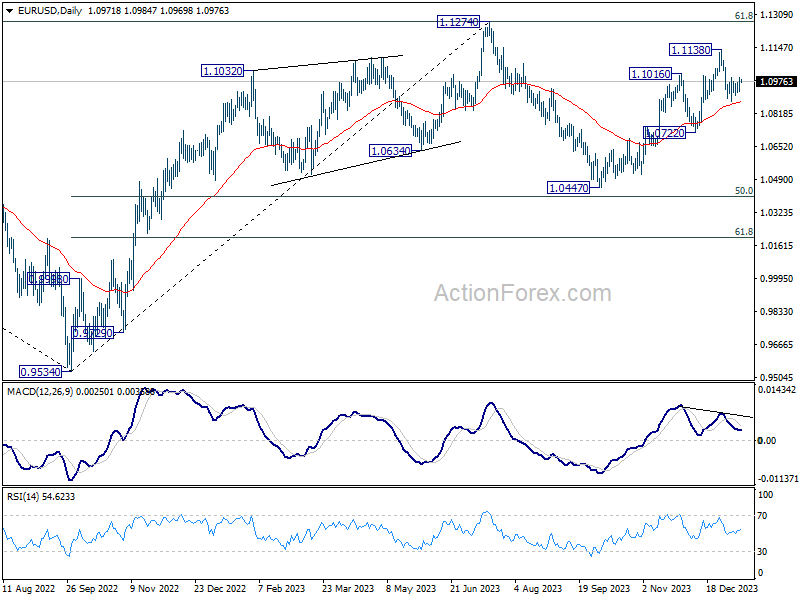
Range trading continues in EUR/USD and intraday bias remains neutral. On the downside break of 1.0876 will resume the fall from 1.1138 short term top to 1.0722 support next. However, break of 1.0997 will turn bias back to the upside for retesting 1.1138 high instead.
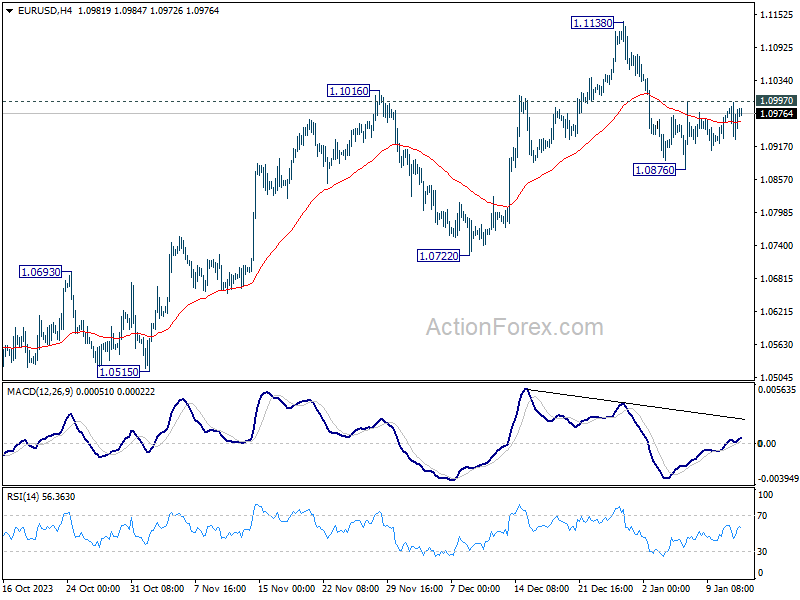
In the bigger picture, price actions from 1.1274 are viewed as a corrective pattern to rise from 0.9534 (2022 low). Rise from 1.0447 is seen as the second leg. While further rally could cannot be ruled out, upside should be limited by 1.1274 to bring the third leg of the pattern. Meanwhile, sustained break of 1.0722 support will argue that the third leg has already started for 1.0447 and below.
Sterling Leads the Week Ahead of UK GDP, Dollar Sluggish
Dollar's fleeting post-CPI rally was very short-lived. The greenback quickly reversed its initial gains and has since been trading within a narrow range against other major currencies. Traders appear relatively unfazed by the stronger than expected inflation readings, with markets still pricing in more than 70% chance on Fed cutting interest rate in March.
This scenario reveals a pattern where Dollar briefly reacts to upside surprises in economic data, such as the non-farm payroll and CPI data. It seems likely that this trend of transient responses to Dollar-favorable economic indicators might persist for a while, probably through the rest of the month.
In the broader currency market, Sterling has distinguished itself as the strongest performer of the week, closely followed by Euro. Pound is eyeing today's UK GDP data as a potential catalyst for further rallying. Dollar, while not leading the pack, still holds its ground as the third strongest currency for the week.
Conversely, Japanese Yen finds itself at the bottom of the performance ladder, emerging as the weakest among its peers. Australian Dollar is the second worst, showing limited responses to economic data from China. Swiss Franc, meanwhile, is under pressure against its European peers, ranking as the third weakest currency.
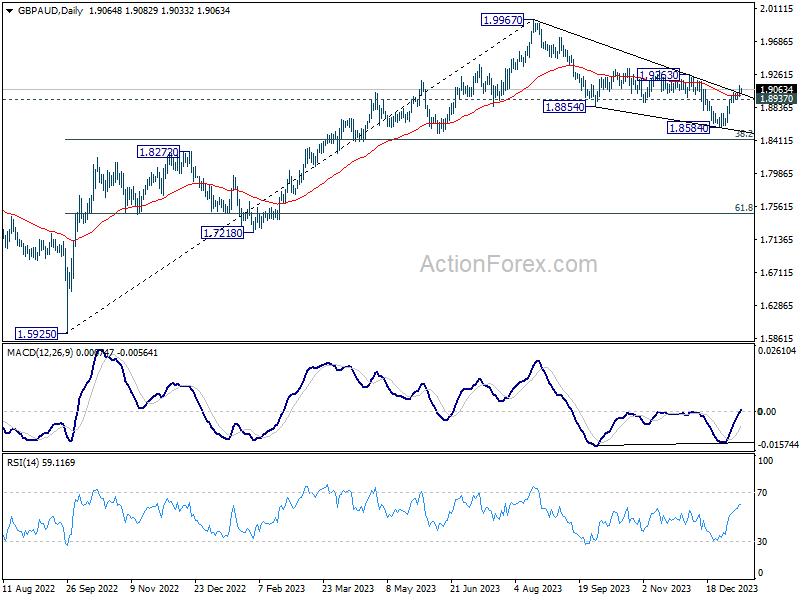
Technically, GBP/AUD's rebound from 1.8584 extended higher this week. The break of falling trendline resistance strengthen the bullish case that correction from 1.9976 has completed with three waves down to 1.8584. Further rally is expected as long as 1.8937 support holds, to 1.9263 resistance. Decisive break there will pave the way to retest 1.9967 high.
In Asia, at the time of writing, Nikkei is up 1.32%. Hong Kong HSI is down -0.03%. China Shanghai SSE is up 0.14%. Singapore Strait Times is down -0.35%. Japan 10-year JGB yield is down -0.0136 at 0.592. Overnight, DOW rose 0.04%. S&P 500 fell -0.07%. NASDAQ rose 0.00%. 10-year yield fell -0.053 to 3.977.
Fed's Mester: March too early for rate cut, inflation fight continues
Cleveland Fed President Loretta Mester, in an interview with BloombergTV overnight, emphasized that March might be too soon to consider a rate cut, citing ongoing efforts to combat inflation.
Mester expressed her view that more evidence is needed before considering a reduction in interest rates. "March is probably too early in my estimation for a rate decline because I think we need to see some more evidence," she stated,
The December CPI report released yesterday, according to her, is a clear indication that "there is more work to do," necessitating the maintenance of restrictive monetary policy. Nevertheless, she reassured that the CPI report does not suggest progress in inflation stall out.
Mester also pointed out that the risks associated with monetary policy have become more balanced. The primary focus for this year, as she outlined, is to calibrate policy effectively to maintain healthy labor markets while continuing the process of bringing inflation back to the 2% target.
Fed's Barkin watching goods-services cost divide
Richmond Fed President Thomas Barkin told reporters after a speech overnight that the December CPI report was "about as expected. He noted a deceleration in the price rise for goods, while shelter and services costs continue to escalate at a more robust pace.
Barkin highlighted the growing disparity between the costs of goods versus shelter and services. He expressed caution about this divide, emphasizing the importance of vigilance in this area.
"This gap between services and shelter and goods is one that I am watching carefully," he stated. His concern is rooted in the potential consequences of a shift from deflationary cycle in goods to a scenario where the economy is predominantly burdened by the rising costs of shelter and services.
"You would not want a goods deflationary cycle to end and find yourself disproportionately bearing the cost of shelter and services," Barkin said.
Fed's Goolsbee: January too soon for committing to future rate cuts
Chicago Fed Austan Goolsbee has highlighted the critical role of ongoing inflation data in shaping Fed's future interest rate decisions. In an interview with Reuters, Goolsbee underlined that it is premature to make definitive decisions about rate adjustments at this juncture.
Goolsbee's said, "I still think that the primary determinant of when and how much rates should be cut will be driven off what's happening to the inflation data, and are we meeting the mandate goals."
He also emphasized the importance of not rushing into policy decisions based on incomplete data sets. "When we have weeks or months of data to come, I don't like tying our hands ... We don't make decisions about March, June, and whatever, in January," he remarked.
Regarding the December CPI reading, Goolsbee noted that it was largely in line with expectations. However, he observed some variations within the data, specifically mentioning that services inflation was cooler than anticipated, while housing inflation was slightly higher.
China's CPI improved to -0.3%, deflation persists for the 3rd month
China's CPI rose from -0.5% yoy to -0.3% yoy in December, better than expectation of -0.4% yoy. That's nonetheless the third concective month of negative reading. On a month-on-month basis, the CPI increased by 0.1% , versus -0.5% decline in November. Core CPI, which excludes volatile food and energy prices was at 0.6% yoy, unchanged from November.
NBS said pork prices, the main factor impacting year-on-year CPI, fell -26.1% yoy, narrowed from -31.8% yoyin November. Services inflation, however, rose steadily with tourism and hotel accommodation prices increasing by 6.8% yoy and 5.5% yoy, respectively.
PPI rose from -3.0% yoy to -2.7% yoy, worse than expectation of -2.5% yoy. That's the 15th straight month of decline. NBS said the PPI decline was affected by factors including declining international prices of oil and insufficient demand for some industrial products.
China's exports rise 2.3% yoy in Dec, down to US, EU and ASEAN
In December, China's exports increased by 2.3% yoy to USD 303.6B, surpassing expectation of 1.7%. However, this growth was not uniform across all regions. Notably, shipments to US saw a significant decline of -6.89% yoy. Similarly, exports to EU and ASEAN countries also dropped, by -1.93% yoy and -6.14% yoy respectively.
On the import front, China experienced a marginal increase of 0.2% yoy to USD 228.2B, which was slightly below the expected 0.3% yoy growth. Consequently, trade surplus widened from USD 68.3B to USD 75.3B, which was above the anticipated USD 74.8B.
For the entire year of 2023, China's trade figures painted a scenario of contraction. Exports decreased by -4.6% to USD 3.38T, while imports saw -5.5% contraction to USD 2.56T.
Looking ahead
UK GDP is a major focus in European session while production and trade balance will be released. Later in the day, US PPI will be featured.
EUR/USD Daily Outlook
Daily Pivots: (S1) 1.0936; (P) 1.0967; (R1) 1.1005; More...
Range trading continues in EUR/USD and intraday bias remains neutral. On the downside break of 1.0876 will resume the fall from 1.1138 short term top to 1.0722 support next. However, break of 1.0997 will turn bias back to the upside for retesting 1.1138 high instead.
In the bigger picture, price actions from 1.1274 are viewed as a corrective pattern to rise from 0.9534 (2022 low). Rise from 1.0447 is seen as the second leg. While further rally could cannot be ruled out, upside should be limited by 1.1274 to bring the third leg of the pattern. Meanwhile, sustained break of 1.0722 support will argue that the third leg has already started for 1.0447 and below.
Economic Indicators Update
| GMT | Ccy | Events | Actual | Forecast | Previous | Revised |
|---|---|---|---|---|---|---|
| 23:50 | JPY | Bank Lending Y/Y Dec | 3.10% | 2.70% | 2.80% | |
| 23:50 | JPY | Current Account (JPY) Nov | 1.89T | 2.18T | 2.62T | |
| 01:30 | CNY | CPI Y/Y Dec | -0.30% | -0.40% | -0.50% | |
| 01:30 | CNY | PPI Y/Y Dec | -2.70% | -2.50% | -3.00% | |
| 02:30 | CNY | Trade balance (USD) Dec | 75.34B | 74.75B | 68.39B | |
| 02:30 | CNY | Exports Y/Y Dec | 2.30% | 1.70% | 0.50% | |
| 02:30 | CNY | Imports Y/Y Dec | 0.20% | 0.30% | -0.60% | |
| 05:00 | JPY | Eco Watchers Survey: Current Dec | 50.7 | 49.9 | 49.5 | |
| 07:00 | GBP | GDP M/M Nov | 0.20% | -0.30% | ||
| 07:00 | GBP | Industrial Production M/M Nov | 0.10% | -0.80% | ||
| 07:00 | GBP | Manufacturing Production Y/Y Nov | 1.70% | 0.80% | ||
| 07:00 | GBP | Manufacturing Production M/M Nov | 0.30% | -1.10% | ||
| 07:00 | GBP | Industrial Production Y/Y Nov | 0.70% | 0.40% | ||
| 07:00 | GBP | Goods Trade Balance (GBP) Nov | -15.7B | -17.0B | ||
| 07:45 | EUR | France Consumer Spending M/M Nov | 0.00% | -0.90% | ||
| 13:00 | GBP | NIESR GDP Estimate (3M) Dec | -0.10% | |||
| 13:30 | USD | PPI M/M Dec | 0.10% | 0.00% | ||
| 13:30 | USD | PPI Y/Y Dec | 1.30% | 0.90% | ||
| 13:30 | USD | PPI Core M/M Dec | 0.20% | 0.00% | ||
| 13:30 | USD | PPI Core Y/Y Dec | 2.00% | 2.00% |