
Sample Category Title
EURCHF Bulls Could Find An Opening
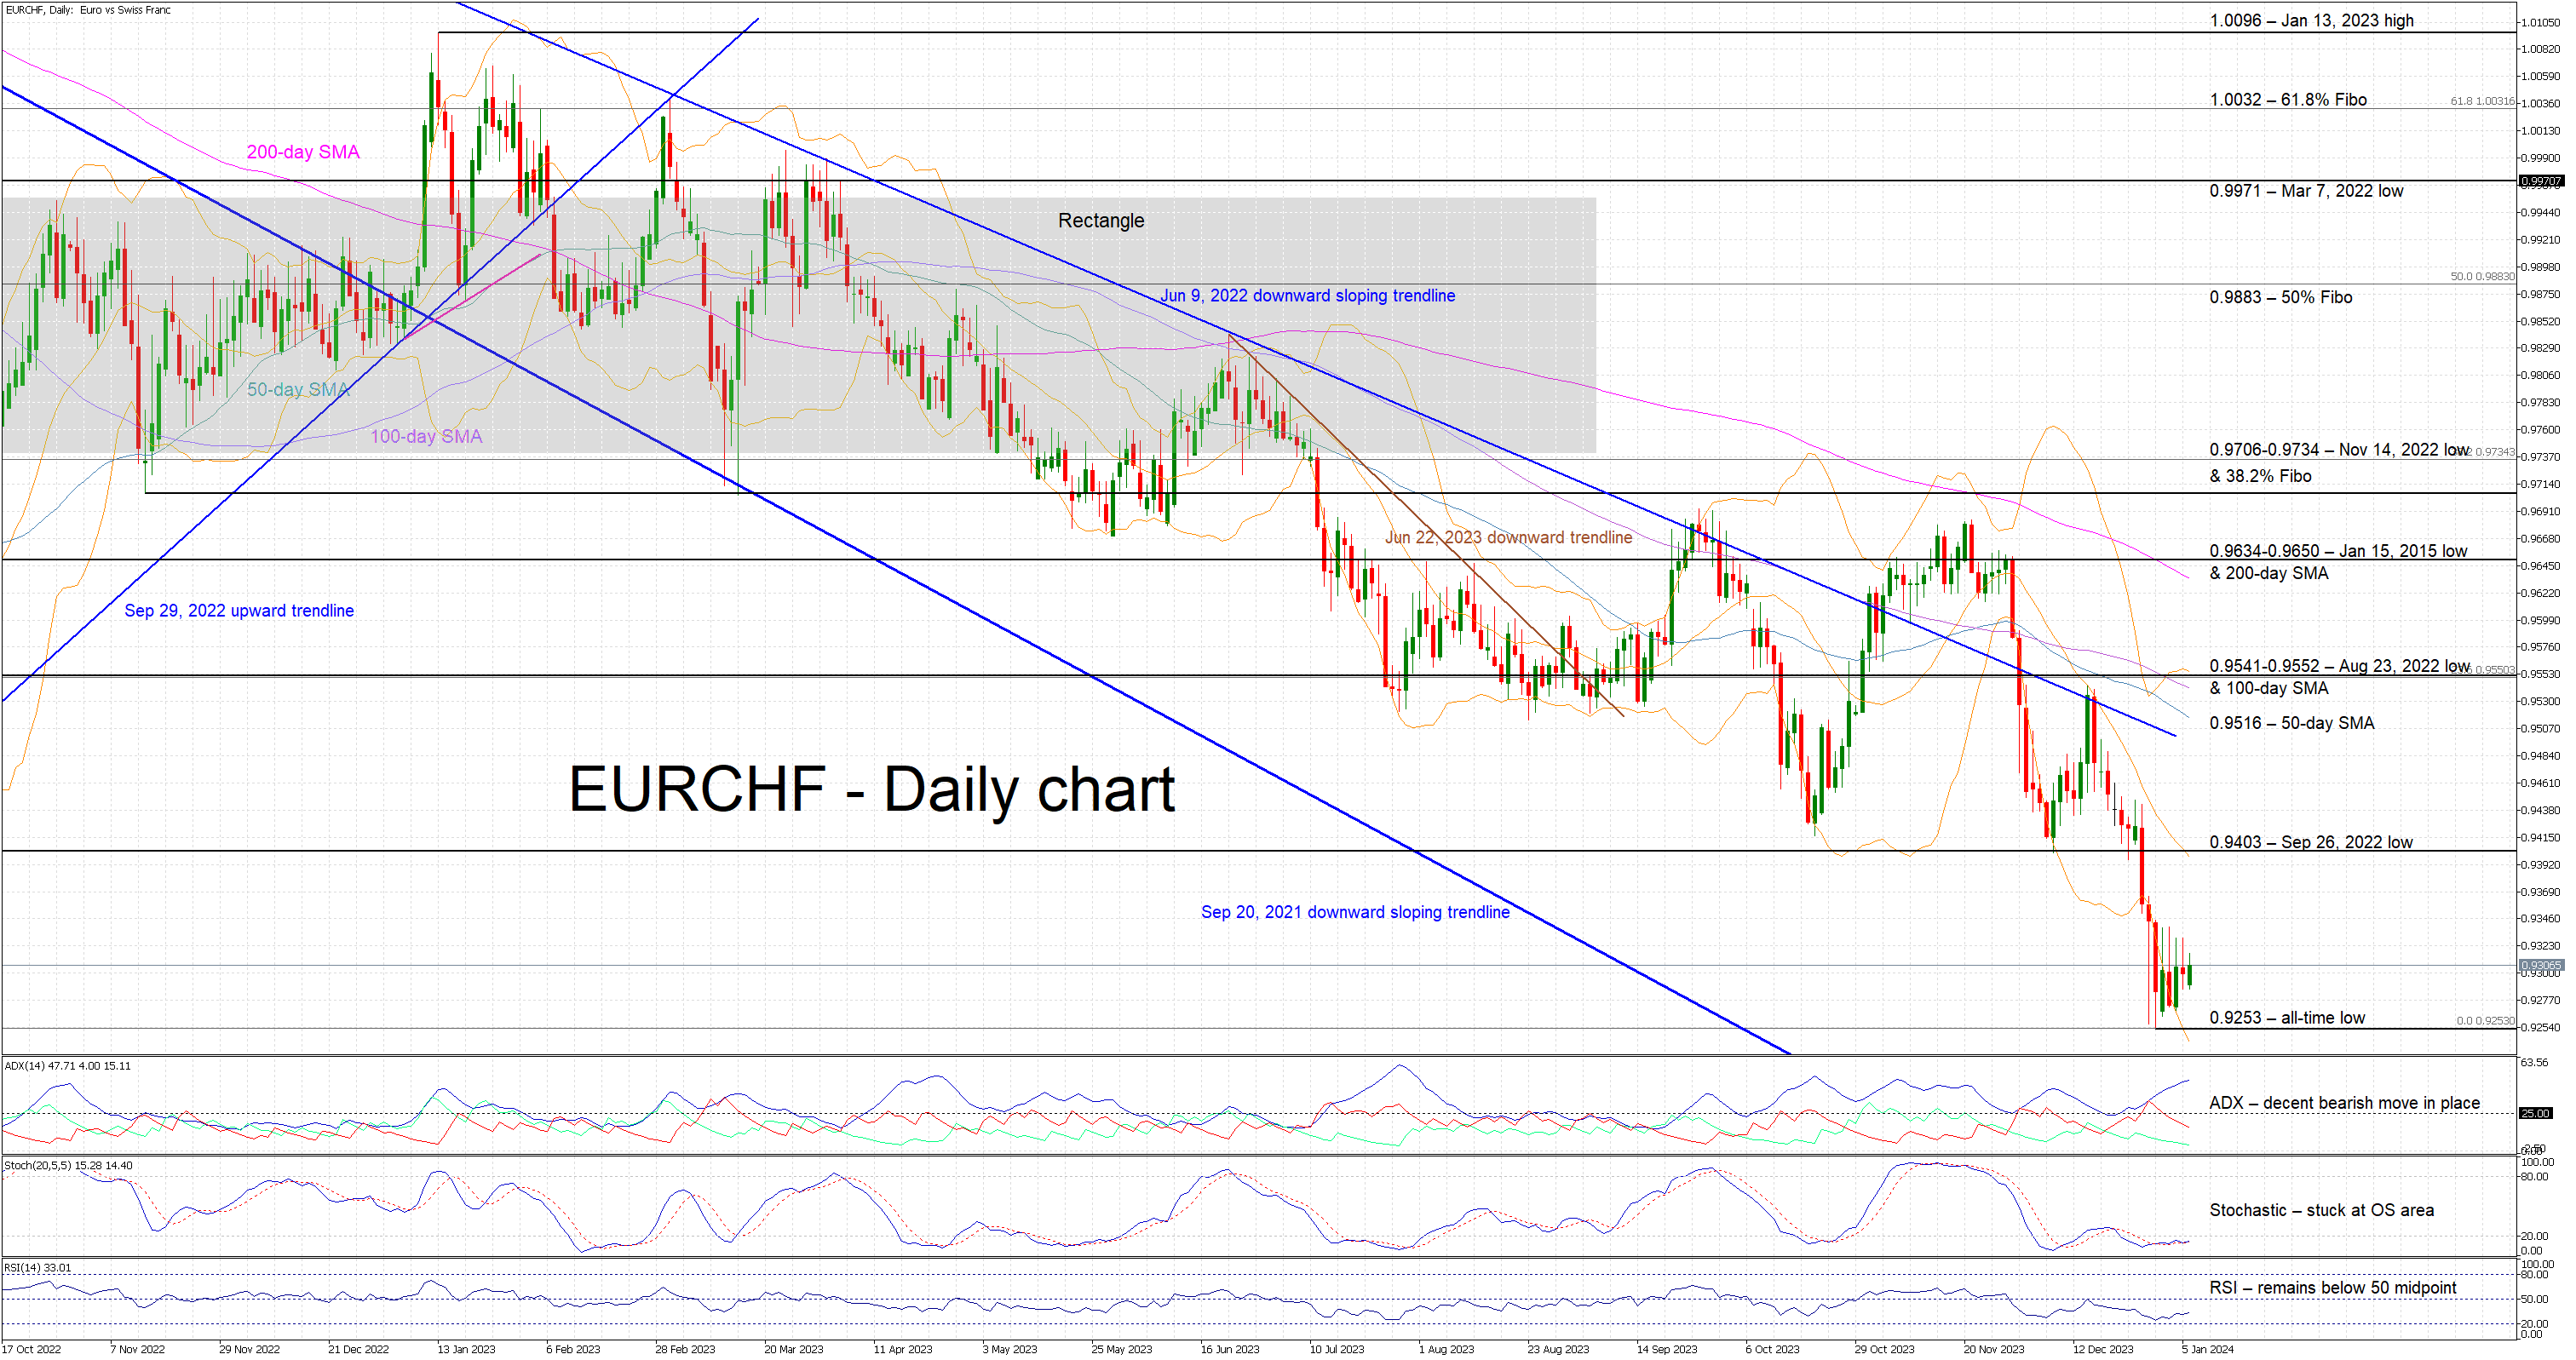
- EURCHF trades a tad above its all-time low of 0.9235
- Euro bulls are trying to regain market control and limit their losses
- Momentum indicators could open the door for a rebound
EURCHF is edging higher today but trades very close to its all-time low of 0.9235 recorded on December 29, 2023 with the recent series of lower lows and lower highs remaining intact. Euro bulls are trying to recover part of their significant 6% losses recorded during 2023, but they appear unable to regain market control and push EURCHF towards the 0.9403 area.
The momentum indicators could hold the key to a possible upleg. In more detail, the Average Directional Movement Index (ADX) is edging higher, but the downwards move of the D- indicator could mean that the current sell-off has run its course. Additionally, the RSI remains below its 50-midpoint and thus confirming the current bearish pressure. Interestingly, the stochastic oscillator is still hovering at its oversold (OS) territory, battling with its moving average. Should it manage to break above its OS, it would be seen as a strong bullish signal.
If the bulls become more confident, they could try to lead EURCHF higher towards the September 26, 2002 low at 0.9403. It might not be a one-way street move higher, but if successful, the bulls could then have a go at gradually testing the resistance set by the June 9, 2022 downward sloping trendline and the 50-day simple average (SMA) at 0.9516.
On the flip side, the bears are probably enjoying their hard-earned gains and could possibly be taking a breather at this stage. They could try to push EURCHF lower towards its recent low at 0.9235 and then be given the chance to record a new all-time low, with 0.9200 looking like the next plausible target.
To sum up, the bearish trend remains in place, but the bulls could have the chance to stage a rebound if the momentum indicators turn in their favour soon.
Dow Futures (YM_F) Elliott Wave Forecasting The Path
Hello fellow traders. In this technical article we’re going to take a look at the Elliott Wave charts charts of Dow Futures ($YM_F ) published in members area of the website. As our members know YM_F we see cycle from the 32406 low completed at the 38115 peak. While below that level, we could be getting a deeper correction. Recently, the futures reached the intraday equal legs from the 38115 peak and made 3 waves bounce as expected. In further text we’re going to explain the Elliott Wave pattern and forecast.
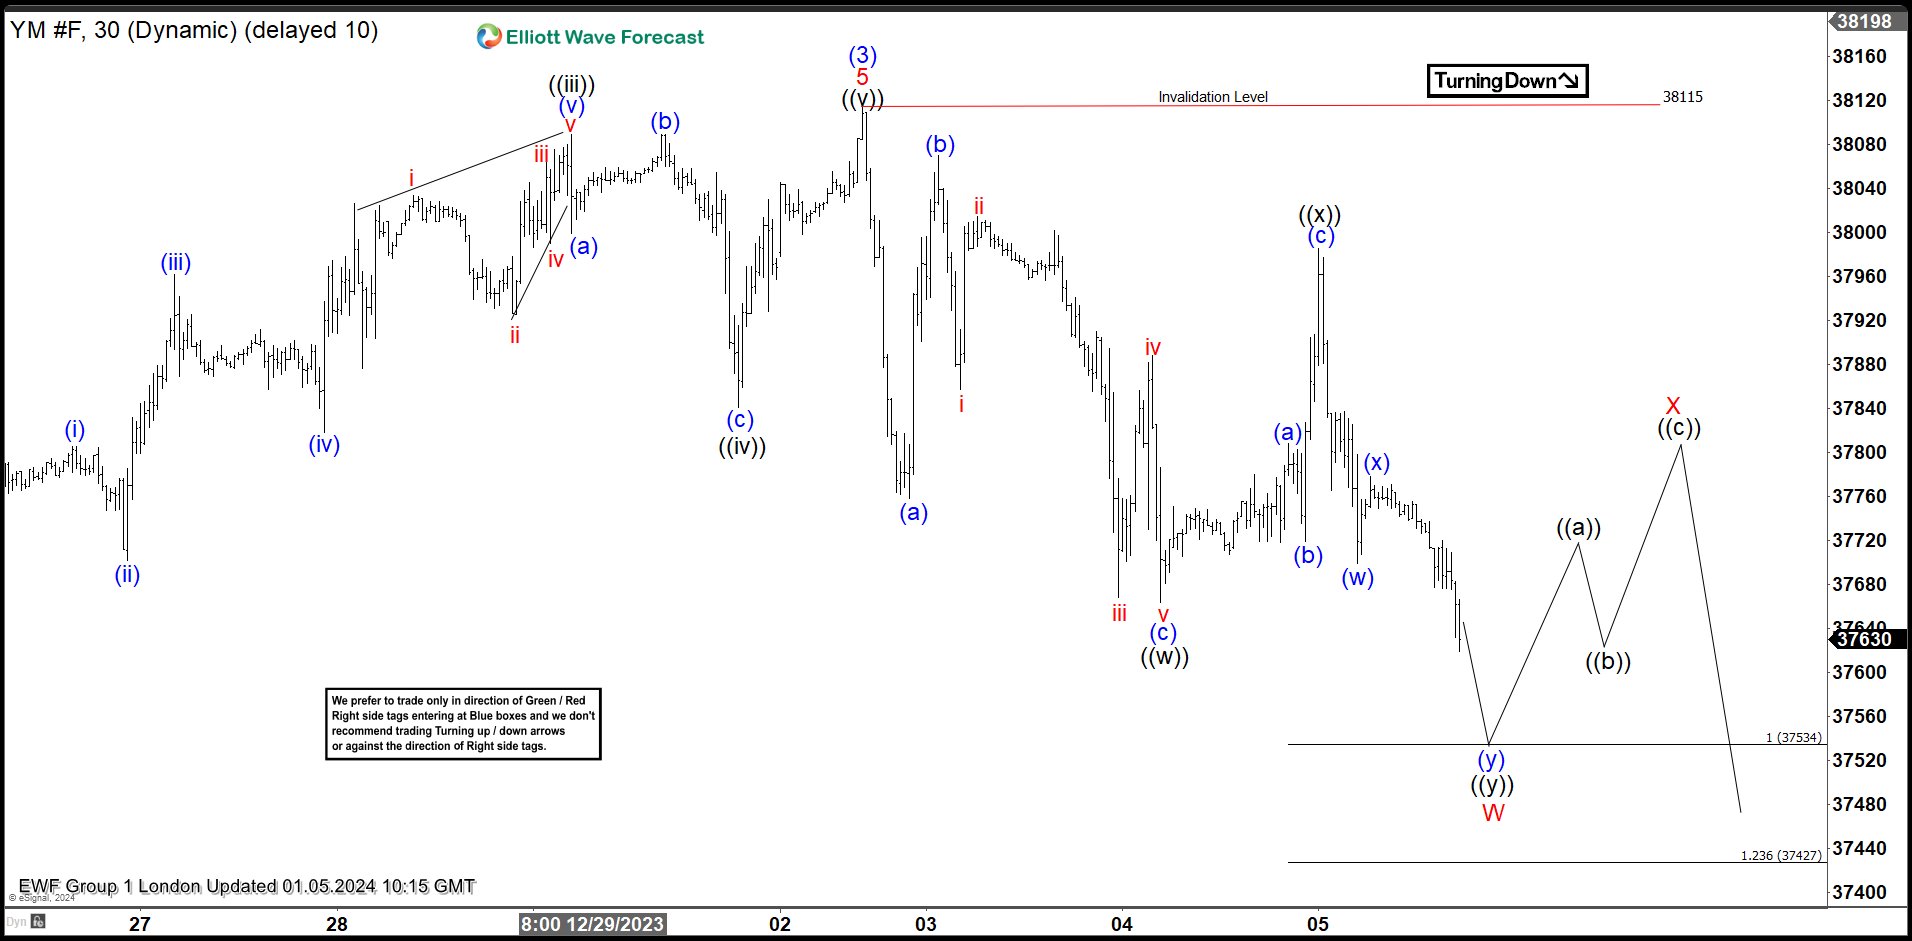
Dow YM_F Elliott Wave h1 Chart 01.05.2023
Cycle from the 38115 peak looks incomplete at the moment. The futures shows lower low sequences, suggesting more short term weakness toward 37534-37427 area. At the marked zone we can be ending first leg W red as potential Double Three pattern. From that zone we expect to see 3 waves bounce before more weakness is seen in Y red leg.
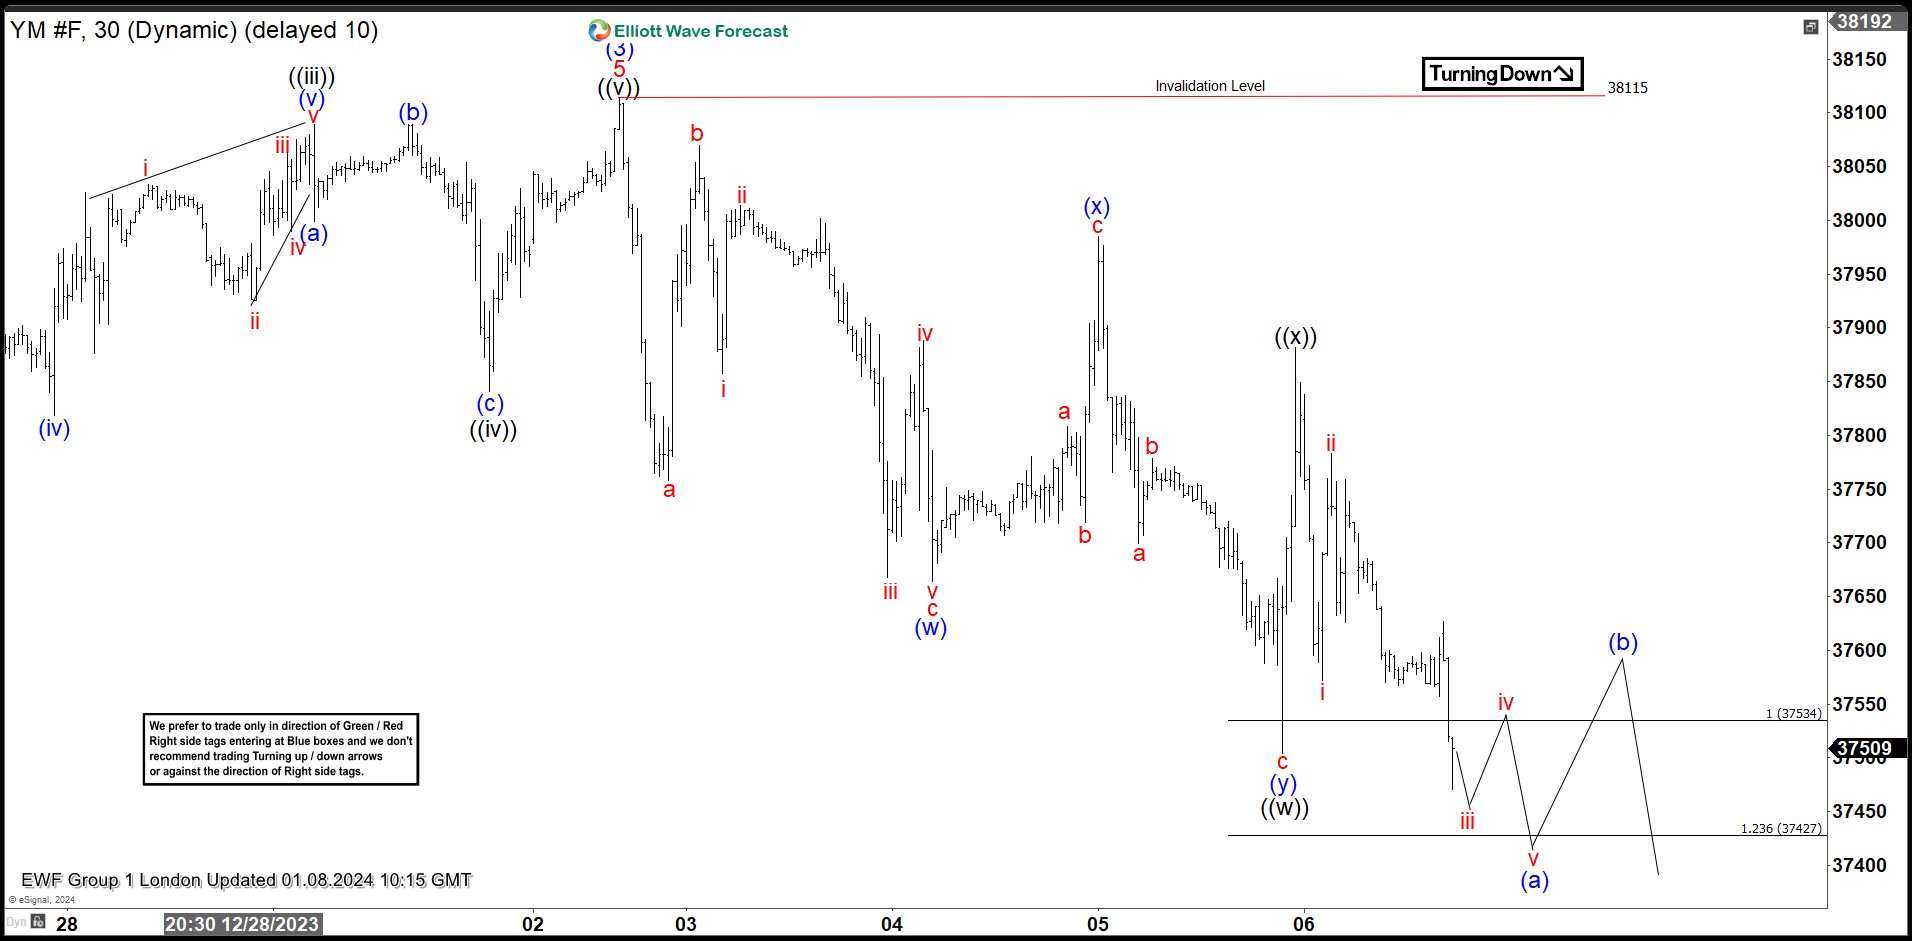
Dow YM_F Elliott Wave h1 Chart 01.08.2023
Dow Futures made decline and the price reached extreme zone from the peak at 37534-37427 . We got nice bounce against the 38115 peak, after which the price turned lower again and made break toward new lows as expected. At the moment the price structure from the 38115 peak is incomplete again, suggesting more weakness ideally in near term. Next tech zone to the downside comes at 37287 area.
USD/JPY Edges Lower Ahead of Tokyo Core CPI
- US nonfarm payrolls rise more than expected to 216,000
- Tokyo Core CPI expected to ease to 2.1%
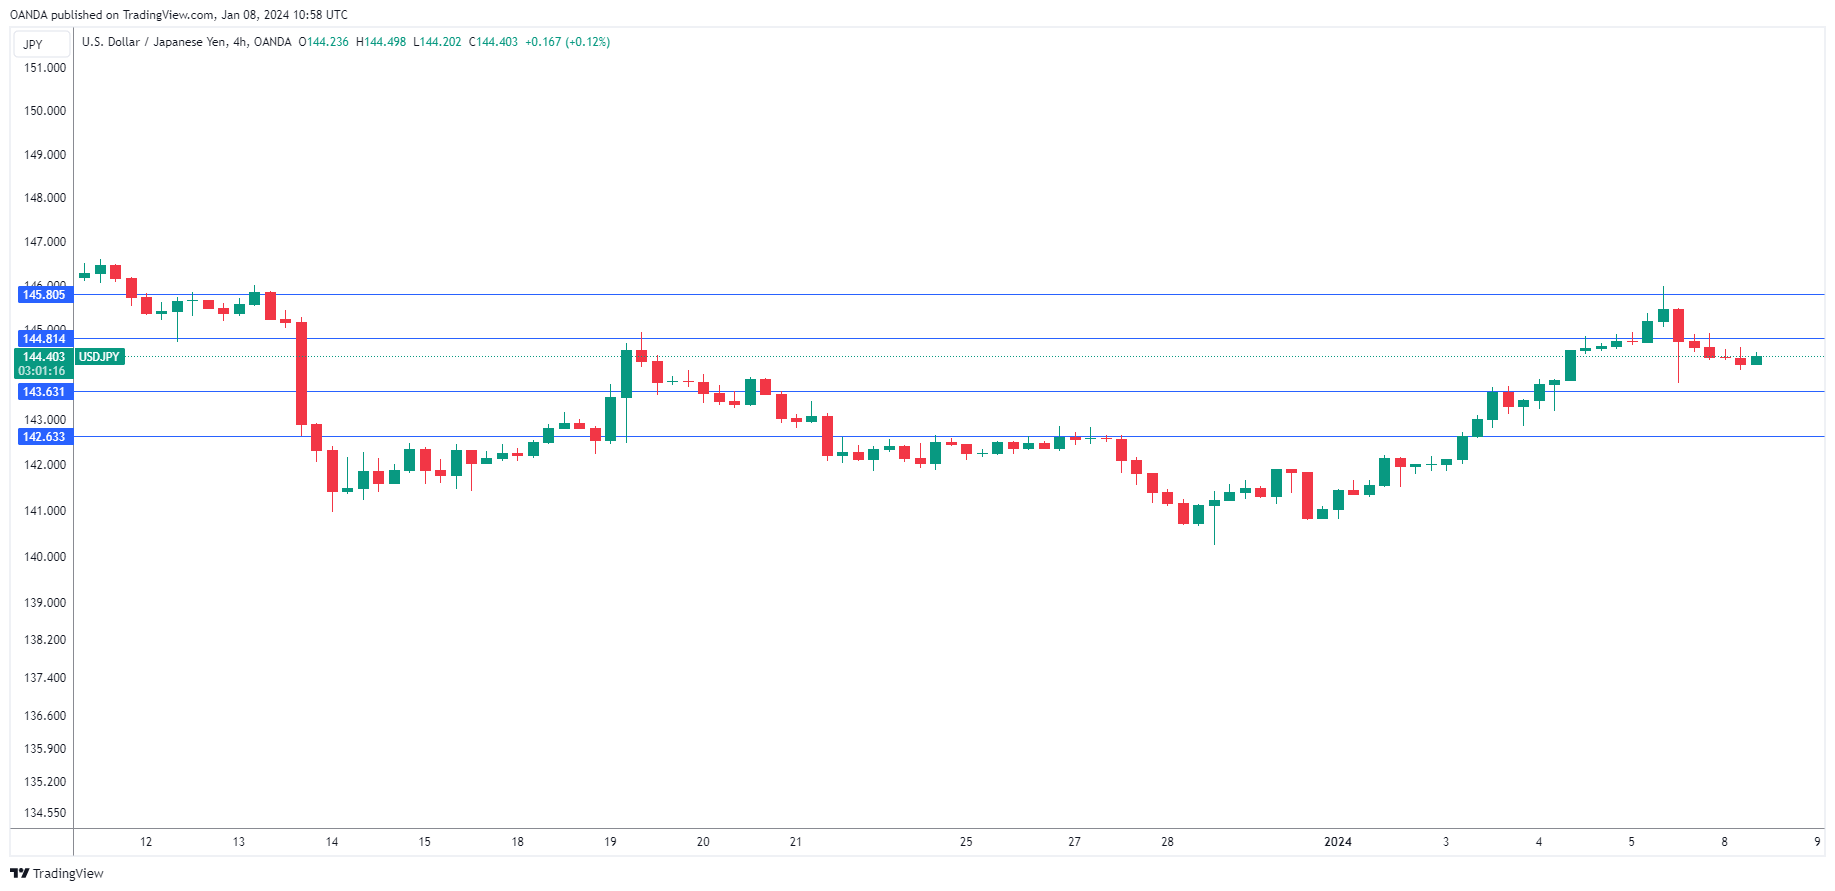
The Japanese yen has started the week with slight gains and is trading at 144.39 in the European session, up 0.16%. It was a rough week for the yen, which declined 2.5% against the US dollar, which has looked sharp against most of the majors since New Year’s.
US nonfarm payrolls stronger than expected
US nonfarm payrolls ended 2023 on a strong note. The economy added 216,000 jobs in December, compared to November’s downwardly revised 173,000 and above the estimate of 170,000. The unemployment rate remained at 3.7%, below the estimate of 3.8%. As well, wage growth rose 0.4% m/m and 4.1% y/y, higher than the estimates of 0.3% and 3.9%.
The employment report was stronger than expected, which could lead the Fed to delay plans to lower rates. Job growth remains resilient and the wage growth data indicates that inflation remains strong in the labour market and is still too high for the Fed. The Fed fund futures markets reacted to the employment report by lowering the odds of a March rate cut to 64%, compared to 68% just prior to the employment report.
The Fed has acknowledged that it plans to trim rates but failed to provide any details of timing in the minutes of the December meeting. The Fed may decide to prolong the pause in rates until the second half of the year unless there is a significant drop in inflation or unforeseen weakness in the US economy. The Fed does not seem in any rush to cut rates and the markets may be getting ahead of themselves by pricing an initial rate cut in March.
Japan’s Tokyo Core CPI, which will be released on Tuesday, is expected to ease in December to 2.1% y/y, compared to 2.3% in November. Core inflation has exceeded the Bank of Japan’s 2% target for 18 straight months, but the central bank has insisted that it will not tighten monetary policy until wage growth rises.
USD/JPY Technical
- 144.80 and 145.80 are the next resistance lines
- There is support at 143.60 and 142.63
AUD/USD: Bears Regaining Traction after Friday’s Pause
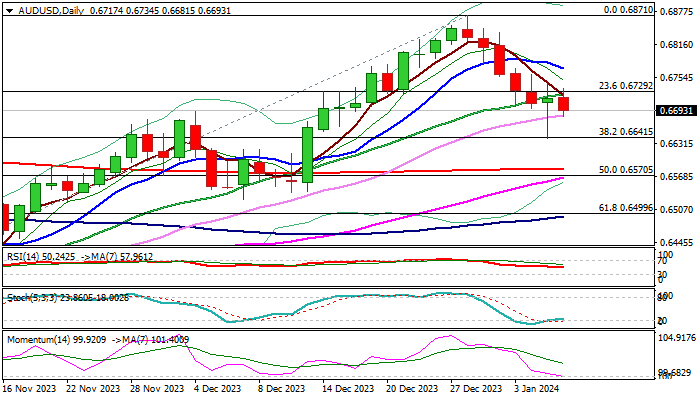
AUDUSD returned to red and fell below 0.6700 mark (reinforced by daily Kijun-sen), signaling that bears are regaining control after Friday’s long-legged Doji pointed to strong indecision.
Risk sensitive Australian dollar came under increased pressure on fresh drop of China stocks) though more work at the downside will be required to signal continuation of a bear-leg from 0.6871 (Dec 28 top).
Close below 0.6700 is seen as a minimum requirement to keep near-term bias with bears and keep focus at pivotal support at 0.6641 (Friday’s spike low / Fibo 38.2% of 0.6270/0.6871 rally) loss of which to bring bears fully in play for extension towards targets at 0.6582/70 (200DMA / 50% retracement).
Moving averages are mixed on daily chart, but south-heading 14-d momentum is attempting to break into negative territory, which will add to negative near-term outlook.
Daily Tenkan-sen (0.6756) marks pivotal resistance, with firm break higher to sideline bears.
Res: 0.6729; 0.6756; 0.6771; 0.6800.
Sup: 0.6684; 0.6641; 0.6582; 0.6570.
Could Tokyo CPI Be Another Small Step Towards the Much-Touted BoJ Normalization?
- Tokyo CPI report kicks off a very interesting period for the BoJ
- Earnings data under the microscope until we get wage news
- Yen’s recent gains against the euro are under threat if data releases turn negative
- Tokyo CPI released on Tuesday; average earnings data on Wednesday
Strong start of 2024 with Tokyo CPI and earnings data
With the market digesting the upside surprises seen in last week’s US labour market statistics, yen traders are preparing for a strong start to the week. Last week ended on a high note as Japanese consumer confidence jumped higher, and the Japan’s Services PMI survey managed to remain comfortably in expanding territory.
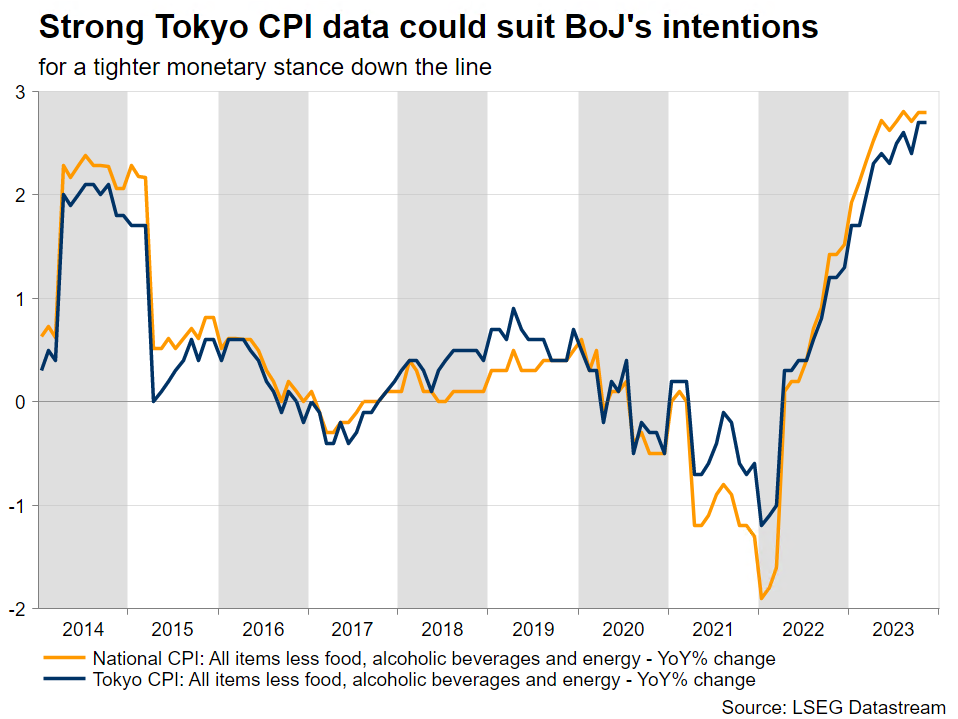
This week the market will be updated on the December Tokyo inflation report and November average earnings data. The Bank of Japan will anxiously scrutinize these results, hoping that there is momentum in domestic price pressure, thus allowing it to finally consider some degree of policy tightening down the line.
In this context, the headline Tokyo CPI could edge slightly lower from the 2.6% growth recorded in November, despite the recent higher oil prices due to the Middle East developments. More crucially, the CPI component excluding food and energy prices will probably remain around the 2.5% area, a tad below November’s 2.7% print. This is a level that could bring smiles to the BoJ members’ faces.
Last BoJ meeting proved uninteresting; wages remain the key input
The last BoJ gathering of 2023 turned out to be a non-event with the post-meeting rhetoric from Governor Ueda mostly focusing on the importance of wages. This argument has been at the forefront of BoJ’s efforts for some time, but we are now getting closer to April 2024 when it could be decision time for the BoJ. Interestingly, the early indications for the 2024 wage round appear positive as a big retailer recently proposed a 7% pay increase for its part-time staff.
Market participants are trying to gather enough evidence to support expectations for a monetary policy tightening move at the January meeting. However, the odds of such a move taking place look very slim despite Ueda’s comments that a policy change could involve an element of surprise. In addition, pushing its interest rate back in positive territory could be a gamble for the BoJ at this stage when so many pieces of the economic puzzle are still missing.
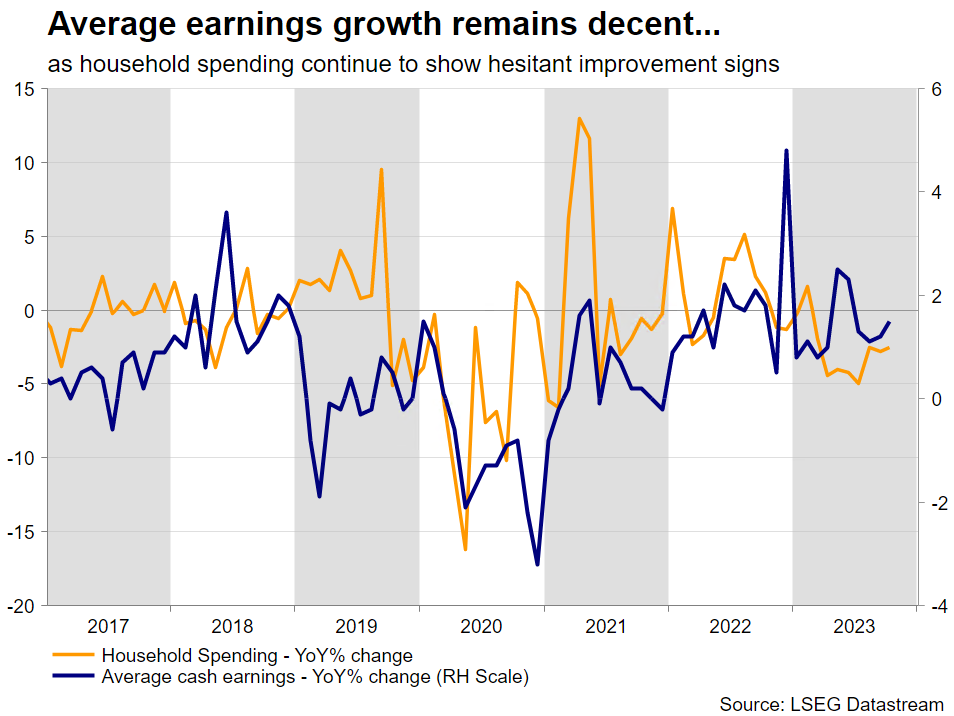
Until we get more concrete details on the 2024 wage round, both the BoJ and the market would have to be content with the earnings and spending data. On Tuesday, the November household spending details could show another negative yearly print but confirm the recent improvement seen in this indicator. Similarly, on Wednesday we will get earnings details for the month of November. This data set is slightly out of date, but important conclusions could be reached especially if the yearly figure heads again north towards its recent peak of 2.9%.
Yen to suffer from weak data releases
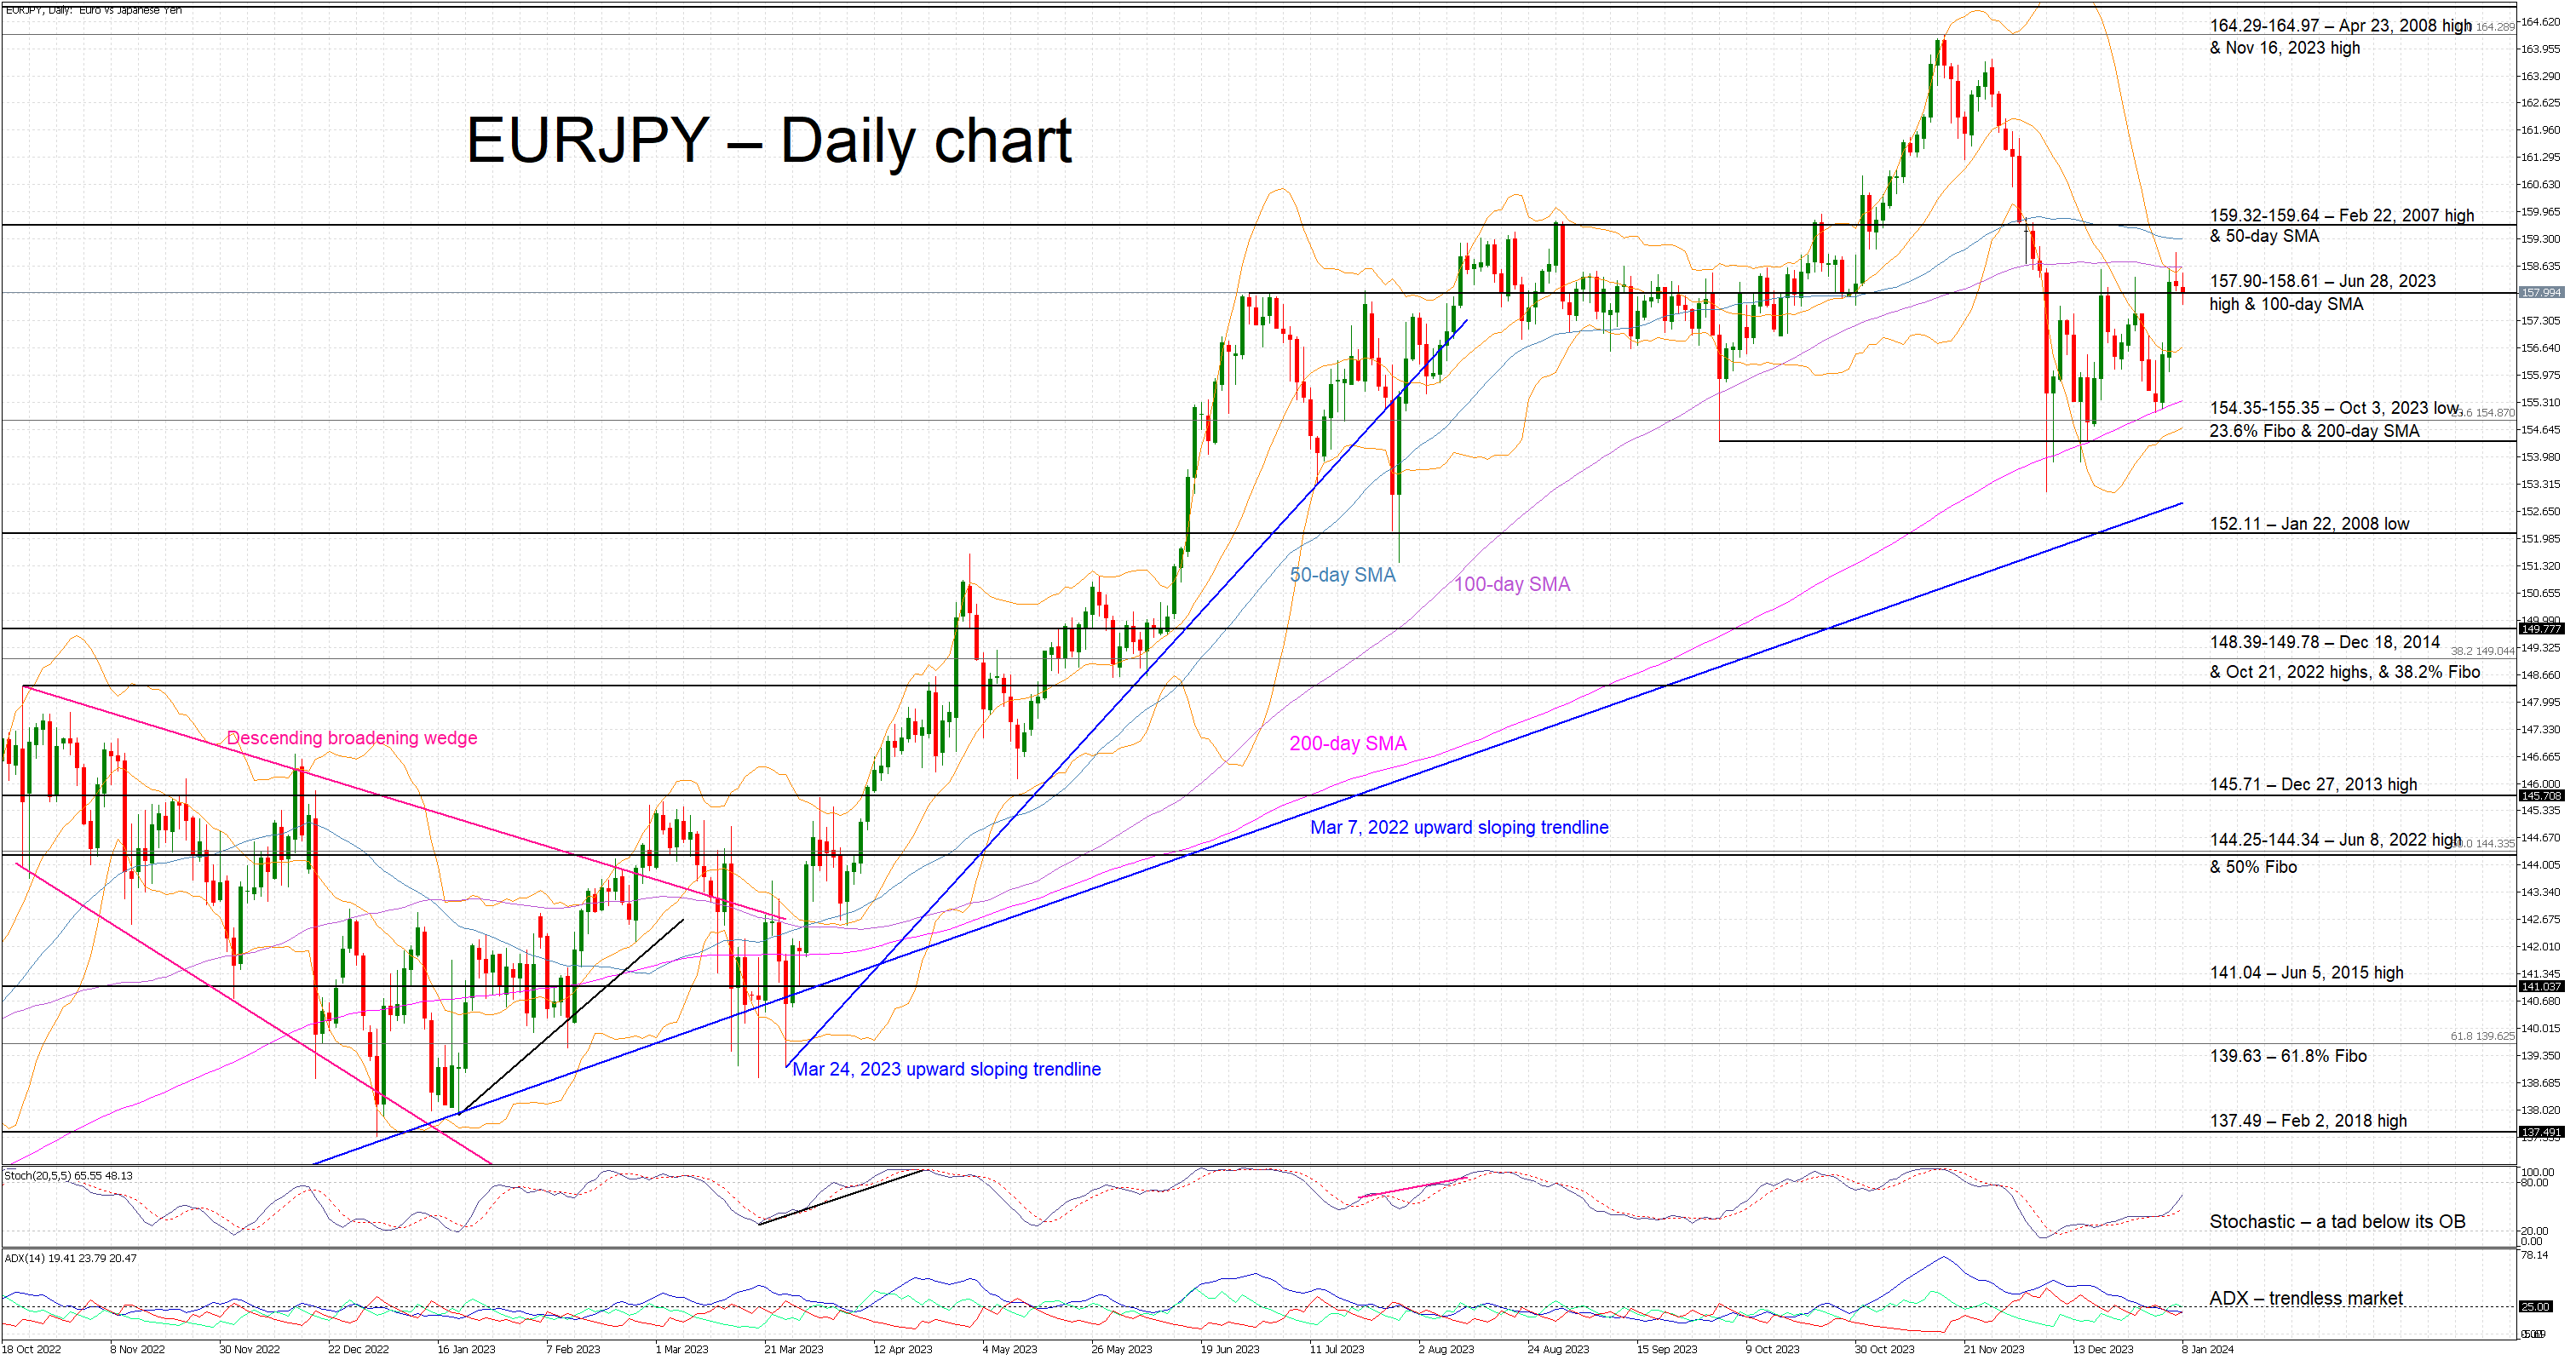
The bearish move recorded in euro/yen after the November 2023 high, which resulted in a new 5-month low, appears to have ended. This pair is currently hovering at the busy 157.90-158.61 area and this week’s data could make it easier for euro bulls to regain market control. A series of downside surprises could open the door for a move above the 159.32-159.64 region with intervention rumours then gradually and hesitantly reappearing.
Should data releases surprise on the upside, especially the core Tokyo inflation figure, there could be an opening for the yen bulls to push euro-yen lower and test the lower boundary of the recent range at 154.35.
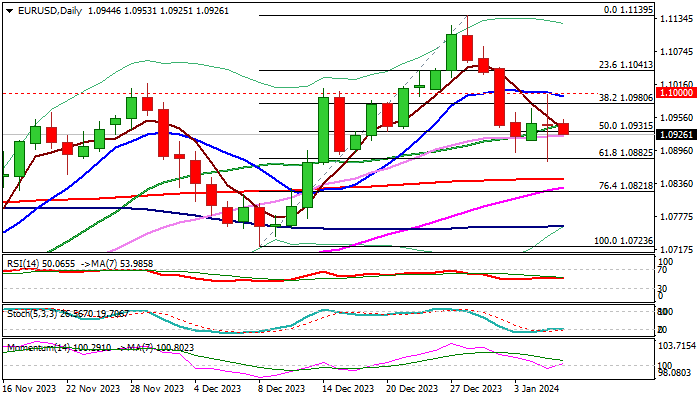
EUR/USD: Near-Term Action Remains in Sideways Mode and Looks for Direction Signals
Near-term action remains directionless and holding within the range which extends into fourth consecutive day.
Friday’s long-legged Doji, left after turbulent post-NFP action, contributes to sideways mode, along with mixed daily technical studies.
Moving averages are setup, though converging 55/200DMA’s are on track to generate bullish signal on potential formation of a golden cross.
Also, 14-d momentum broke into positive territory, the action remains underpinned by thick daily cloud and weekly bear-trap under 1.0931 Fibo support, adds to growing bullish signals.
However, signals need confirmation on lift above 1.10 zone (range top / psychological / daily Tenkan-sen) to confirm a higher base and shift near-term focus higher.
On the other hand, violation of range floor (1.0876) would weaken near-term structure and generate initial signal of continuation of larger downtrend from 1.1139 (Dec 28 peak).
Res: 1.0980; 1.1008; 1.1041; 1.1084.
Sup: 1.0914; 1.0876; 1.0850; 1.0821.
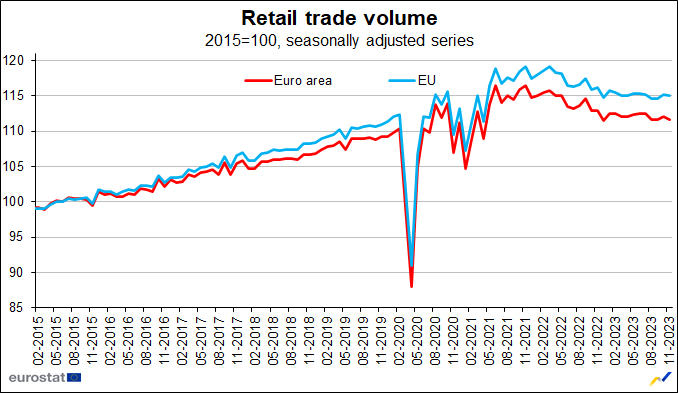
Eurozone retail sales fall -0.3% mom in Nov, EU down -0.2% mom
Eurozone retail sales fell -0.3% mom in November, worse than expectation of -0.1% mom. Volume of retail trade decreased by -0.4% for non-food products and by -0.1% for food, drinks and tobacco, while it increased by 1.4% for automotive fuels.
EU retail sales fell -0.2% mom. Among Member States for which data are available, the largest monthly decreases in the total retail trade volume were registered in the Germany (-2.5%), Luxembourg (-1.4%) and Austria (-0.7%). The highest increases were observed in Portugal (+3.1%), Croatia and Slovenia (both +3.0%), Malta and Romania (both +1.7%).
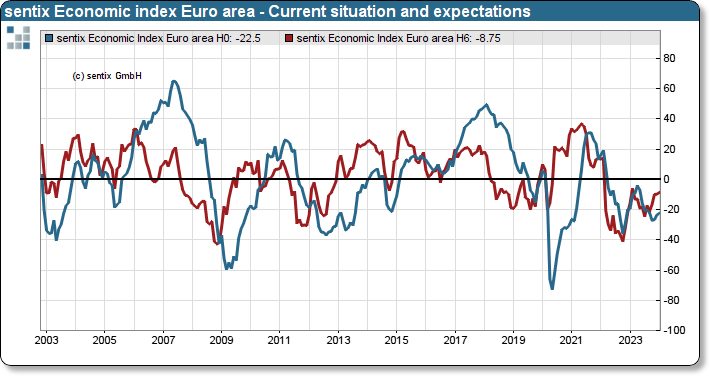
Eurozone Sentix rises to -15.8, but German recession continues
Eurozone Sentix Investor Confidence rose from -16.8 to -15.8 in January, below expectation of -15.4. That's nonetheless the third increase in a row, and the highest reading since May 2023. Current Situation Index also rose for the third month from -23.5 to -22.5. Expectations Index rose for the fourth month, from -9.8 to -8.8, highest since February 2023.
Sentix noted that the sharp drop of -18 points in the sub-index of inflation expectations, from 16.25 to -1.75, raises concerns. This significant decrease is attributed not only to extensive administrative cost increases from tax hikes in Germany but also to a noticeable rise in freight costs, influenced by recent unrest in the Red Sea area. These factors suggest that the prevailing interest rate optimism might be misguided, potentially imposing new challenges on the already struggling Eurozone economy.
Also to be noted, Germany's overall Investor Confidence Index fell from -25.5 to -26.1. Current Situation Index fell from -35.3 to -35.5. Expectations Index fell from -15.3 to -16.3. Sentix noted, "Germany is not emerging from the recession and thus from its economic crisis."
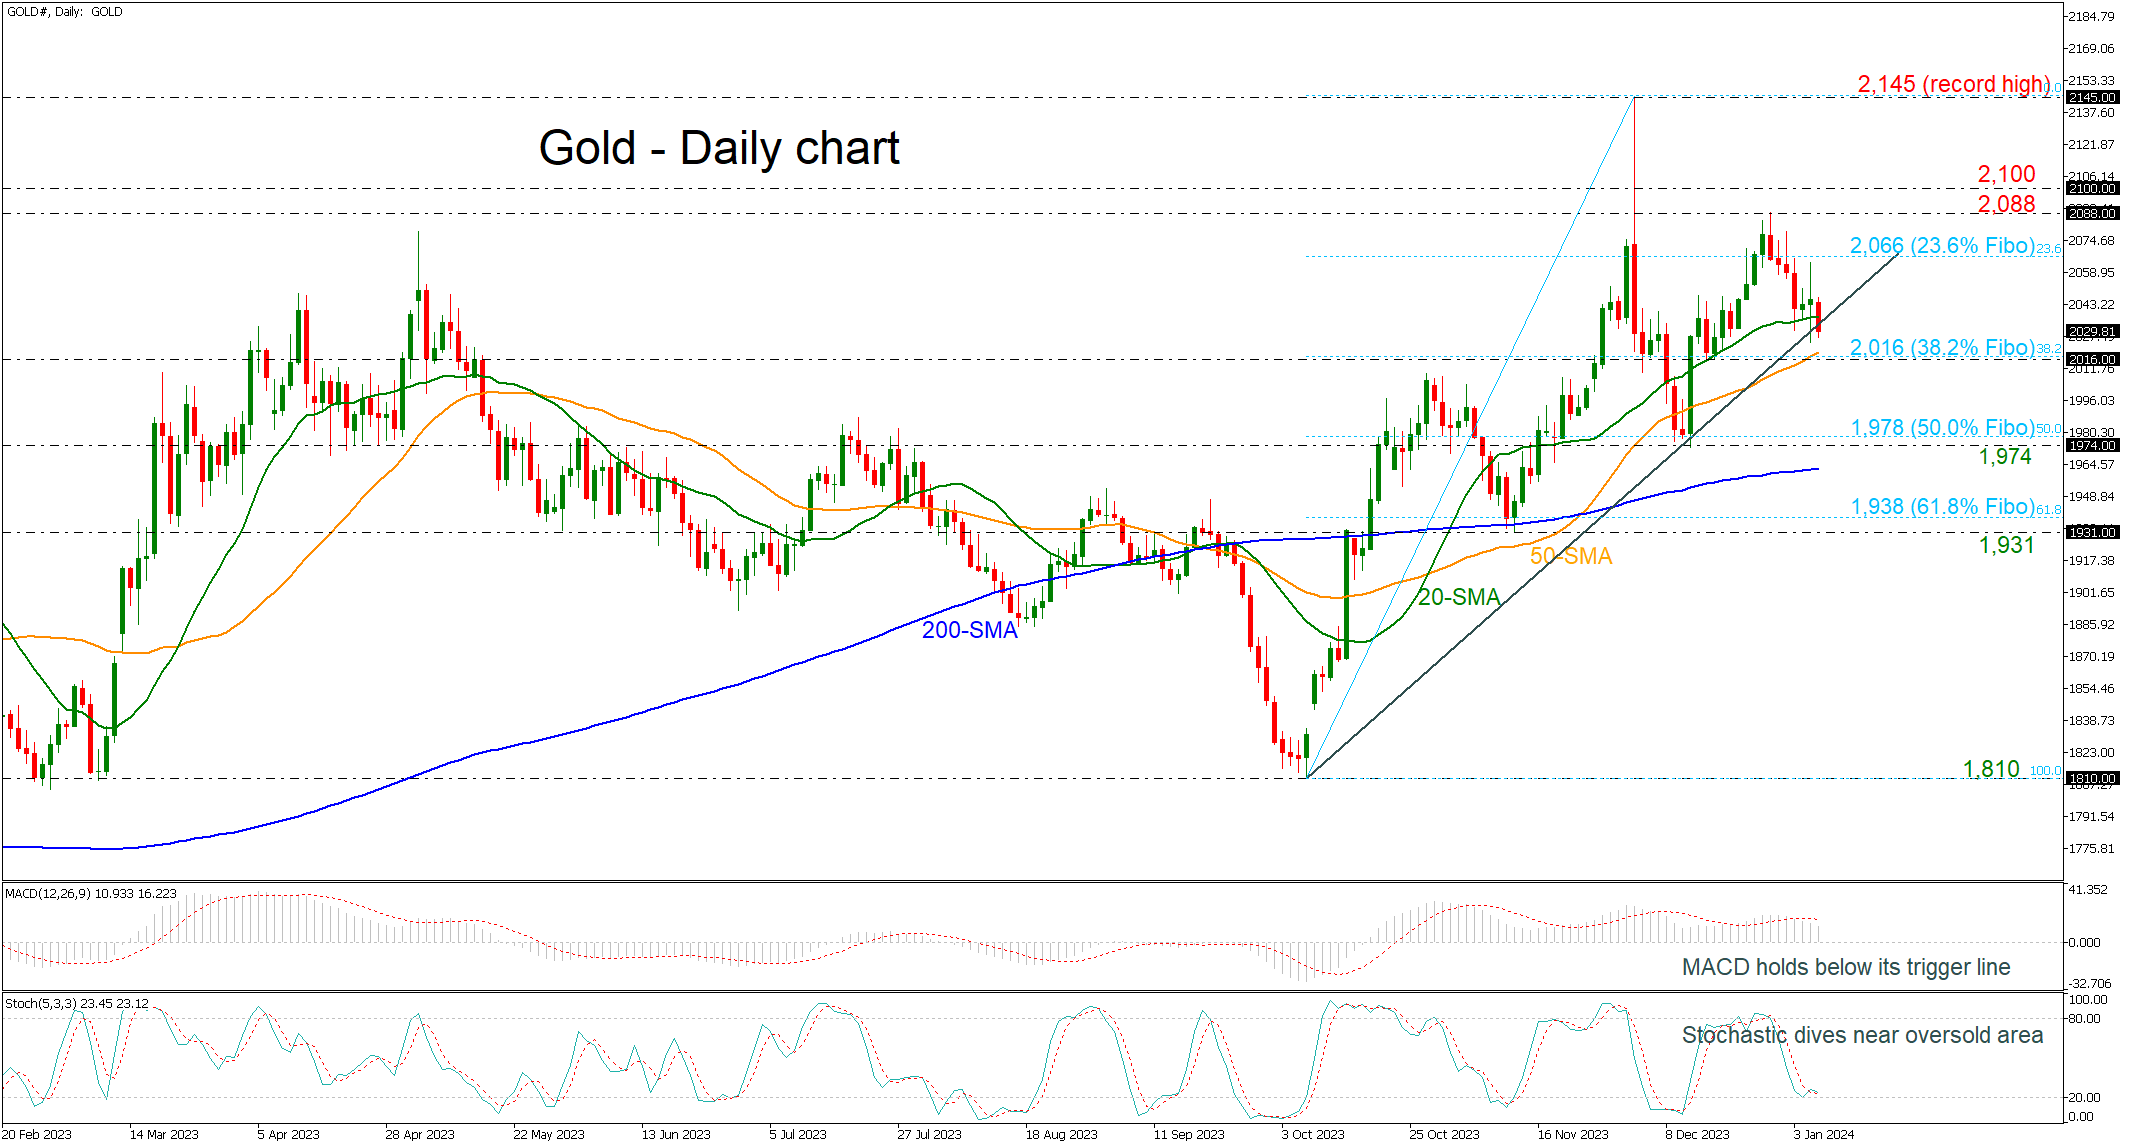
Gold Meets Uptrend Line in Negative Mode
- Gold eases beneath 20-day SMA
- MACD and stochastic indicate more losses
Gold is challenging the medium-term ascending trend line near 2,030 after the sell-off that started from 2,088. The crucial support level for traders to have in mind is the 38.2% Fibonacci retracement of the upward wave from 1,810 to 2,145 at 2,016, where the yellow metal may create a rebound to continue the bullish trend.
Momentum indicators are pointing to a neutral to negative bias in the short term with the MACD just below its trigger line and the stochastic oscillator deep in bearish territory. However, the stochastics have reached the oversold area and the %K line is still attempting a bearish cross with the %D line, suggesting more negative actions on price.
Further losses should see the 2,016 barrier, which moves near the 50-day simple moving average (SMA) acting as a major support. A drop beneath the uptrend line could endorse the bearish scenario and open the way towards the next key level of the 50.0% Fibonacci of 1,978 ahead of 1,974.
In the event of an upside reversal, the 23.6% Fibonacci at 2,066 could act as a barrier before being able to re-challenge the previous top of 2,088. A break above this level would shift the outlook back to strongly positive, hitting 2,100. Further gains would lead the way towards the record high of 2,145, achieved on December 4.
All in all, gold prices are still in a positive territory; however, the technical indicators are suggesting a downside correction.
US CPI on Thursday Marks This Week’s Apex
Markets
Friday’s payrolls were better than expected on face value. It caused yields to temporarily jump after already trending higher throughout the day. As markets digested the report, evidence of a labor market cooling emerged. The sharp and contrasting drop in employment measured by the household survey, for one, could be a reason for caution. The same goes for an unexpected decline in the participation rate. Either way, combined with a disappointing US services ISM later, yields even spiked in the opposite direction. The December headline number retreated from 52.7 to 50.6, signaling an only minor expansion. While prices paid stayed at a fairly high 57.4, new orders unexpectedly dropped from 55.5 to 52.8. Together with the employment series falling off a cliff into contraction territory (from 50.7 to 43.3) it could spell trouble ahead. But in what is possibly testament to markets’ new reaction function after having discounted more than enough monetary easing, yields recovered from the dip lower. Fed’s Lorie Logan hinted the debate on slowing QT (currently $95bn/month) may start in the near term but that didn’t stop the intraday comeback either. US yields eventually finished between flat (2-y) and 5 bps (30-y) higher. German yields partially missed out on the US recovery but nonetheless rose 2.6-3.8 bps across the curve. The US dollar whipsawed but in the end it’s as both the payrolls and ISM report never were released. EUR/USD finished unchanged at 1.094. DXY held steady at 102.41 and USD/JPY close to but below 145. Sterling outperformed global peers, sending EUR/GBP further lower towards the 0.86 big figure. European equities pared 1%+ losses to 0.2% and Wall Street finished a poor week on slightly positive footing. It offers little respite to Asian stocks though. Many of them trade in the red, especially in China and Hong Kong. Today’s economic calendar offers little to guide markets. The European Commission’s economic confidence indicator is due and Fed’s Bostic addresses the economic outlook. US CPI on Thursday marks this week’s apex with speeches from Fed’s Williams and ECB’s Lane, Schnabel and Villeroy scattered across the week worth mentioning as well. For today we expect technical trading to take hold. We stick to the view that markets have priced in too much Fed and ECB easing and a countermove may be in the process of materializing. The US 10-y yield finishing last week above 4% is a technical win. Next resistance is located around 4.08% which marked the upper bound of a sideways trading range that dominated the first half of 2023. Taking out 4.25% would further substantially improve the picture. Germany’s 10-y is looking at first resistance around 2.20%. EUR/USD’s short term fate is confined to a narrow 1.09/1.10 trading range.
News & Views
KPMG and REC published their latest Report on Jobs survey. Especially permanent placements, but also temp billings declined again in December, though at softer rates than in November. Weak economic demand weighs on hiring decisions. Overall vacancies fell slightly for the third time in the past four months. Candidate availability continued to rise at rapid levels with redundancies and a slowdown in hiring pushing up labour supply. Hotel & Catering saw by far the steepest increase in short-term vacancies. The Construction and Retail categories meanwhile recorded the sharpest declines in demand for temporary workers. The rate of starting salary inflation picked up from November and was sharp overall though nevertheless the second-slowest since March 2021.
Czech National Bank vice-governor Zamrazilova said yesterday that the CNB could stick with small 25 bps policy rate decreases if the decline towards inflation is slower that it thinks. If it falls faster, she argues to sometimes make a more significant lowering. The CNB conducted an inaugural 25 bps rate cut at its final policy meeting of 2023 (6% to 5.75%). Minutes of that meeting last Friday showed some internal divergence of the pace of rate cuts. Zamrazilova added that the risk of wage-price spiral occurring in the near future has probably decreased further with the likelihood of stronger-than-expected repricing in January being fairly low. Czech public finances on the other hand represent a long-term inflationary risk.