
Sample Category Title
USD/JPY Daily Outlook
Daily Pivots: (S1) 143.63; (P) 144.80; (R1) 145.80; More...
Intraday bias in USD/JPY is turned neutral with current retreat. On the upside, above 145.97 will resume the rebound from 140.25. But upside should be limited by 61.8% retracement of 151.89 to 140.25 at 147.44. On the downside, below 143.17 minor support will turn bias back to the downside for retesting 140.25 low.
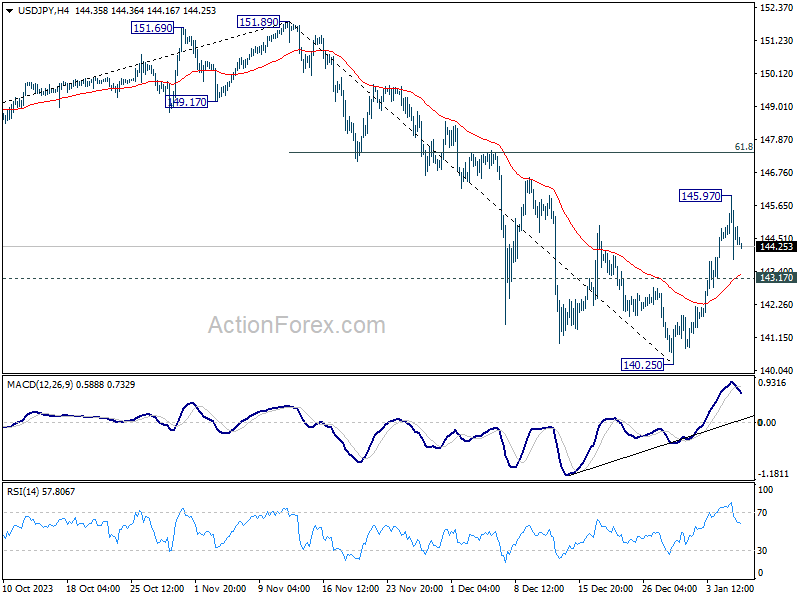
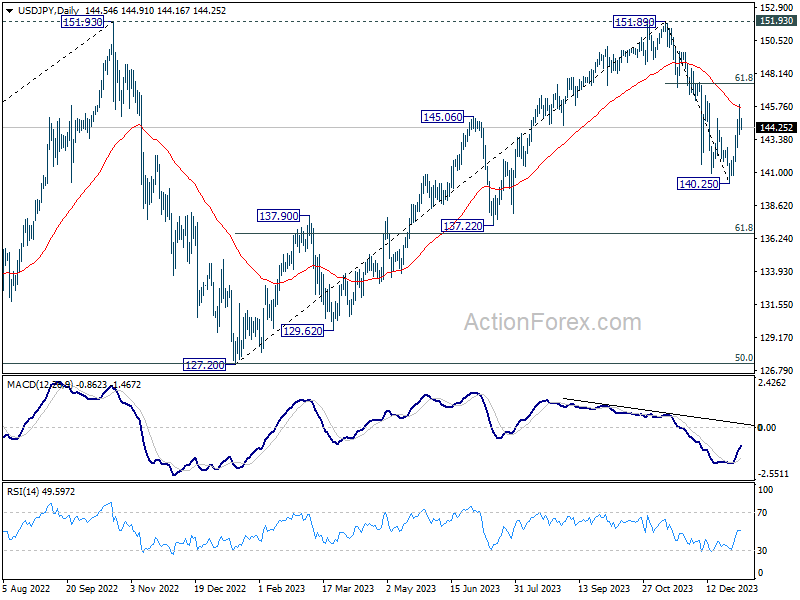
In the bigger picture, for now, fall from 151.89 is still seen as the third leg of the corrective pattern from 151.89. Another decline through 140.25 will target 61.8% retracement of 127.20 to 151.89 at 136.63. Sustained break there will pave the way to 127.20 support (2022 low). However, firm break of 147.44 fibonacci resistance will dampen this view and bring retest of 151.89 instead.
USD/CAD Daily Outlook
Daily Pivots: (S1) 1.3300; (P) 1.3349; (R1) 1.3411; More...
Further rise is in favor in USD/CAD with 1.3286 minor support intact. Current rise from 1.3176 short term bottom would target 38.2% retracement of 1.3897 to 1.3176 at 1.3451. Firm break there will pave the way to 61.8% retracement at 1.3622. On the downside, however, break of 1.3286 will turn bias back to the downside for 1.3176 low instead.
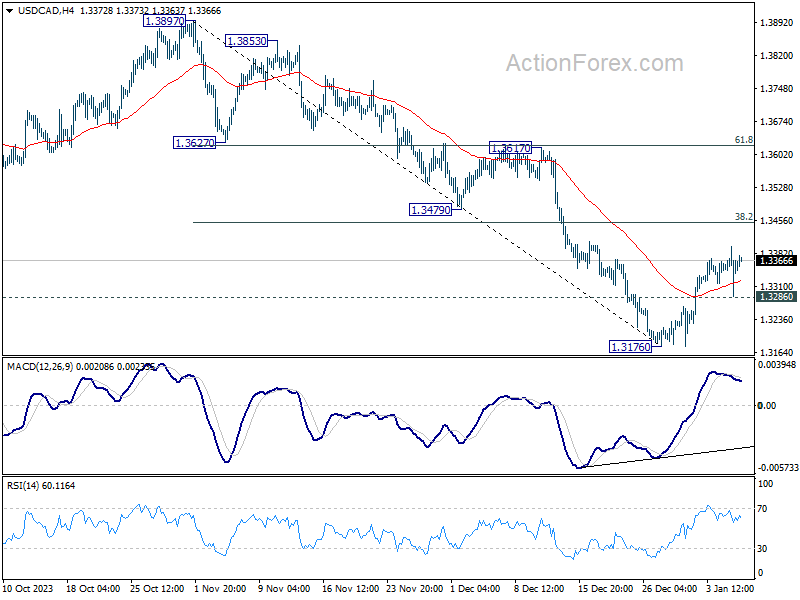
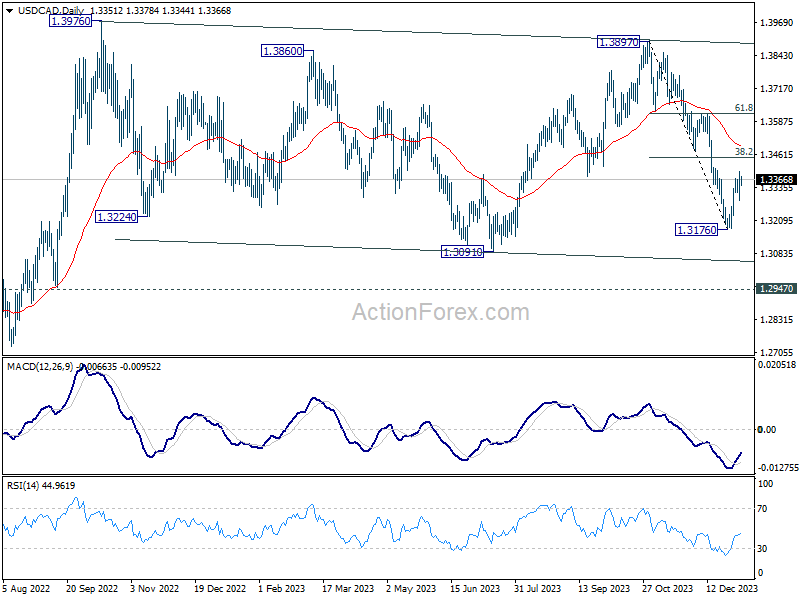
In the bigger picture, price actions from 1.3976 (2022 high) are viewed as a corrective pattern only. While fall from 1.3897 could still extend through 1.3091, strong support should emerge above 1.2947 resistance turned support to bring rebound. Overall, larger up trend from 1.2005 (2021 low) is still expected to resume at a later stage.
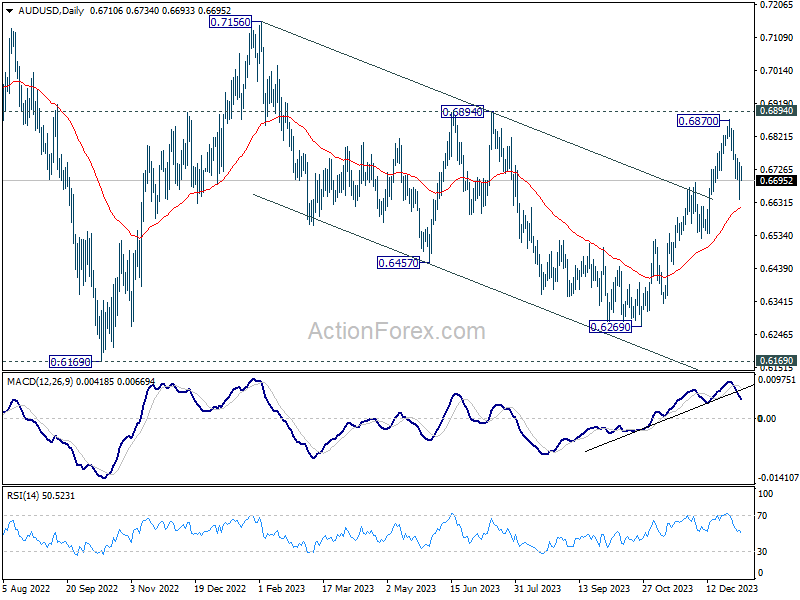
AUD/USD Daily Report
Daily Pivots: (S1) 0.6655; (P) 0.6702; (R1) 0.6762; More...
With 0.6759 minor resistance intact, further decline is expected in AUD/USD. Fall from 0.6870 short term top would target 55 D EMA (now at 0.6612). Some support could be seen there to bring rebound on first attempt. On the upside, however, break of 0.6759 minor resistance will suggest that the pull back is over, and bring retest of 0.6870 instead.
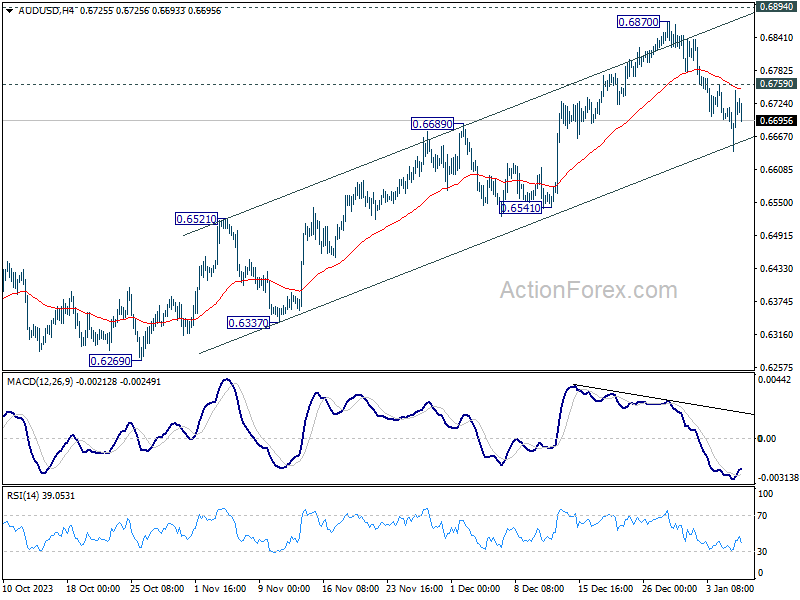
In the bigger picture, price actions from 0.6169 (2022 low) could be just a medium term corrective pattern to the down trend from 0.8006 (2021 high). Rise from 0.6269 is seen as the third leg of the pattern that could target 0.7156 on break of 0.6894 resistance. For now, range trading should be seen between 0.6169 and 0.7156 (2023 high), until further developments.
Aussie Weakens, Gold’s Recovery, Global Inflation Data in Spotlights
Australian Dollar trades broadly lower in today's Asian session, influenced by notable decline in Hong Kong and Chinese stock markets as driven by selloff in technology stocks in these regions. Additionally, there is growing investor caution ahead of impending economic data from China, which is anticipated to highlight deepened deflation and challenges in the export sector. This cautious sentiment has led to Australian Dollar being the weakest performers so far, with Swiss Franc, British Pound, and Kiwi following.
On the flip side, Japanese Yen, Dollar, and Euro are showing slight gains in what has been a relatively subdued session. Notably, apart from a few Yen currency pairs, most forex markets are trading within the ranges established on Friday, indicating the lack of significant volatility at the moment. However, this is expected to change as focus shifts to forthcoming economic inflation data from major economies including US, Japan, China, Australia, Switzerland, as well as UK GDP.
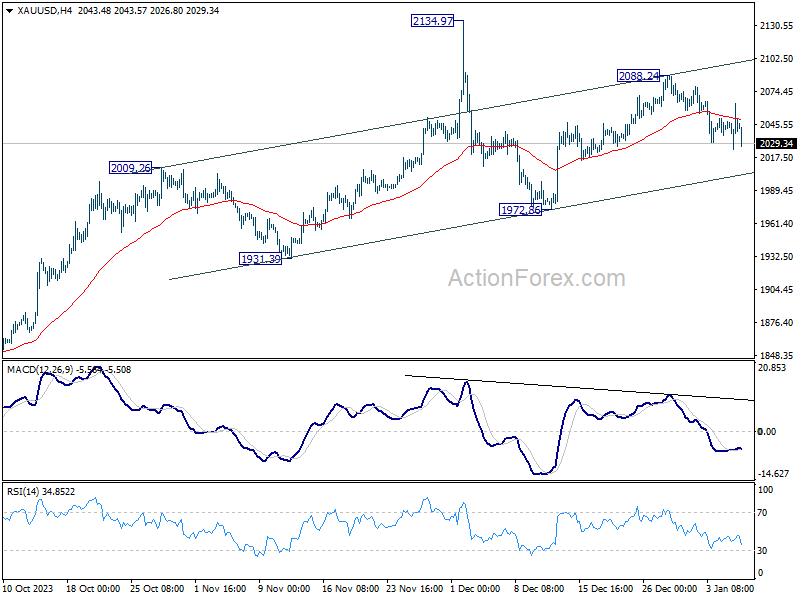
Technically, Gold's recovery last Friday was rather brief. The decline from 2088.24 short term top is still in progress for near term channel support (now at 2004), which is close to 2000 psychological level. Strong rebound is expected from the channel to bring rebound, for resuming near term up trend through 2088.24. However, sustained break there will raise the chance of reversal and target 1972.86 support instead.
In Asia, at the time of writing, Hong Kong HSI is down -2.08%. China Shanghai SSE is down -1.08%. Singapore Strait Times is up 0.01%. Japan is on holiday.
Fed's Logan emphasizes need for tight financial conditions to curb inflation
Dallas Fed President Lorie Logan, in her speech on Saturday, emphasized the importance of maintaining tight financial conditions to prevent resurgence of inflation. She expressed concern that if these conditions are not sustained, progress made in controlling inflation could be reversed.
Logan Logan underscored the significant role that restrictive financial conditions have played in "bringing demand into line with supply and keeping inflation expectations well-anchored".
However, she noted a recent reversal in this trend, pointing out that long-term yields have relinquished much of the tightening observed over the summer. She warned, "We can't count on sustaining price stability if we don't maintain sufficiently restrictive financial conditions."
Logan also addressed the Federal Reserve's balance sheet runoff. She indicated that it might be appropriate to consider slowing the pace of this runoff, particularly as overnight reverse repurchase agreement balances approach lower levels.
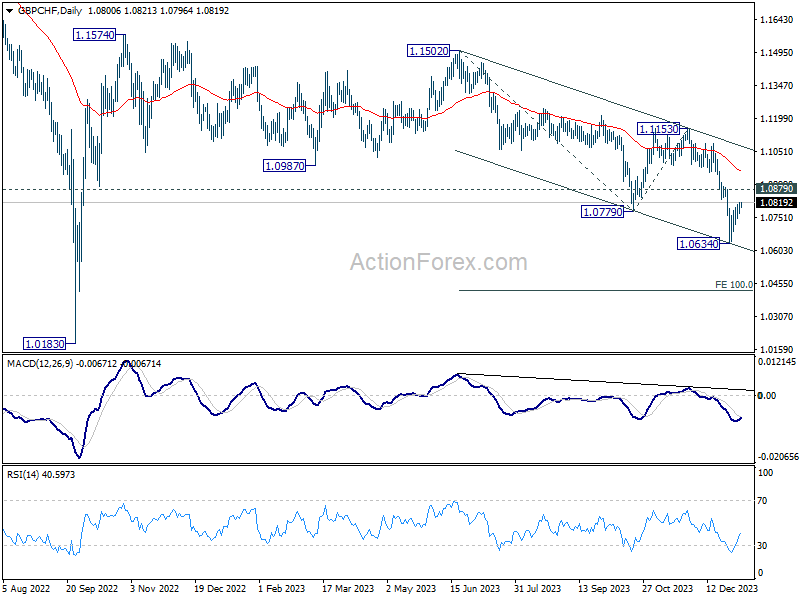
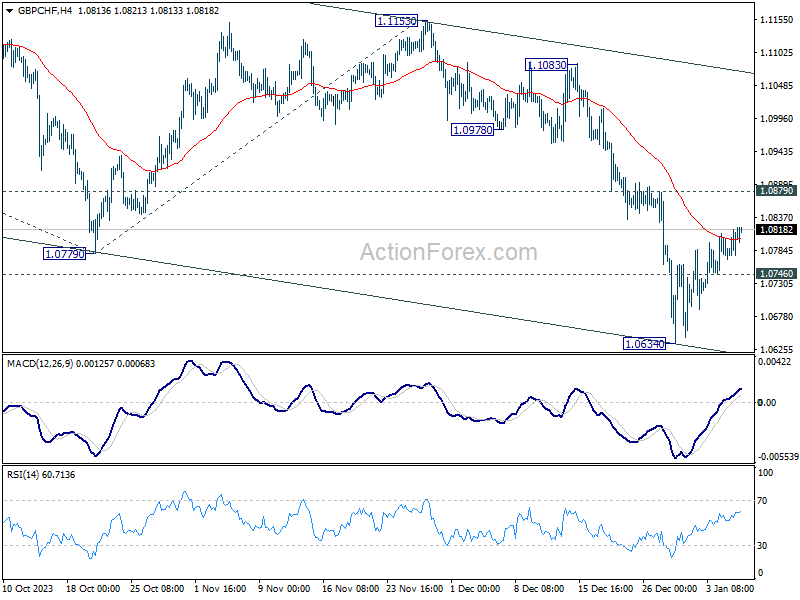
Swiss Franc awaits CPI, GBP/CHF in corrective recovery
Traders of Swiss Franc are closely monitoring Swiss CPI release today. Headline inflation is anticipated to increase from 1.4% yoy to 1.7% yoy in December. This expected rise aligns with SNB's own conditional inflation forecast, which projects inflation to reaccelerate from 1.6% in Q4 of last year to 1.8% in Q1, peaking at 2.0% in Q2 before tapering off to 1.9% in Q4.
Regarding SNB's monetary policy, current interest rate stands at 1.75%, which is comparatively unrestrictive. Unlike the more aggressive rate hikes implemented by counterparts like ECB and Fed, SNB's past rate increases have had much less detrimental impact on the Swiss economy. Consequently, there is no immediate pressure for a rate cut, and it is generally anticipated that SNB will maintain current interest rate at least until Q3 of this year. Should today's inflation reading surpass expectations, it could increase the likelihood of SNB holding interest rate unchanged for the remainder of the year.
GBP/CHF recovered after hitting 1.0634, being supported by falling channel support line. Price actions since there are corrective looking. Also, the recovery is kept below 1.0879 minor resistance. Thus, outlook is staying bearish. Break of 1.0746 minor support will bring retest of 1.0634 low first. Further break there will resume recent down trend to 100% projection of 1.1502 to 1.0779 from 1.1153 at 1.0430.
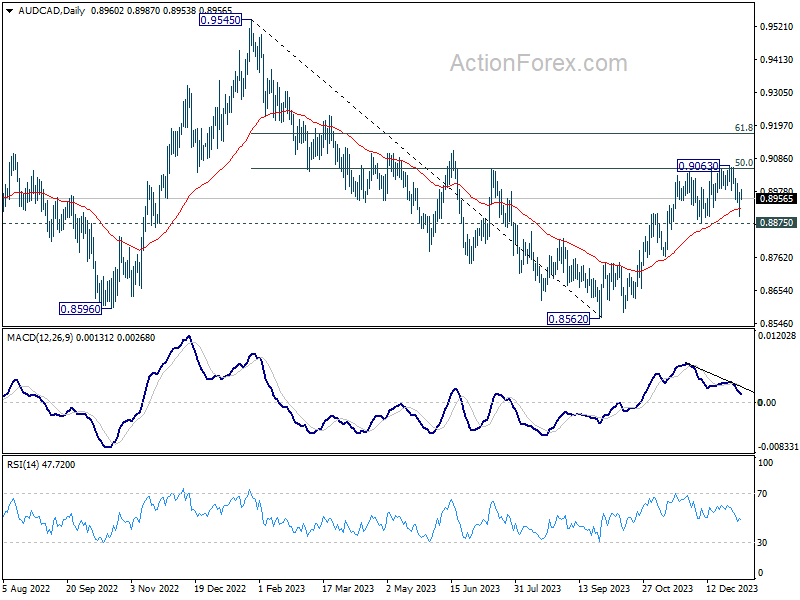
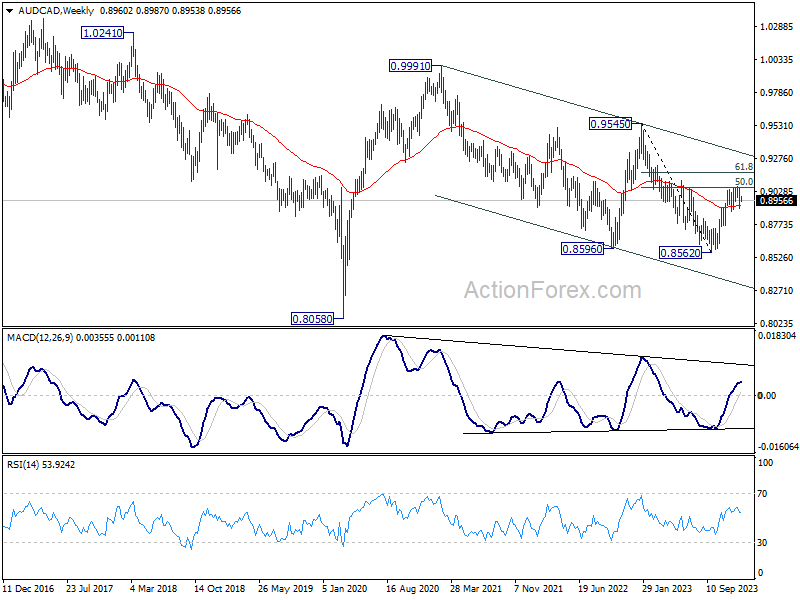
AUD/CAD eyes 0.8875 support, await Australia CPI
The recovery of AUD/CAD since last September has been largely attributed to the divergence in monetary policies between RBA and BoC. While RBA extended its tightening cycle, BoC's interest rate reached a plateau. The rally in December was particularly driven by speculations of an additional RBA rate hike, although the momentum lost steam after briefly surpassing 0.9 handle.
Technically speaking, this recovery from 0.8562 is more corrective looking than impulsive. The notable decline since the start of the year indicates that a short term top was already formed at 0.9063, on bearish divergence condition in D MACD. Break of 0.8875 support should also confirm rejection by 50% retracement of 0.9545 to 0.8562 at 0.9054. That would turn near term outlook bearish for retest 0.8562 low.
The upcoming release of Australia's monthly CPI data could serve as a catalyst for a downturn in AUD/CAD. However, the sustainability of downside momentum, especially in breaking through 0.8562 support, will very much depend on which central bank between RBA and BoC starts cutting interest rates first and the subsequent policy paths they adopt.
Global Focus on Inflation Data: US, Japan, China, Australia and Swiss
Inflation data across various economies are set to be the primary focus for financial markets this week. In the US, the pace of core inflation's deceleration will be closely monitored, as it is a crucial determinant for the timing of Fed's first interest rate cut. While a rate cut in March is still considered unrealistic, any lower-than-expected figures in the upcoming CPI and core CPI data could lead traders to increase their bets on a sooner-than-anticipated rate reduction.
In Japan, Tokyo CPI is widely regarded as a reliable precursor to the national CPI figures. Upcoming labor earnings data will also be essential, offering insights into wage growth pressures. These factors are critical for BoJ to consider as it deliberates on exiting negative interest rate policies this year.
China is slated to release several key economic indicators, including CPI,PPI, and trade balance data. The market's attention will be focused on the depth and duration of China's deflationary trends and the ongoing slump in exports and imports. For Australia, the release of the monthly CPI will provide some perspective on inflationary developments and whether any new data might prompt RBA to respond, given its "low tolerance" for inflation surprises.
Additionally, the UK will report GDP and production data, while Eurozone will release Sentix investor confidence figures. Switzerland's CPI data will also be featured, adding to the wealth of economic information influencing markets in Europe.
Here are some highlights for the week:
- Monday: Germany factory orders, trade balance; Swiss CPI, retail sales; Eurozone Sentix investor confidence, retail sales.
- Tuesday: Japan Tokyo CPI, household spending; Australia retail sales, building approvals; Swiss unemployment rate; Germany industrial production, France trade balance; Eurozone unemployment rate; Canada building permits, trade balance; US trade balance.
- Wednesday: Japan average cash earnings; Australia monthly CPI; France industrial production.
- Thursday: Australia trade balance; Japan leading index; ECB monthly bulletin; US CPI, unemployment rate.
- Friday: Japan banking lending, current account; China CPI, PPI, trade balance; UK GDP, production, trade balance; France consumer spending; US PPI.
AUD/USD Daily Report
Daily Pivots: (S1) 0.6655; (P) 0.6702; (R1) 0.6762; More...
With 0.6759 minor resistance intact, further decline is expected in AUD/USD. Fall from 0.6870 short term top would target 55 D EMA (now at 0.6612). Some support could be seen there to bring rebound on first attempt. On the upside, however, break of 0.6759 minor resistance will suggest that the pull back is over, and bring retest of 0.6870 instead.
In the bigger picture, price actions from 0.6169 (2022 low) could be just a medium term corrective pattern to the down trend from 0.8006 (2021 high). Rise from 0.6269 is seen as the third leg of the pattern that could target 0.7156 on break of 0.6894 resistance. For now, range trading should be seen between 0.6169 and 0.7156 (2023 high), until further developments.
Economic Indicators Update
| GMT | Ccy | Events | Actual | Forecast | Previous | Revised |
|---|---|---|---|---|---|---|
| 07:00 | EUR | Germany Factory Orders M/M Nov | 1.10% | -3.70% | ||
| 07:00 | EUR | Germany Trade Balance (EUR) Nov | 17.9B | 17.8B | ||
| 07:30 | CHF | Real Retail Sales Y/Y Nov | 0.00% | -0.10% | ||
| 07:30 | CHF | CPI M/M Dec | -0.10% | -0.20% | ||
| 07:30 | CHF | CPI Y/Y Dec | 1.70% | 1.40% | ||
| 09:30 | EUR | Eurozone Sentix Investor Confidence Jan | -15.4 | -16.8 | ||
| 10:00 | EUR | Eurozone Economic Sentiment Indicator Dec | 93.8 | |||
| 10:00 | EUR | Eurozone Industrial Confidence Dec | -9.5 | |||
| 10:00 | EUR | Eurozone Services Sentiment Dec | 4.9 | |||
| 10:00 | EUR | Eurozone Consumer Confidence Dec F | -15.1 | -15.1 | ||
| 10:00 | EUR | Eurozone Retail Sales M/M Nov | -0.10% | 0.10% |
Technical Outlook and Review
DXY:
The DXY (US Dollar Index) chart currently exhibits a bearish overall momentum, and this is supported by the fact that the price is contained within a bearish descending channel. This suggests weakness in the US Dollar. In the short term, there’s a potential for a bearish continuation towards the 1st support level.
The 1st support at 100.80 is categorized as a swing low support. This level is significant as it has previously acted as a point where buying interest emerged, potentially providing temporary support for the DXY.
On the resistance side, the 1st resistance at 102.62 is identified as an overlap resistance. This level may serve as a substantial barrier where selling interest could intensify, potentially causing a bearish reversal or a pause in the downtrend.
The 2nd resistance at 103.32 is noted as a pullback resistance. It signifies a point where sellers may re-enter the market after a pullback, adding to its significance as a potential resistance zone.
EUR/USD:
The EUR/USD chart currently exhibits a bullish overall momentum, suggesting strength in the Euro against the US Dollar.
Price could potentially continue its bullish movement towards the 1st resistance level.
The 1st support at 1.0879 is categorized as an overlap support and is associated with the 61.80% Fibonacci Retracement level. This level may act as a significant area where buying interest could emerge, providing temporary support for the EUR/USD.
The 2nd support at 1.0747 is identified as an overlap support, further reinforcing its significance as a potential support zone.
On the resistance side, the 1st resistance at 1.1006 is categorized as a pullback resistance. This level may act as a substantial barrier where selling interest could intensify, potentially slowing down the bullish movement in the short term.
The 2nd resistance at 1.1130 is noted as a swing high resistance. Swing highs often mark points of reversal or resistance in price movement and could pose a significant obstacle to further upward movement in the EUR/USD.
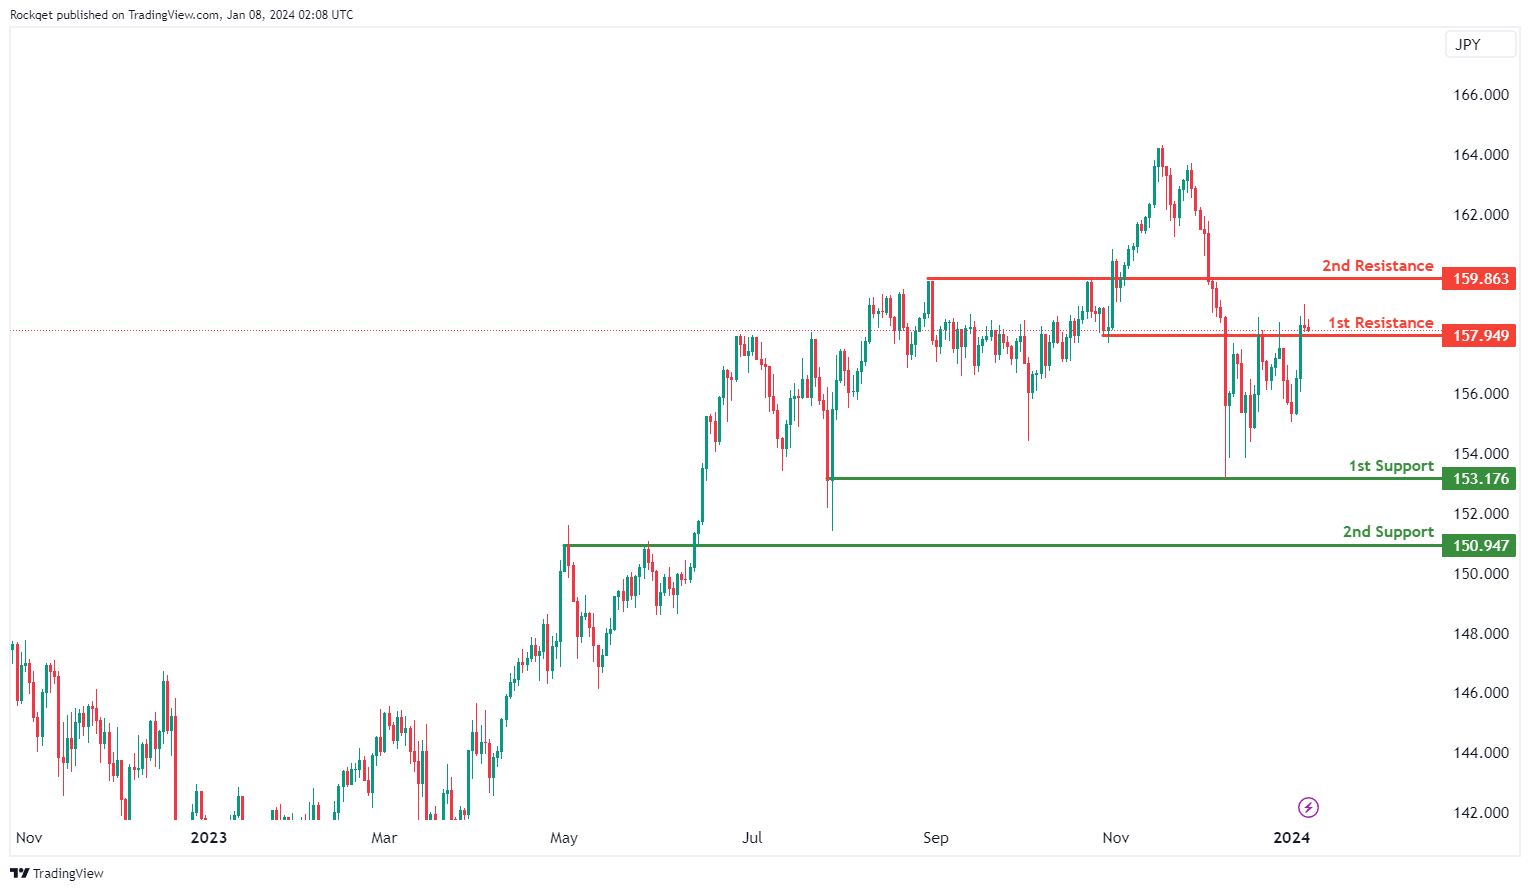
EUR/JPY:
The EUR/JPY chart currently exhibits a bullish overall momentum, indicating an upward trend. There is a potential scenario for a bullish bounce off the 1st support, heading towards the 1st resistance.
The 1st support at 153.18 is considered favourable due to its identification as a multi-swing low support, indicating a historical level where buying interest has previously emerged.
The 2nd support at 150.95 is recognized as an overlap support, adding confluence to its potential as a support level.
On the resistance side, the 1st resistance at 157.95 is identified as an overlap resistance, suggesting historical significance as a level where selling interest may materialise.
The 2nd resistance at 159.86 is also noted as an overlap resistance, adding further significance to this potential barrier for upward movement.
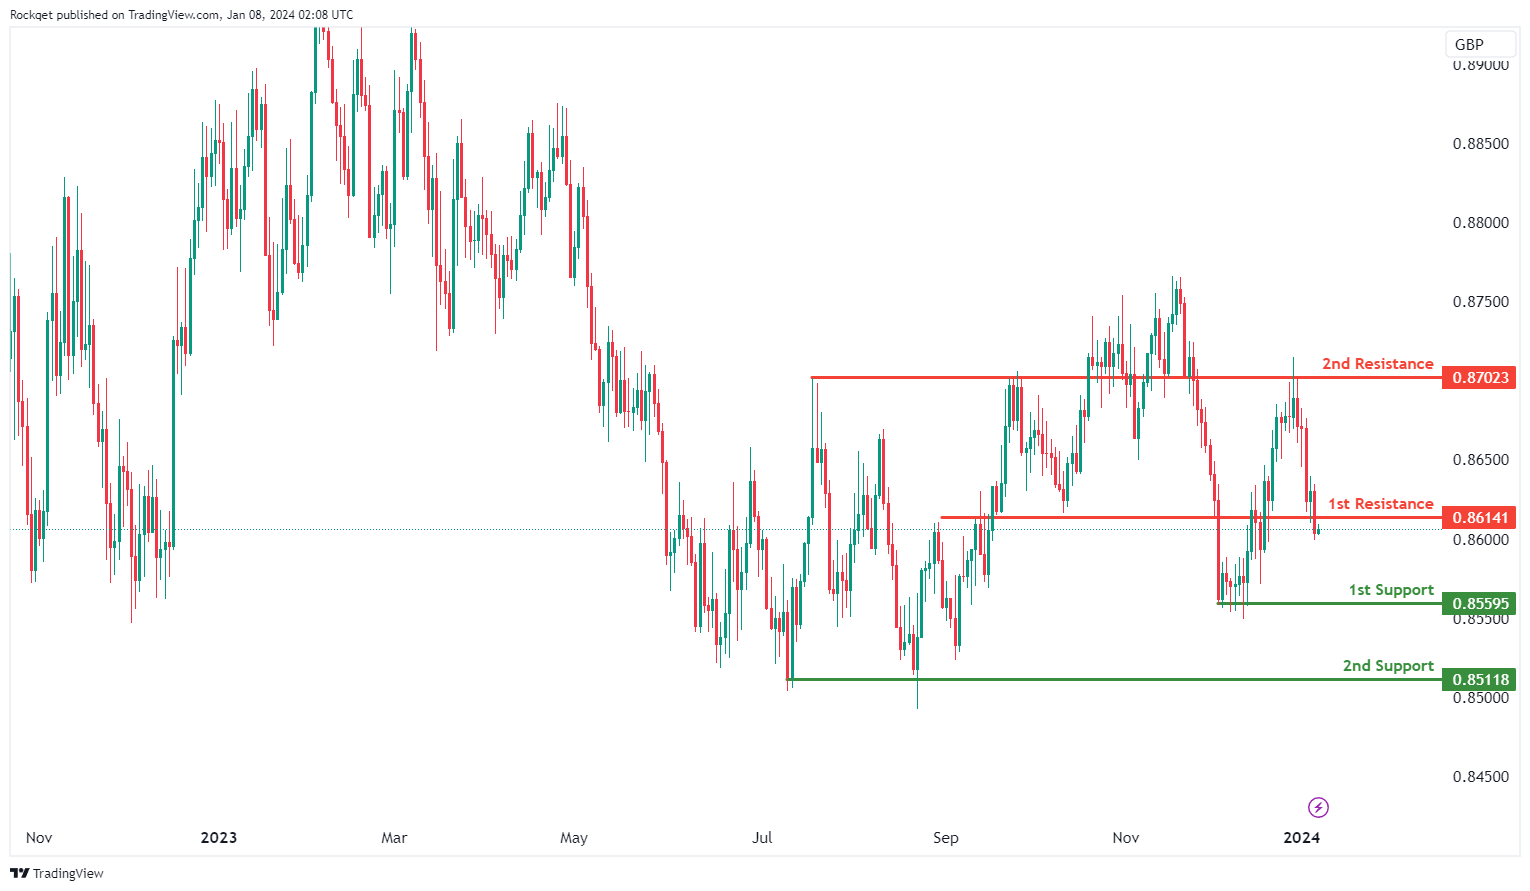
EUR/GBP:
The EUR/GBP chart currently reflects a bearish overall momentum, indicating a downward trend. There is a potential scenario for a bearish reaction off the 1st resistance, leading to a drop towards the 1st support.
The 1st support at 0.8560 is considered favourable as it is identified as a multi-swing low support, indicating historical significance as a level where buying interest has previously emerged.
The 2nd support at 0.8512 is also recognized as a multi-swing low support, adding confluence to its potential as a support level.
On the resistance side, the 1st resistance at 0.8614 is identified as an overlap resistance, suggesting historical significance as a level where selling interest may materialise.
The 2nd resistance at 0.8702 is also noted as an overlap resistance, adding further significance to this potential barrier for upward movement.
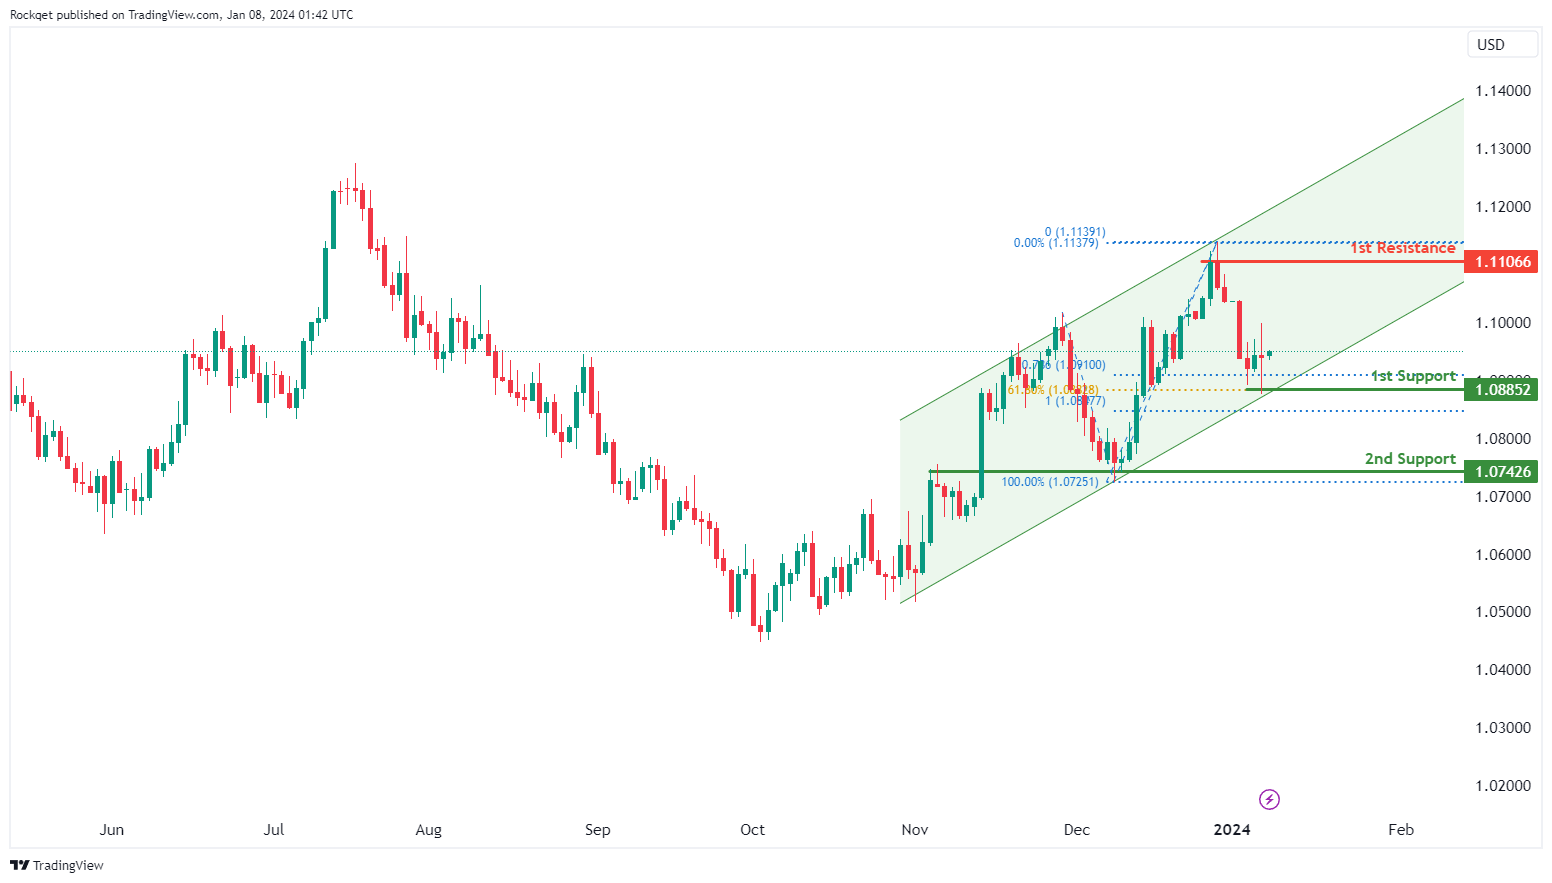
GBP/USD:
The GBP/USD chart currently demonstrates a bullish overall momentum, indicating strength in the British Pound relative to the US Dollar. This bullish momentum is further supported by the presence of a major ascending trendline, suggesting the potential for continued upward movement.
The 1st support level at 1.2495 is significant for several reasons. Firstly, it is identified as an overlap support and it aligns with the 38.20% Fibonacci Retracement level,
The 2nd support at 1.2379 is categorized as an overlap support, further reinforcing its significance as a potential area where buying interest may emerge.
On the resistance side, the 1st resistance at 1.2792 is classified as an overlap resistance, and it could act as a notable barrier where selling interest may intensify.
The 2nd resistance at 1.2899 stands out for aligning with the 78.60% Fibonacci Retracement level, indicating a strong potential resistance zone within the prevailing bullish trend.
Intermediate support at 1.2609 is identified as an overlap support, contributing to the potential support regions within the ascending trend.
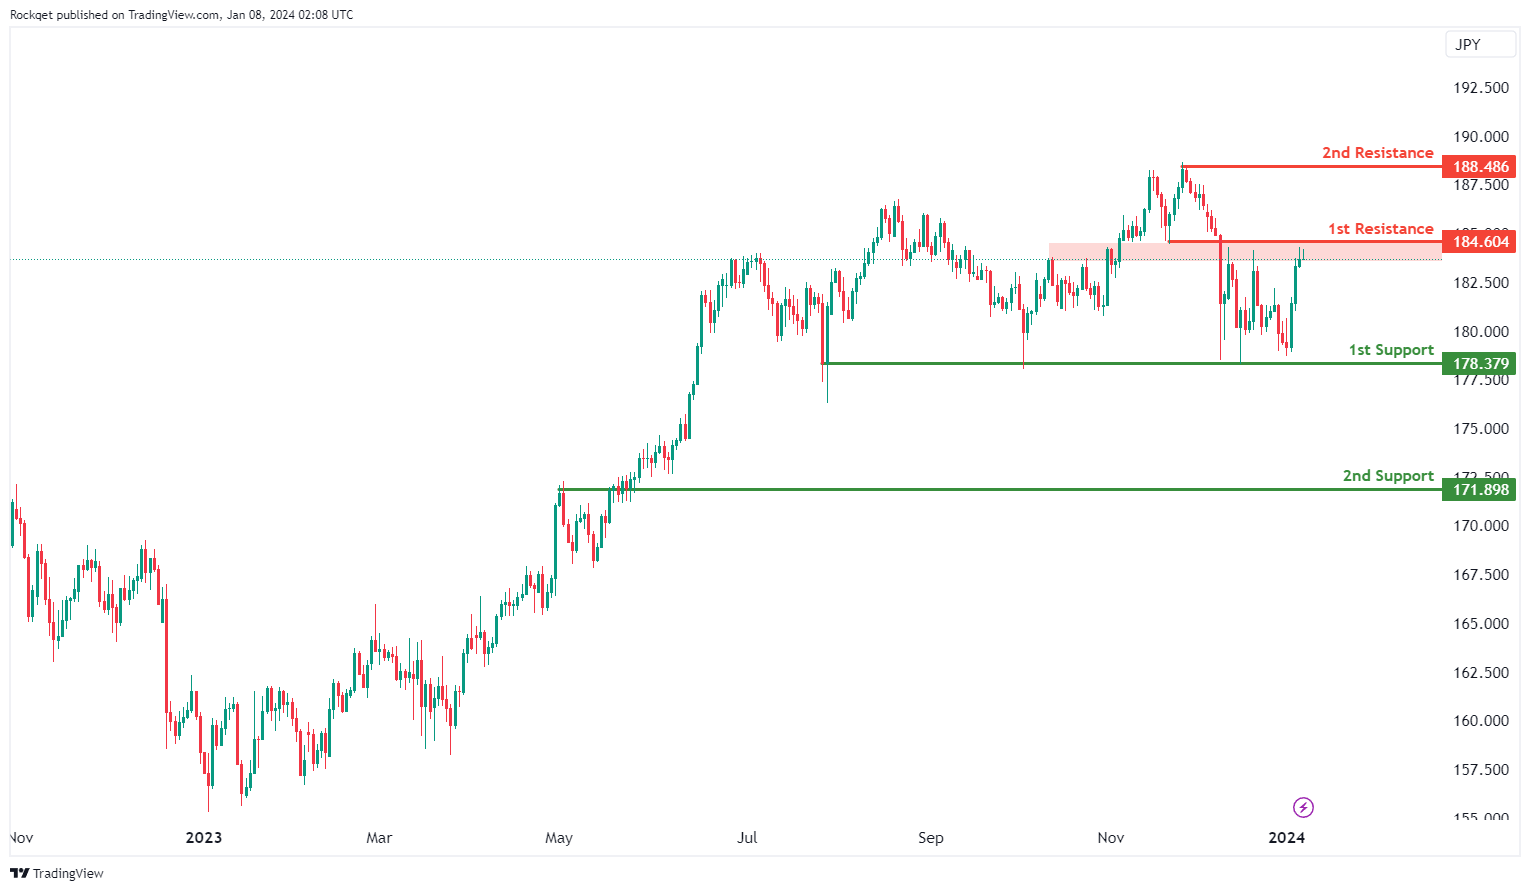
GBP/JPY:
The GBP/JPY chart currently exhibits a bullish overall momentum, suggesting an upward trend. There is a potential scenario for a bullish continuation towards the 1st resistance.
The 1st support at 178.38 is considered favourable as it is identified as a multi-swing low support, indicating historical significance as a level where buying interest has previously emerged.
The 2nd support at 171.90 is recognized as an overlap support, adding confluence to its potential as a support level.
On the resistance side, the 1st resistance at 184.60 is identified as an overlap resistance, suggesting historical significance as a level where selling interest may materialise.
The 2nd resistance at 188.49 is noted as a swing high resistance, adding further significance to this potential barrier for upward movement.
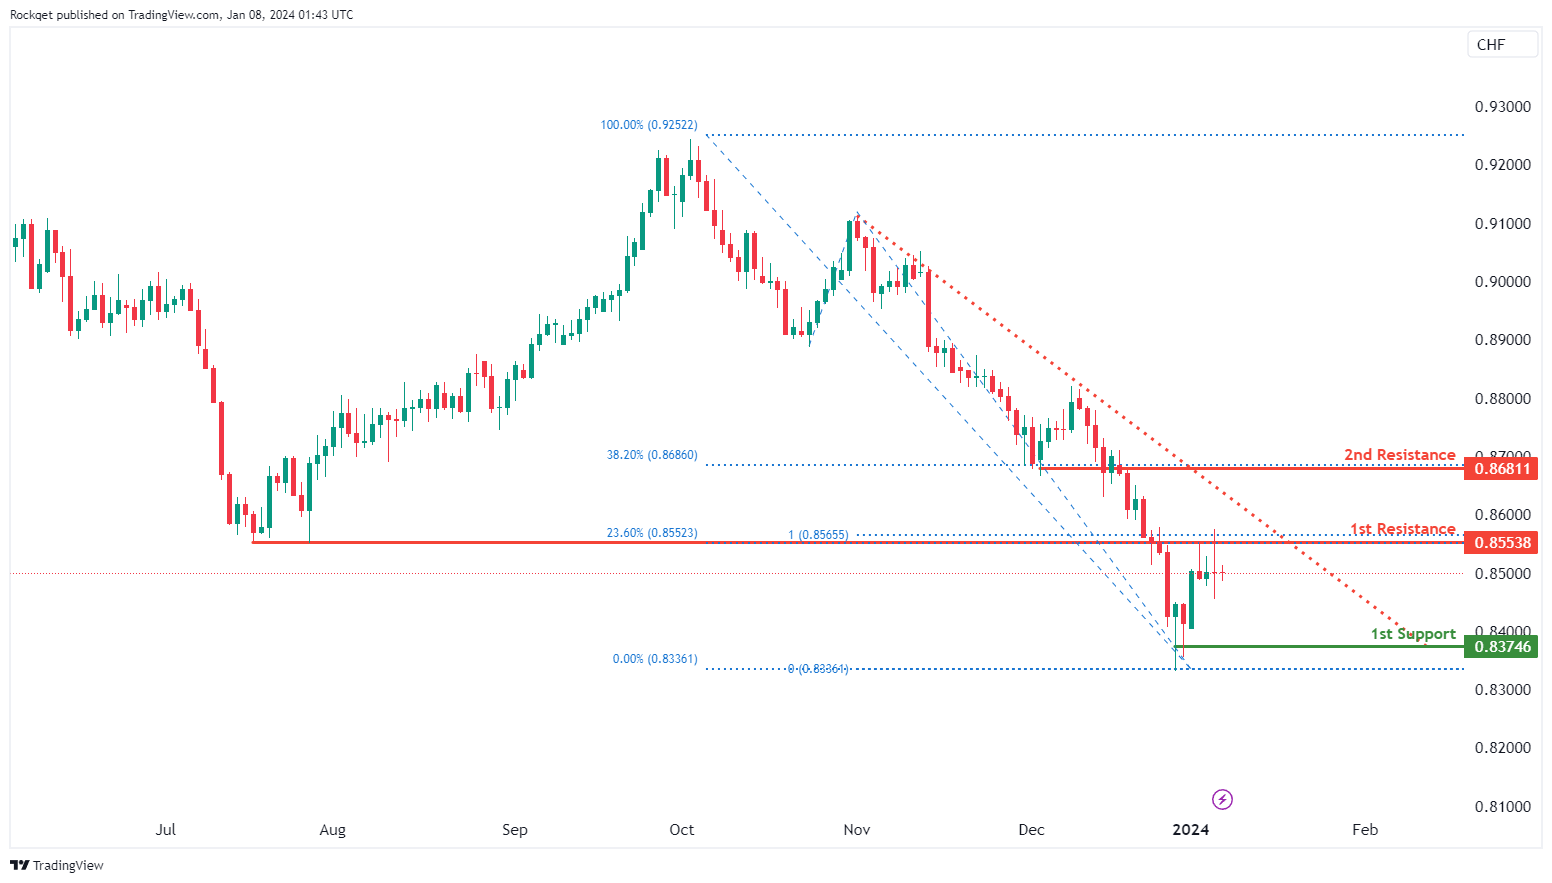
USD/CHF:
The USD/CHF chart currently exhibits a bearish overall momentum, signifying the relative weakness of the US Dollar against the Swiss Franc. This bearish momentum is reinforced by the presence of a major descending trendline, indicating a predisposition for continued downward movement.
The potential scenario suggests a bearish continuation towards the 1st support level at 0.8374. This level holds significance as it aligns with a swing low support, indicating a historical price level where buying interest may arise, providing temporary support for the USD/CHF pair.
On the resistance side, the 1st resistance at 0.8553 stands out for several reasons. Firstly, it is categorized as an overlap resistance, signifying a convergence of technical factors. Additionally, it aligns with the 23.60% Fibonacci Retracement level and the 100% Fibonacci Projection, creating a notable confluence of Fibonacci levels. This confluence reinforces the importance of 0.8553 as a robust potential resistance zone, suggesting that selling interest may intensify at this level.
The 2nd resistance at 0.8681 is identified as an overlap resistance and is further supported by the presence of the 38.20% Fibonacci Retracement level.
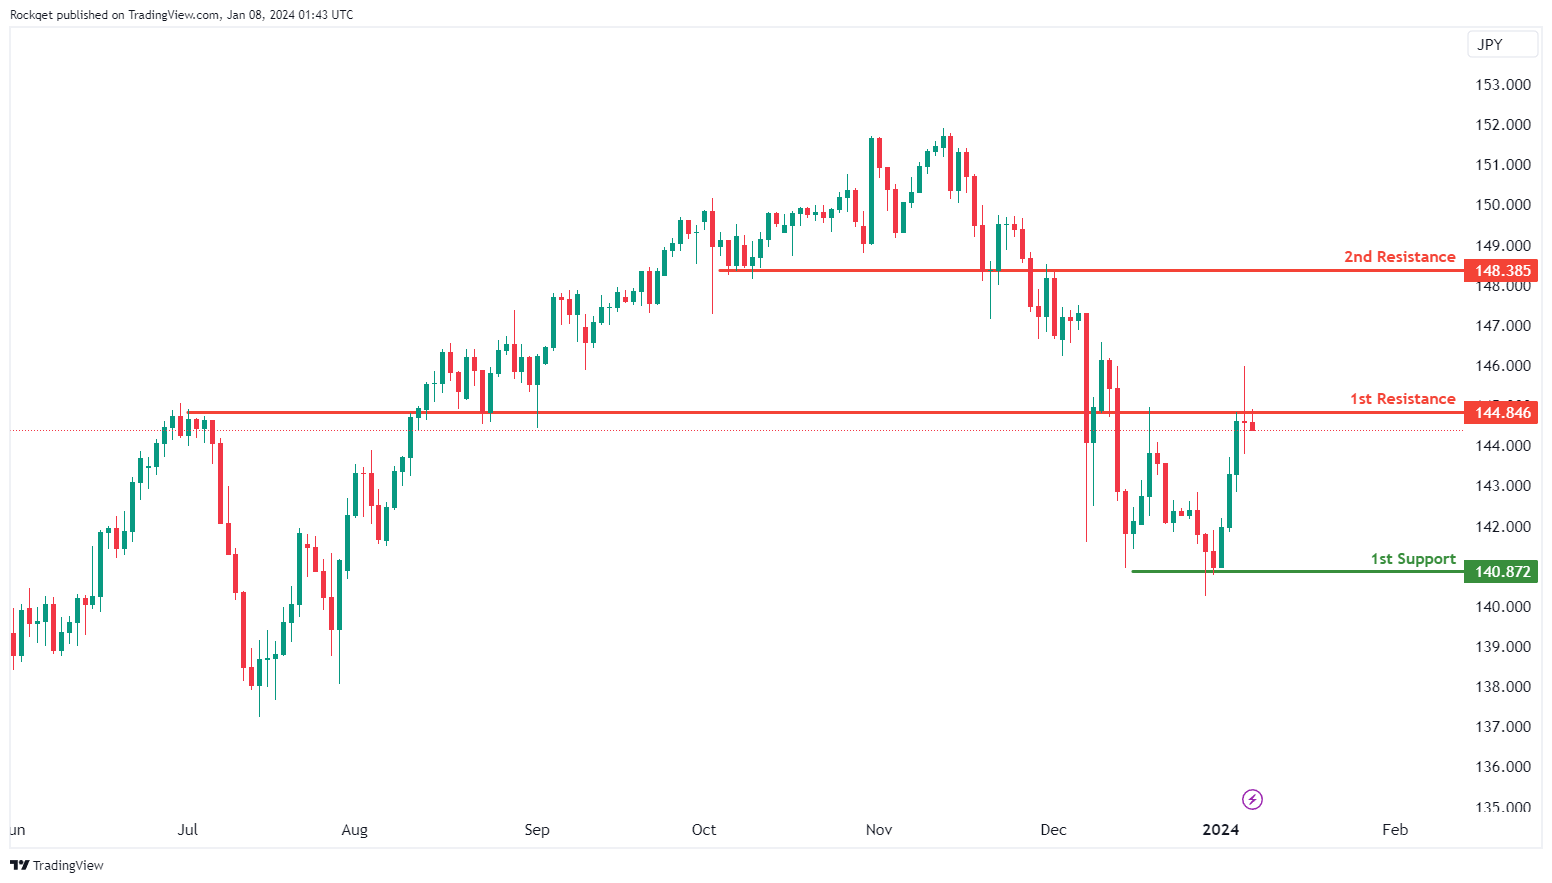
USD/JPY:
The USD/JPY chart currently displays a bearish overall momentum, indicating that the US Dollar is weaker relative to the Japanese Yen. In this scenario, there is a potential for a bearish reaction off the 1st resistance level followed by a drop towards the 1st support.
The 1st support at 140.87 is significant as it represents a multi-swing low support, suggesting that this level has historically attracted buying interest and could potentially act as a support zone in the event of a price decline.
On the resistance side, the 1st resistance at 144.84 is categorized as an overlap resistance, indicating its potential significance as a barrier where selling interest may intensify.
Additionally, the 2nd resistance at 148.38 is also identified as an overlap resistance, further reinforcing its importance as a potential price ceiling.
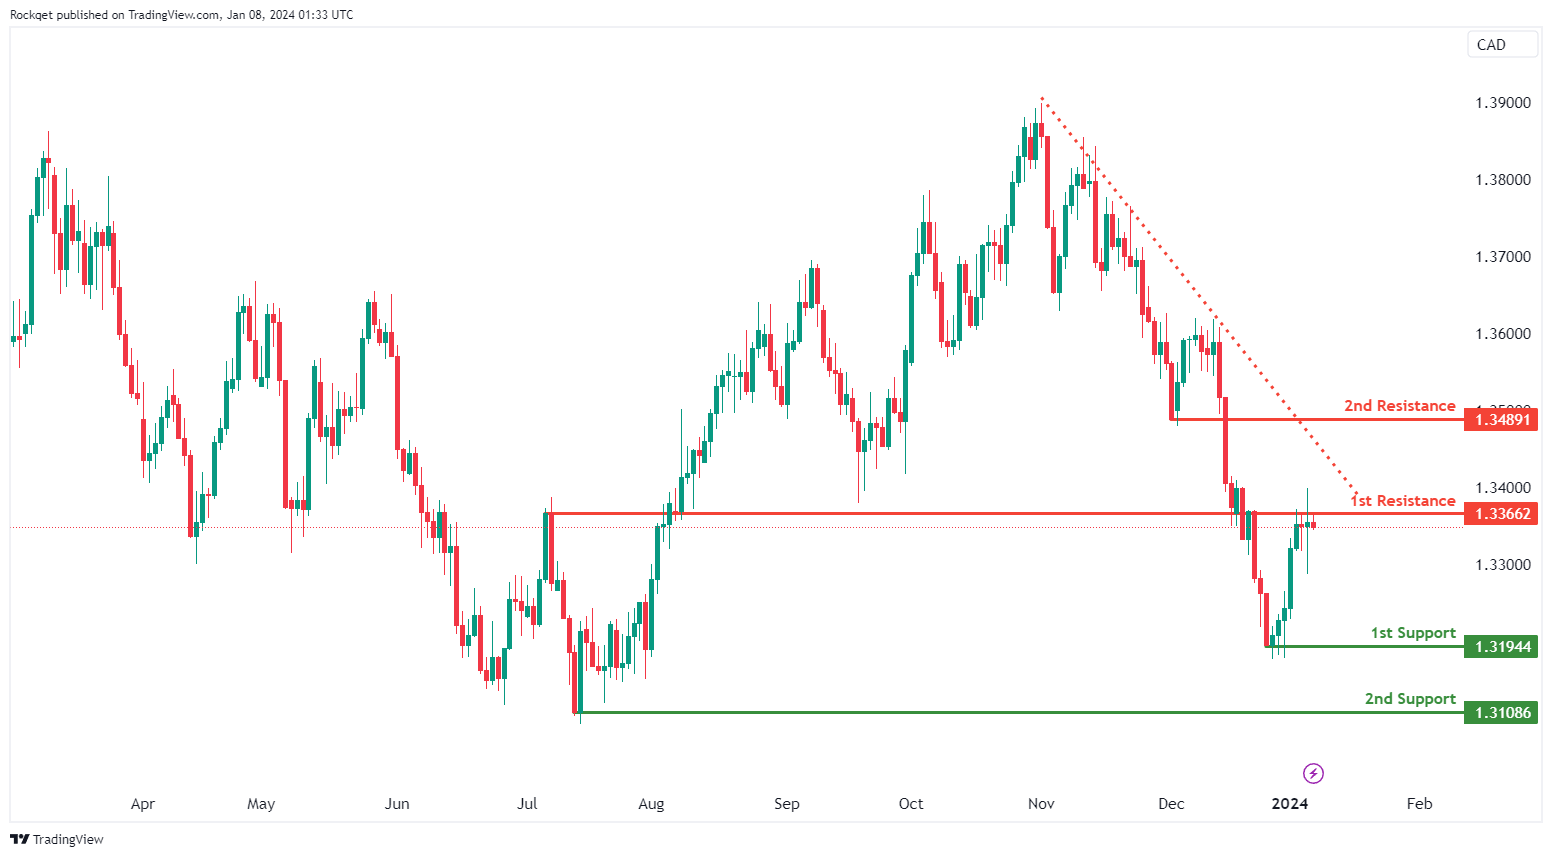
USD/CAD:
The USD/CAD chart currently exhibits an overall bearish momentum, with price trading under the descending trendline. In this context, there is a potential scenario for price to make a bearish reaction off the 1st resistance and drop towards the 1st support.
The 1st resistance level at 1.3366 is identified as an overlap resistance. Higher up, the 2nd resistance level at 1.3489 is noted as a pullback resistance, further reinforcing its significance as a potential resistance zone.
To the downside, the 1st support level at 1.3194 is identified as a swing-low support. Further below, the 2nd support level at 1.3108 is also marked as a swing-low support, further reinforcing its importance as a key support level.
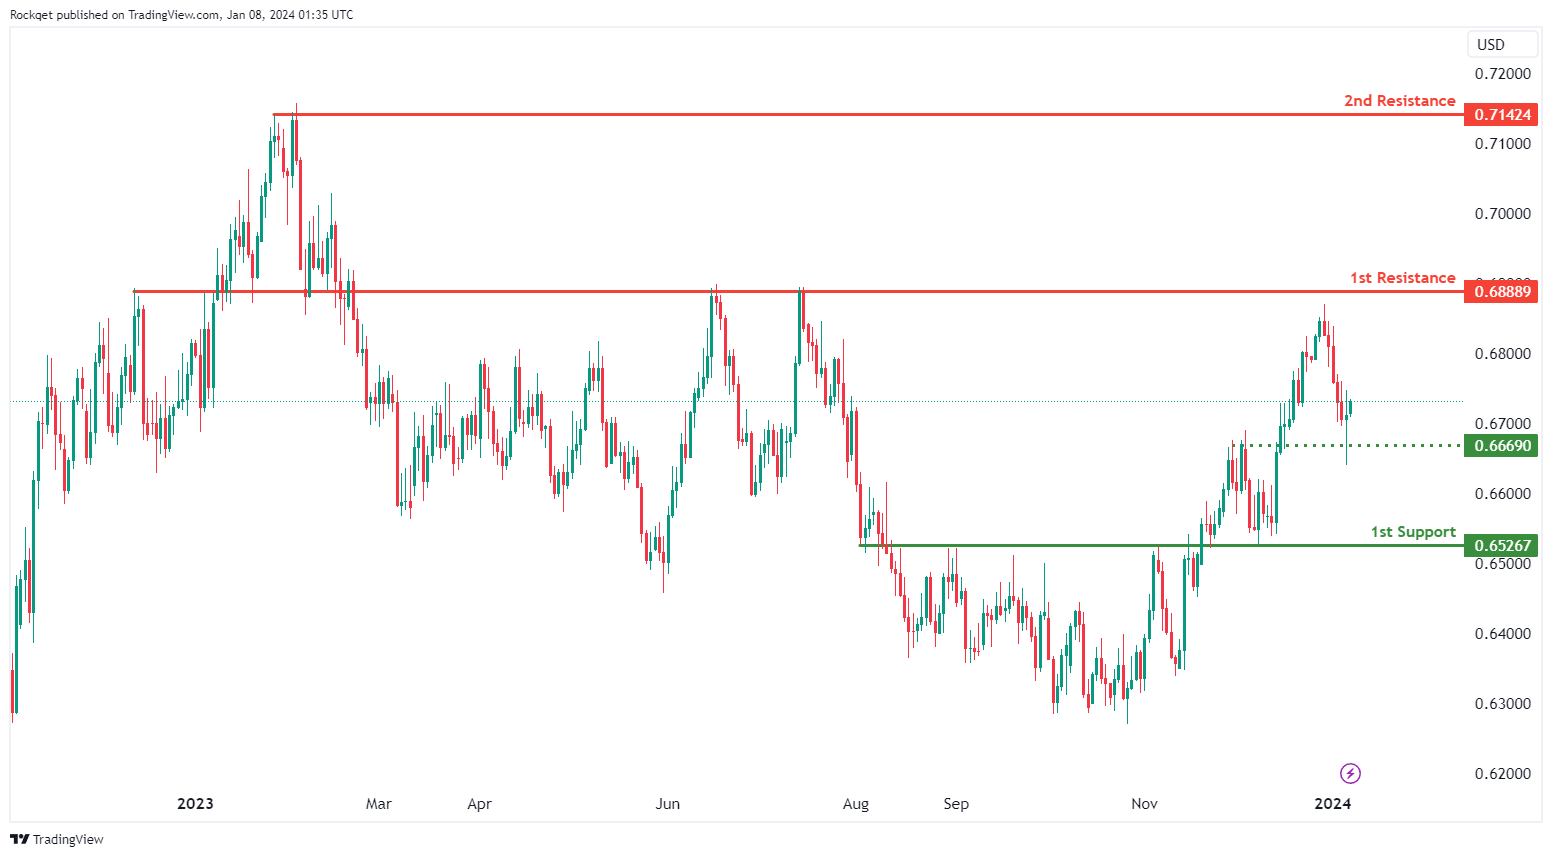
AUD/USD:
The AUD/USD chart currently exhibits an overall bullish momentum. In this context, there is a potential scenario for price to make a bullish continuation towards the 1st resistance.
The 1st resistance level at 0.6888 is identified as an overlap resistance. Higher up, the 2nd resistance level at 0.7142 is noted as a swing-high resistance, suggesting a potential barrier for further upside movement.
To the downside, the intermediate support level at 0.6669 is identified as an overlap support. Further below, the 1st support level at 0.6526 is also marked as an overlap support, further reinforcing its importance as a key support level.
NZD/USD
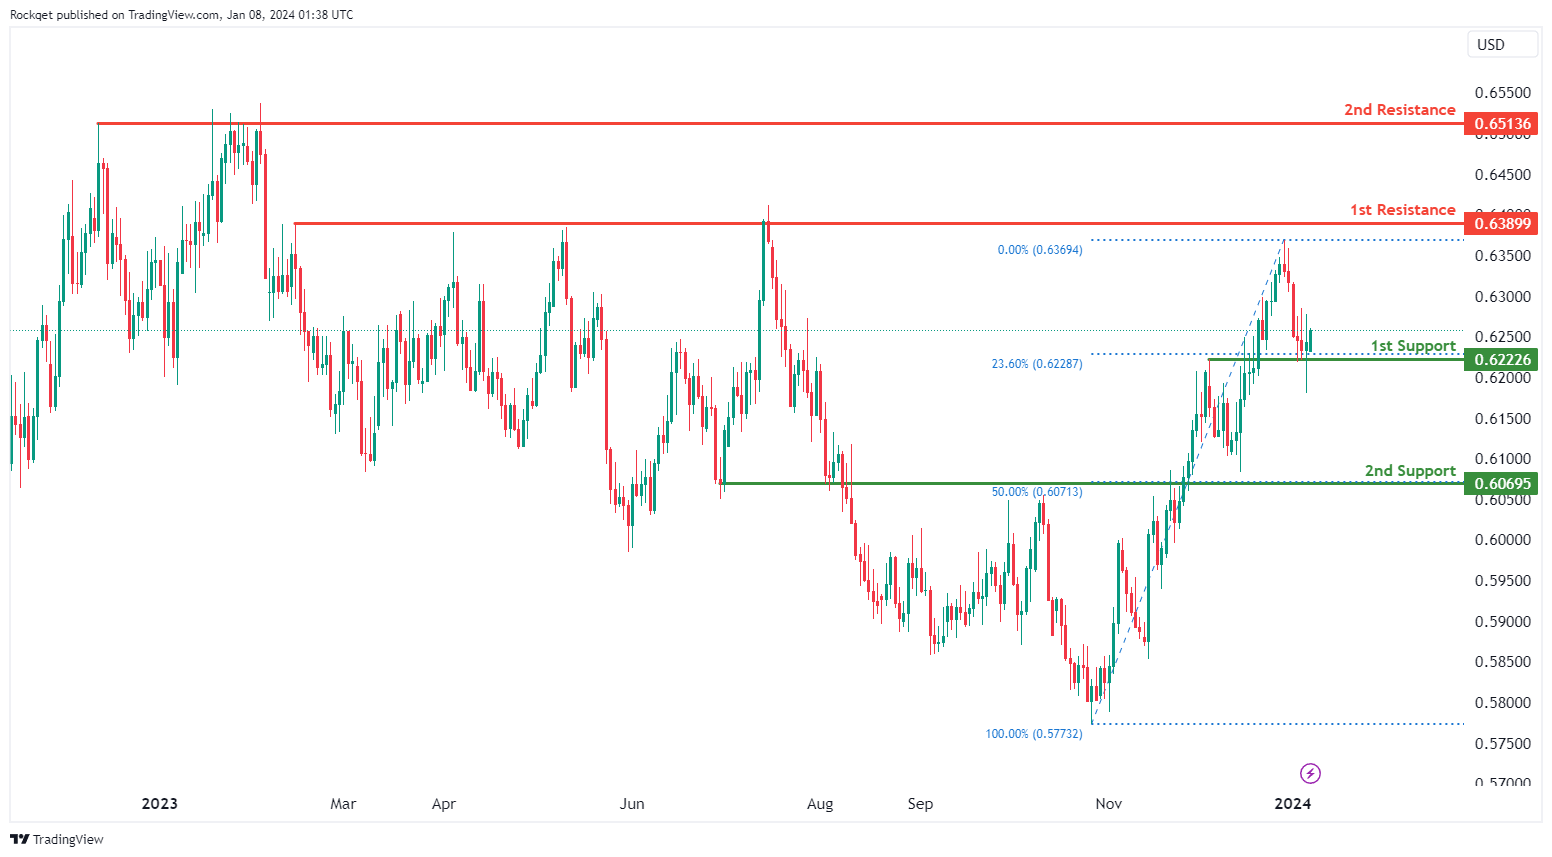
The NZD/USD chart currently exhibits an overall bullish momentum. In this context, there is a potential scenario for price to make a bullish continuation towards the 1st resistance.
The 1st resistance level at 0.6389 is identified as a multi-swing-high resistance. Higher up, the 2nd resistance level at 0.6513 is also noted as a multi-swing-high resistance, suggesting a potential barrier for further upside movement.
To the downside, the 1st support level at 0.6222 is identified as an overlap support that aligns with the 23.60% Fibonacci retracement level. Further below, the 2nd support level at 0.6069 is also marked as an overlap support that aligns with the 50.00% Fibonacci retracement level, further reinforcing its importance as a key support level.
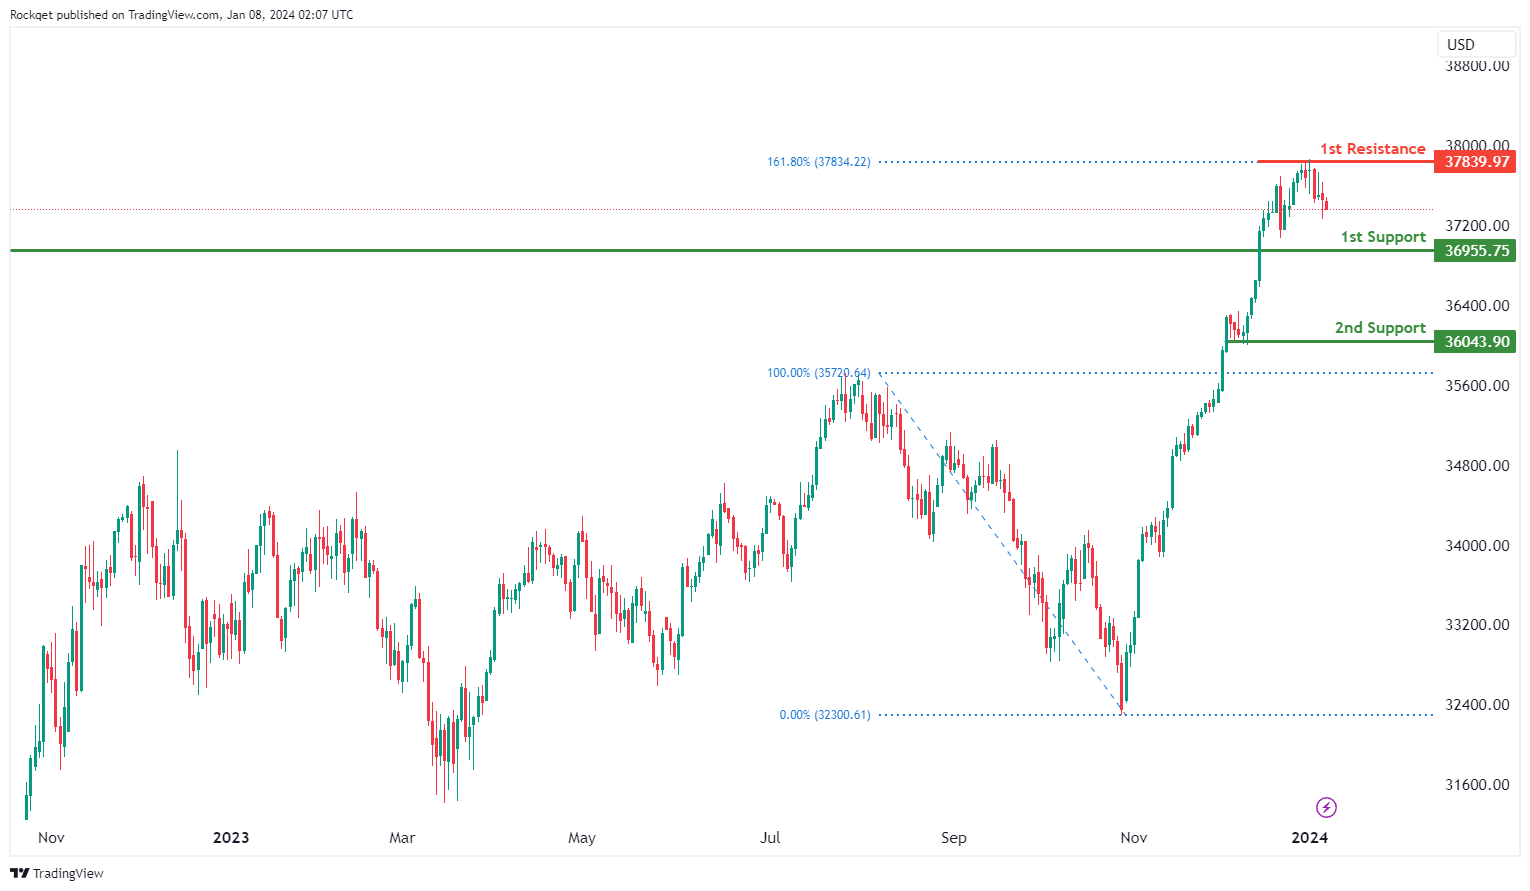
DJ30:
The DJ30 chart currently exhibits a bearish overall momentum, indicating a downward trend. There is a potential scenario for a bearish continuation towards the 1st support.
The 1st support at 36955.75 is considered favourable as it is identified as a pullback support, indicating a level where buying interest has previously emerged.
The 2nd support at 36043.90 is also recognized as a pullback support, adding confluence to its potential as a support level.
On the resistance side, the 1st resistance at 37839.97 is identified as a swing high resistance and coincides with the 161.80% Fibonacci Extension, suggesting historical significance as a level where selling interest may materialise.
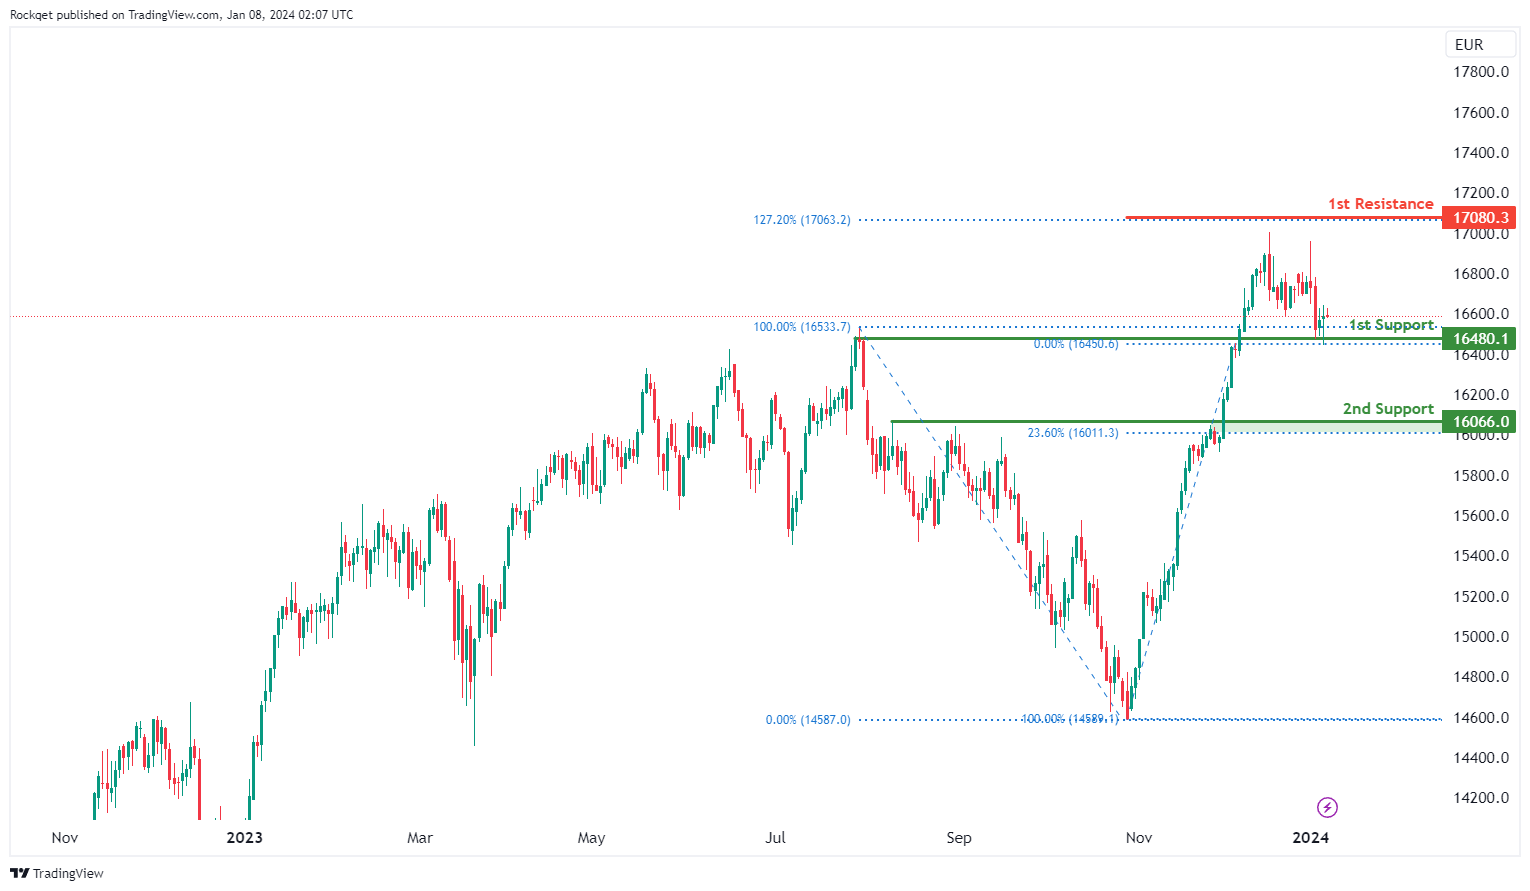
GER40:
The GER40 chart currently displays a bullish overall momentum, indicating an upward trend. There is a potential scenario for a bullish bounce off the 1st support towards the 1st resistance.
The 1st support at 16480.10 is considered favourable due to its identification as an overlap support, suggesting historical significance as a level where buying interest has previously emerged.
The 2nd support at 16066.00 is recognized as a pullback support and coincides with the 23.60% Fibonacci Retracement, adding confluence to its potential as a support level.
On the resistance side, the 1st resistance at 17080.30 is noteworthy for being associated with the 127.20% Fibonacci Expansion, indicating a level where selling interest could materialise.
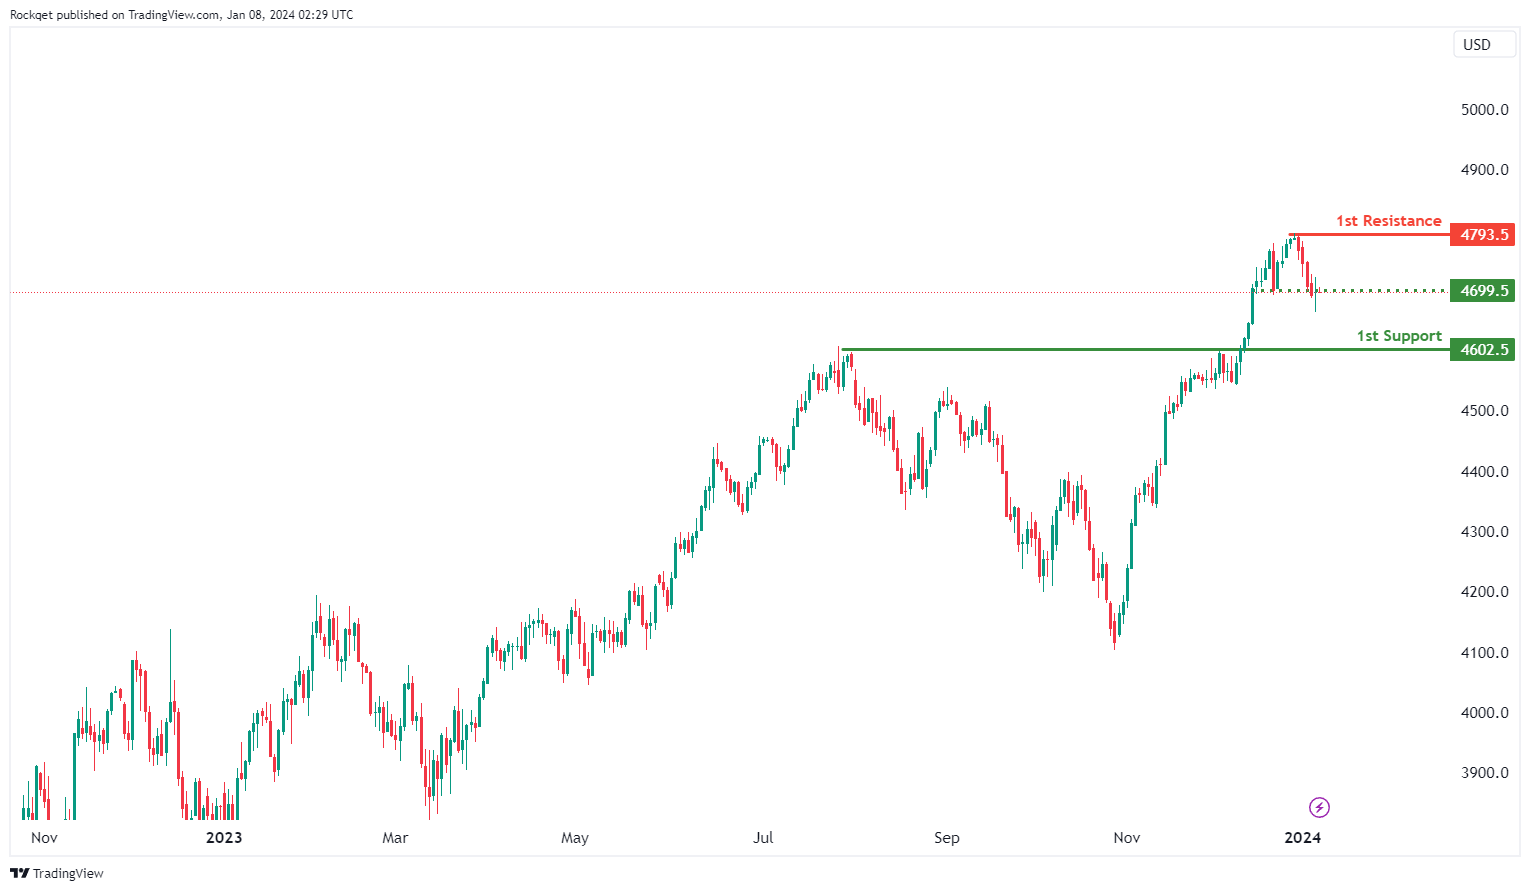
US500:
The US500 chart currently exhibits a bearish overall momentum, indicating a downward trend. Contributing factors to this momentum suggest the potential for a bearish continuation towards the 1st support.
The intermediate support at 4699.5 is considered significant as it represents a pullback support, implying a level where buying interest has previously emerged during pullback phases.
The 2nd support at 4602.5 is identified as an overlap support, adding to its potential significance as a level where historical price action suggests increased buying interest.
On the resistance side, the 1st resistance at 4793.5 is noted for being associated with swing high resistance, indicating a level where selling interest could materialise.
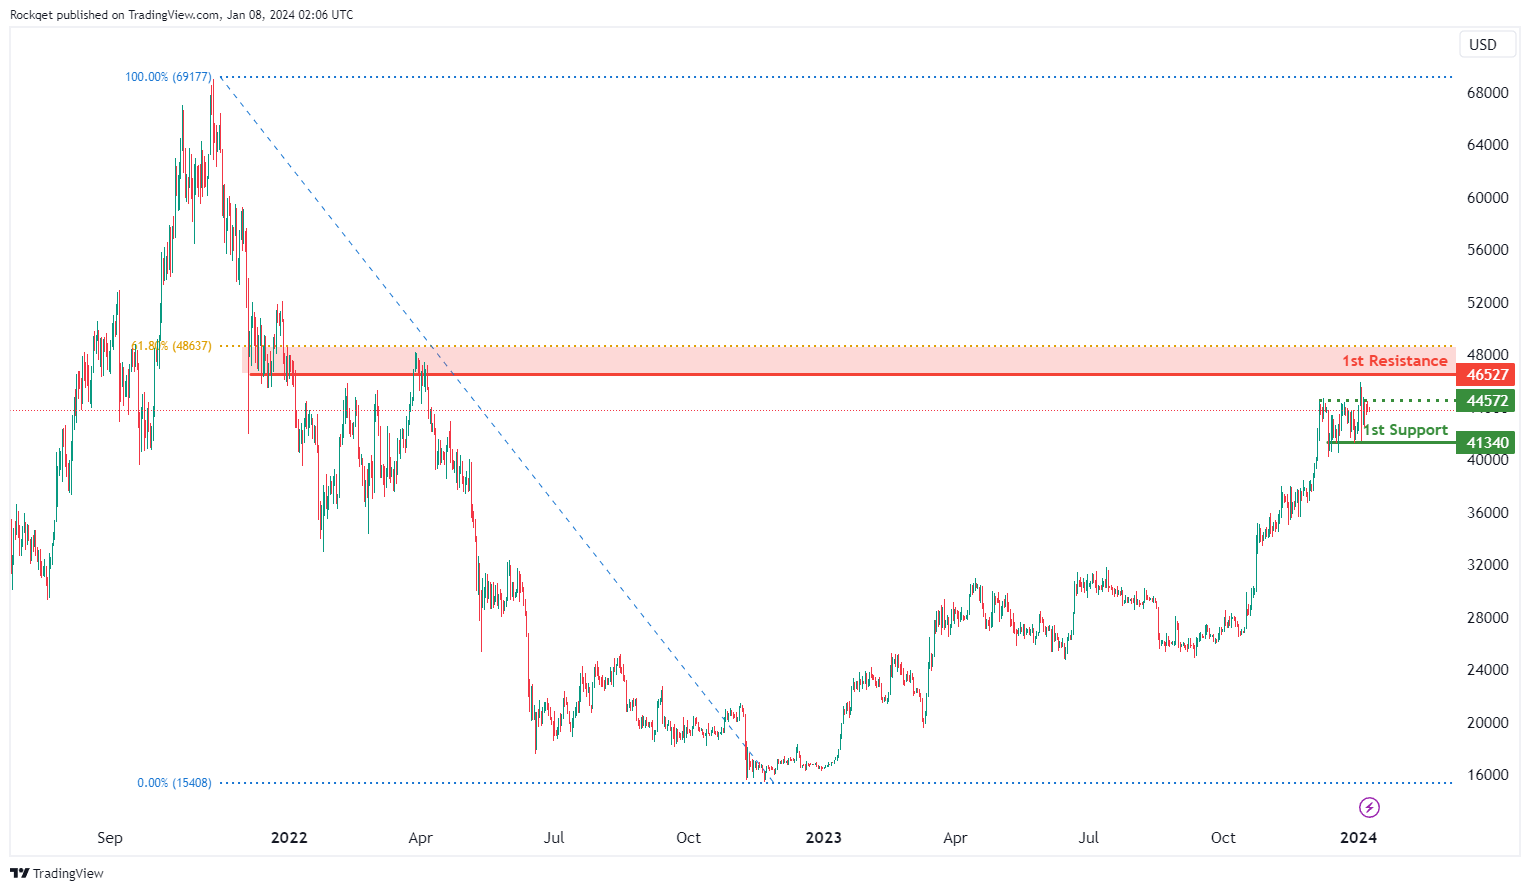
BTC/USD:
The BTC/USD chart currently reflects a neutral overall momentum, suggesting a lack of a clear trend direction. There is a potential scenario for price to fluctuate between the 1st resistance and 1st support levels.
The intermediate support at 44572 is considered significant as it represents a pullback support, indicating a level where buying interest has previously emerged during pullback phases.
The 1st support at 41340 is identified as a multi-swing low support, further emphasising its potential as a key level where historical buying interest has been observed.
On the resistance side, the 1st resistance at 46527 is noted for being associated with an overlap resistance and the 61.80% Fibonacci Retracement level. This suggests a level where historical selling interest and potential price reversal could occur.
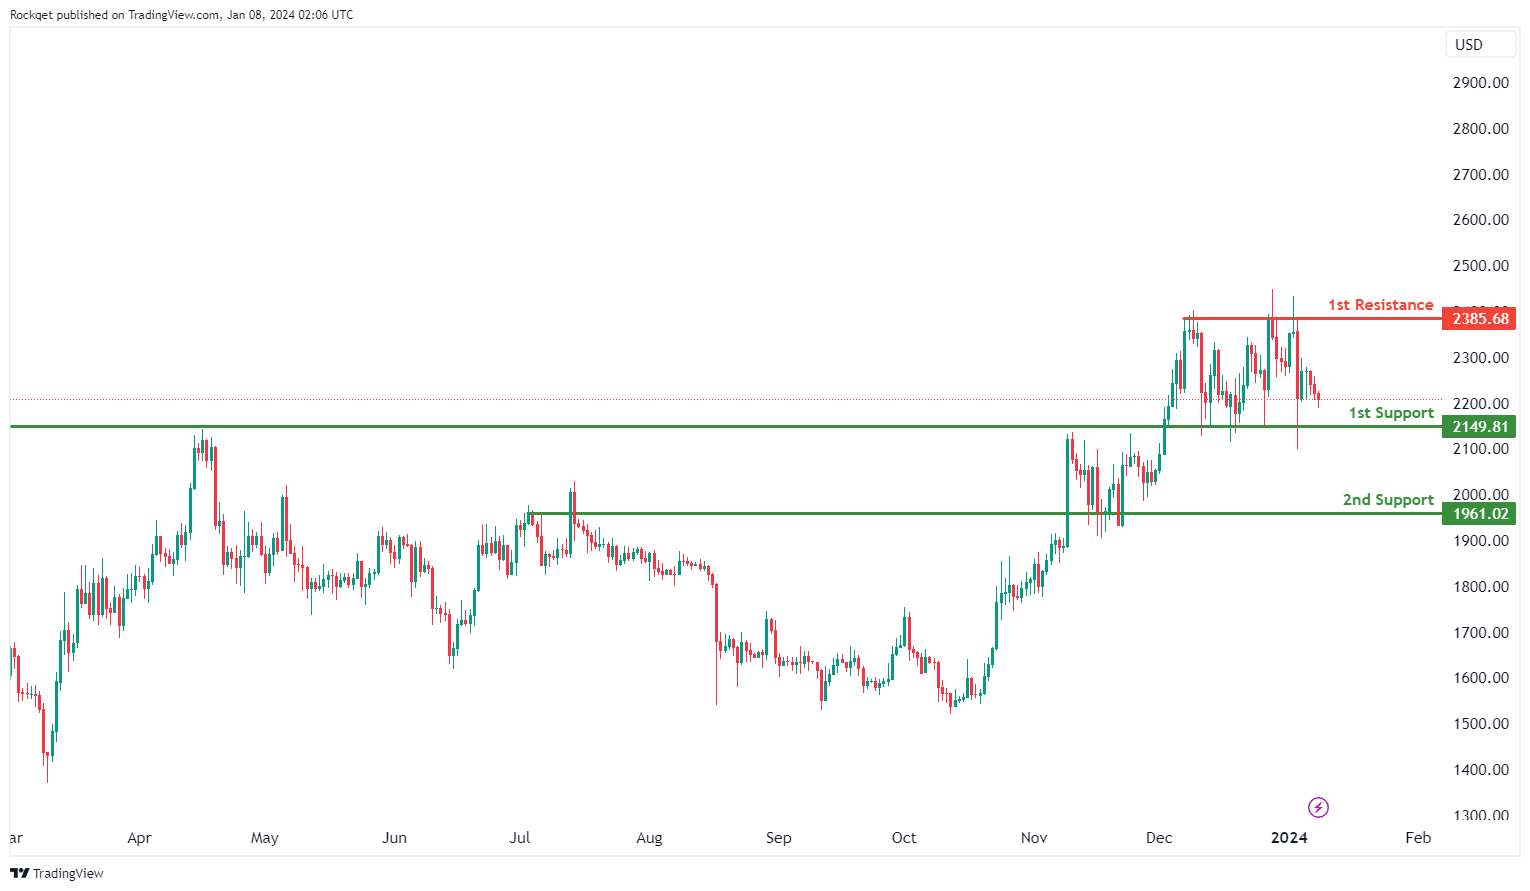
ETH/USD:
The ETH/USD chart currently exhibits a bearish overall momentum, indicating a downward trend. There is a potential scenario for a bearish continuation towards the 1st support.
The 1st support at 2149.81 is considered significant as it is associated with an overlap support, suggesting a historical level where buying interest has previously emerged.
Additionally, the 2nd support at 1961.02 is identified as another overlap support, adding further significance to this level as a potential area for buying interest.
On the resistance side, the 1st resistance at 2385.68 is noted for being a multi-swing high resistance. This level may act as a barrier where historical selling interest and potential price reversal could occur.
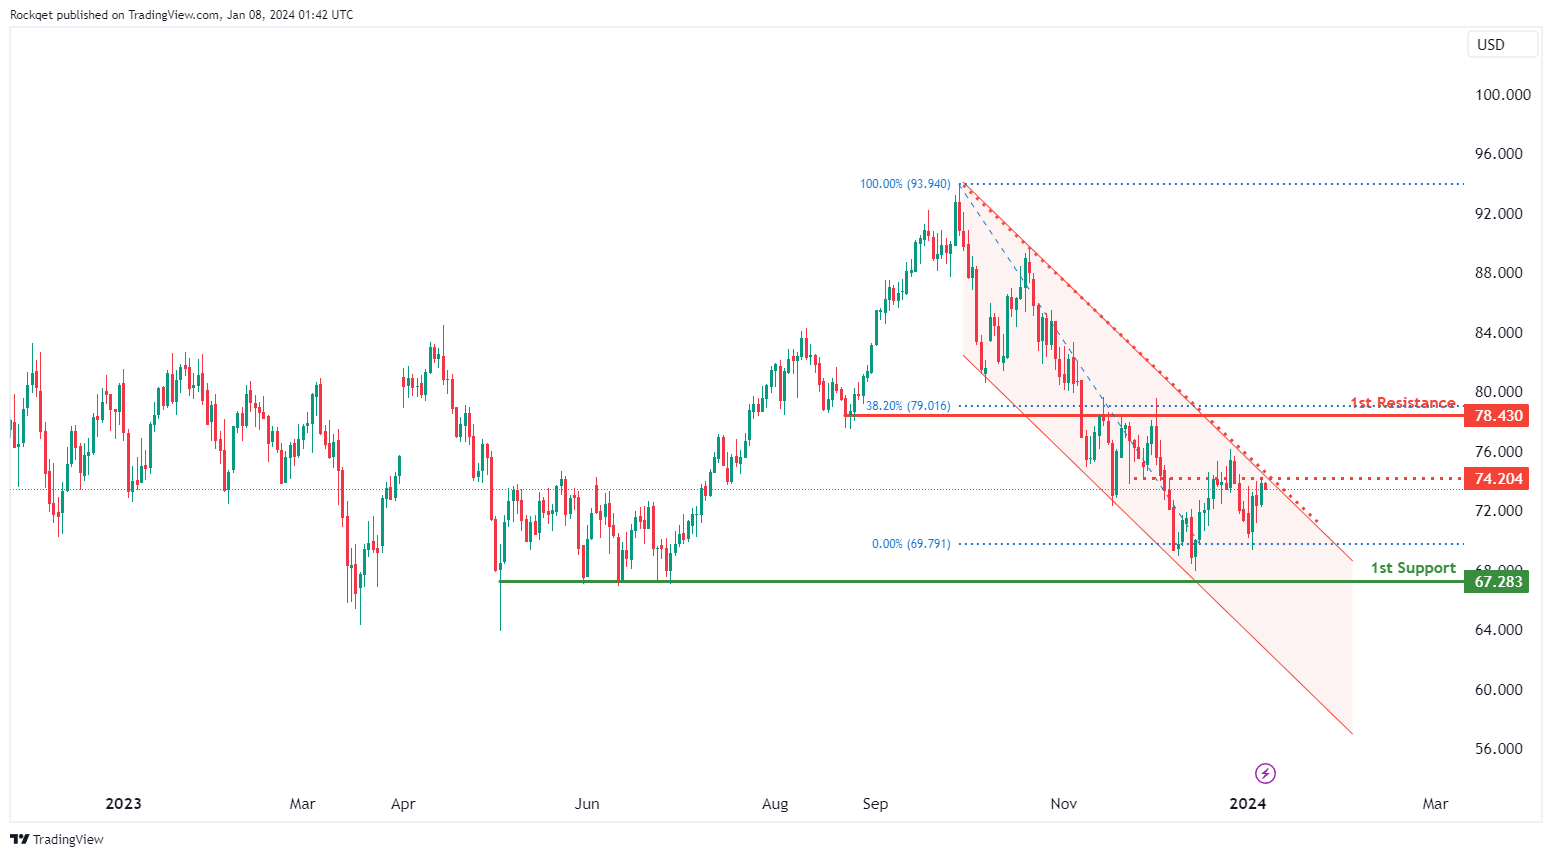
WTI/USD:
The WTI (West Texas Intermediate) chart currently exhibits an overall bearish momentum, with price trading within a bearish channel. In this context, there is a potential scenario for price to make a bearish reaction off the intermediate resistance and drop towards the 1st support.
The intermediate resistance level at 74.20 is identified as an overlap resistance. Higher up, the 2nd resistance level at 78.43 is also noted as an overlap resistance that aligns close to the 38.20% Fibonacci retracement level, suggesting a potential barrier for further upside movement.
On the downside, the 1st support level at 67.28 is identified as a multi-swing-low support, further reinforcing its importance as a key support level.
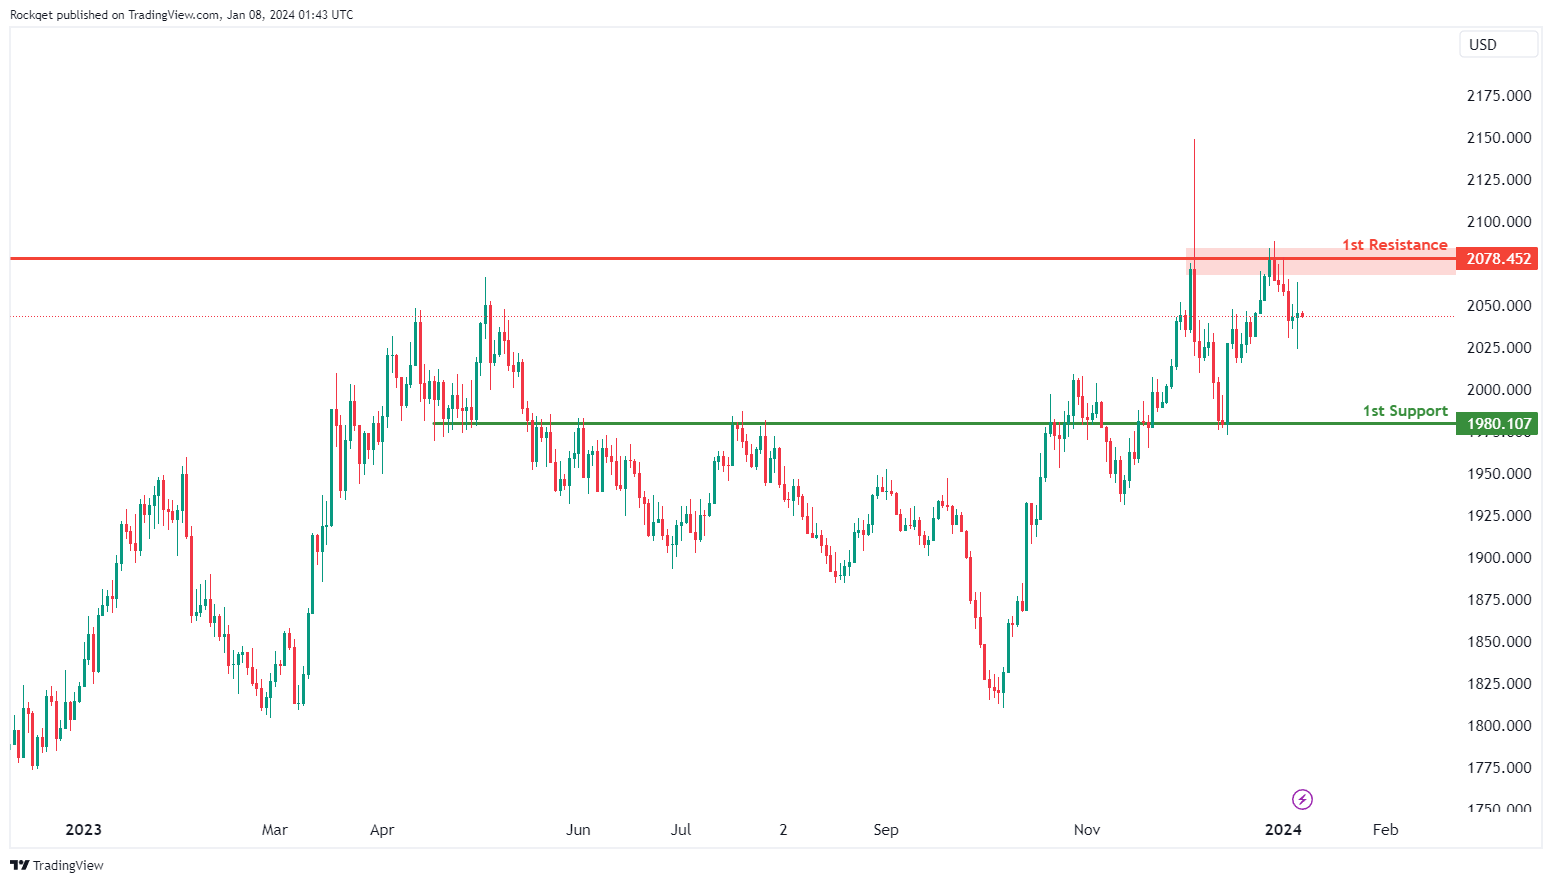
XAU/USD (GOLD):
The XAU/USD chart currently exhibits a bearish overall momentum, indicating weakness in the price of gold relative to the US Dollar. In this context, there is a potential for a bearish continuation towards the 1st support level.
The 1st support at 1980.10 is considered significant as it aligns with an overlap support level. This suggests that it is a price point where buying interest has historically emerged, potentially offering temporary support to the XAU/USD pair.
On the resistance side, the 1st resistance at 2078.45 is identified as an overlap resistance. This level may act as a substantial barrier where selling interest could intensify.
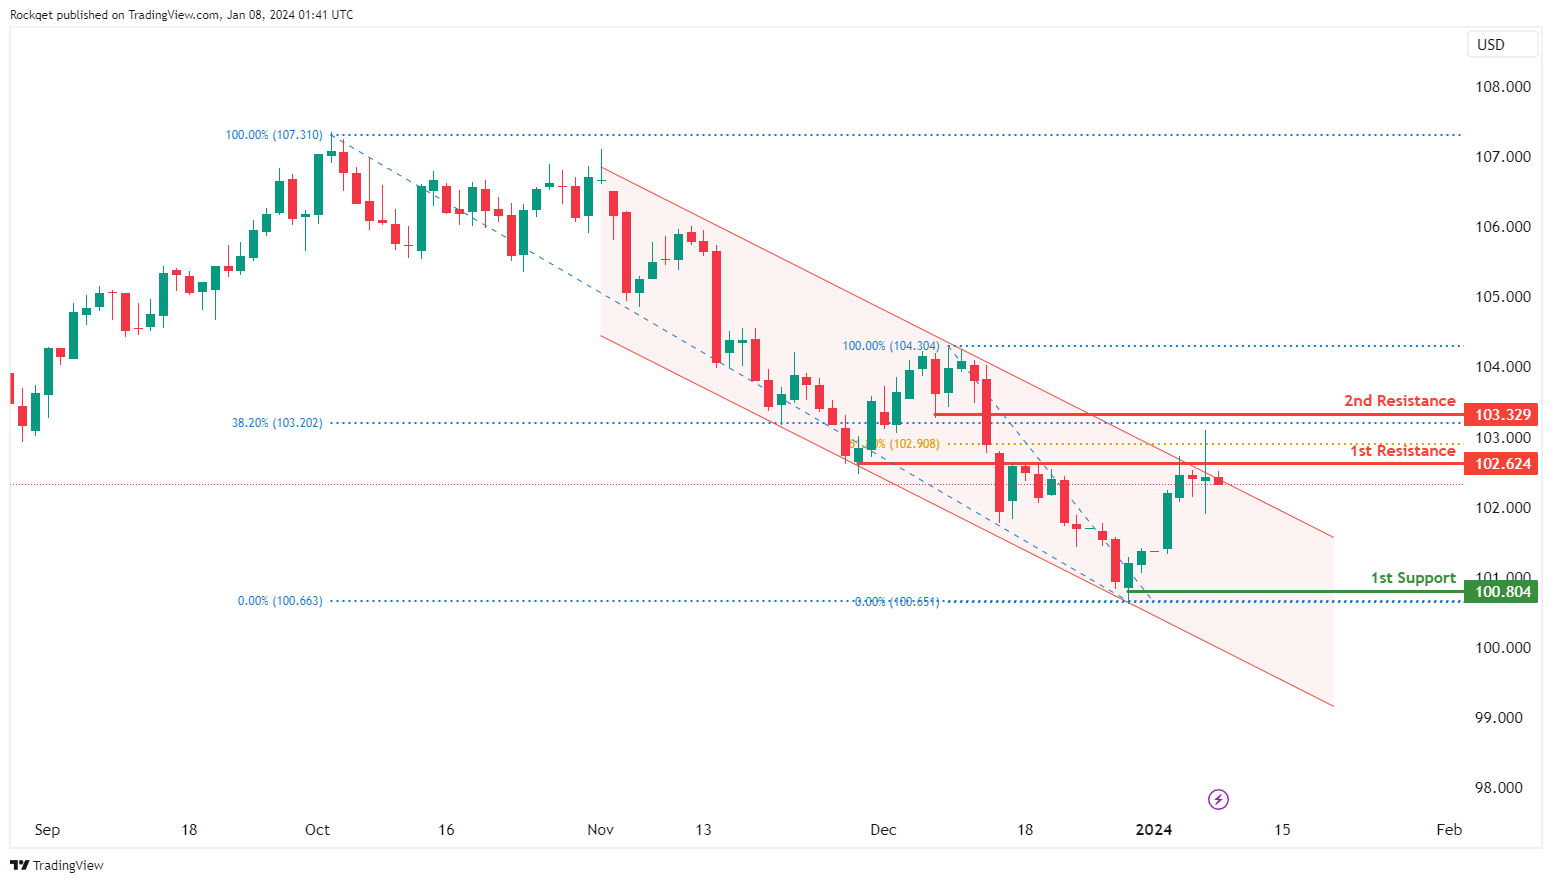
USD/JPY Technical: US Dollar Strength Fizzled Out Ex-Post US NFP
- Last week’s broad-based US dollar strength has dissipated ex-post US non-farm payroll data with the continuation of its underperformance against the GBP.
- The US labour market has started to show growing slack where the labour force participation rate has dipped to 62.5%, its largest monthly decline in almost three years and full-time unemployment recorded its steepest drop since April 2020.
- Bearish reversal conditions seen on the USD/JPY after the prior 5-day rebound suggest the potential continuation of medium-term JPY strength.
- Watch the 146.70 key resistance of USD/JPY.
The price actions of USD/JPY have pierced upwards as expected to print an intraday high of 145.98 in last Friday, 5 January (72 pips shy of the 146.70 key resistance as highlighted in our earlier analysis) upon the release of the US non-farm payrolls (NFP) data for December; the headline number of jobs added rose more than expected (+216K versus +170K consensus), and above the downward revised +173K in November.
Overall, the total jobs gain in the US for 2023 hit 2.7 million, the smallest annual gain since 2019 excluding the Covid pandemic year of 2020, and December’s +216K added jobs was still slightly below the 12-month average of +225K.
Growing slack in the US labour market
Also, the other key components of the jobs report have been lacklustre as highlighted by a steep drop in the labour force participation rate where it declined by 0.3 percentage points to 62.5% in December, the largest monthly decline in almost three years. In addition, full-time unemployment decreased to 133,196K in December from 134,727K in November, the steepest drop since April 2020.
Overall, the mixed US jobs report for December has indicated the prior US Federal Reserve’s interest rate hike cycle has started to inflict some adverse impact on the labour market which in turn keeps the expectation of a Fed dovish pivot “alive” in 2024.
US 2-year Treasury yield premium shrinkage is supporting a fresh leg of potential USD weakness
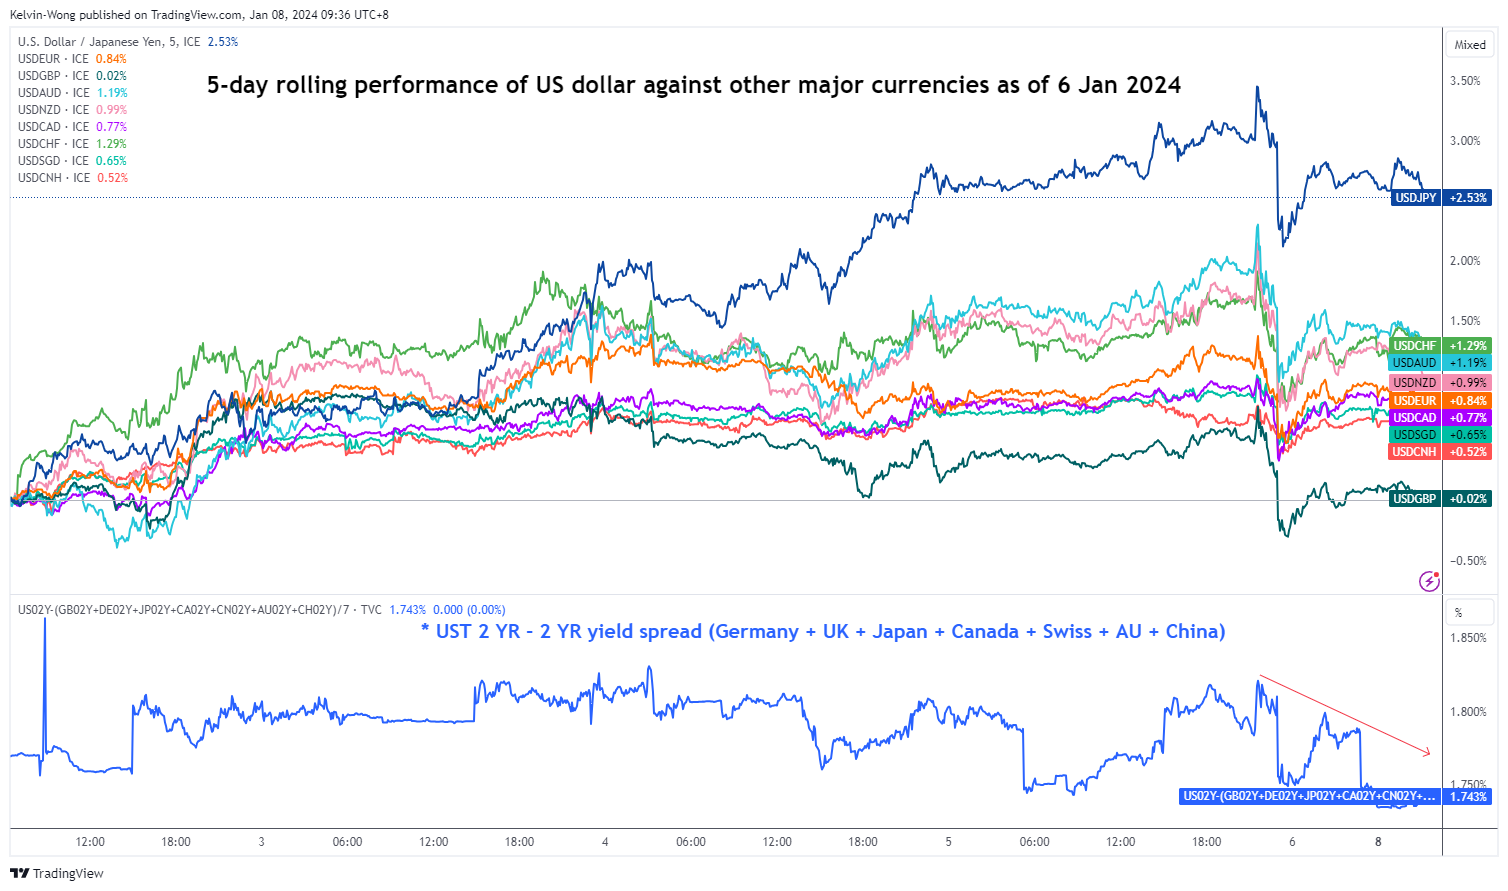
The US dollar strength has dissipated ex-post NFP release where the USD/JPY (the strongest USD outperformer) declined from a peak of +3.5% printed last week to +2.6% based on a 5-day rolling performance basis at this time of the writing.
Also, the USD has continued its underperformance against the GBP (unchanged for now).
The yield premium shrinkage of the US 2-year treasury yield over the rest of the world’s 2-year sovereign bond yields (an equal average of Germany, UK, Japan, Canada, Switzerland, Australia & China) has reinforced the current bullish exhaustion seen in the US dollar strength where it has declined by 9 basis points to 1.74% from a peak of 1.83% printed last week.
Bearish reversal conditions emerged in USD/JPY
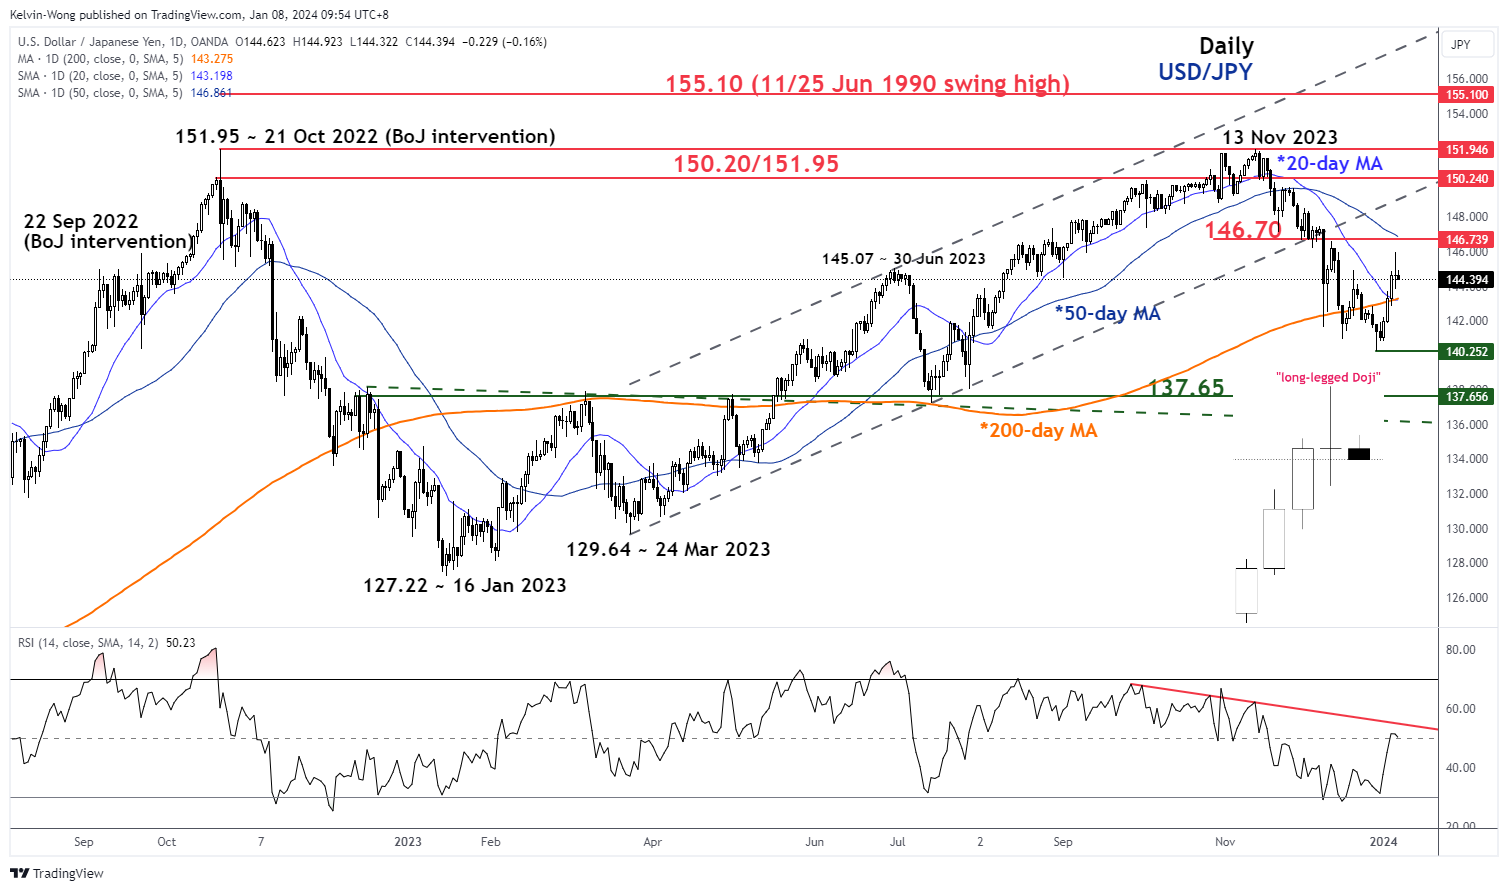
Fig 2: USD/JPY medium-term trend as of 8 Jan 2024 (Source: TradingView, click to enlarge chart)
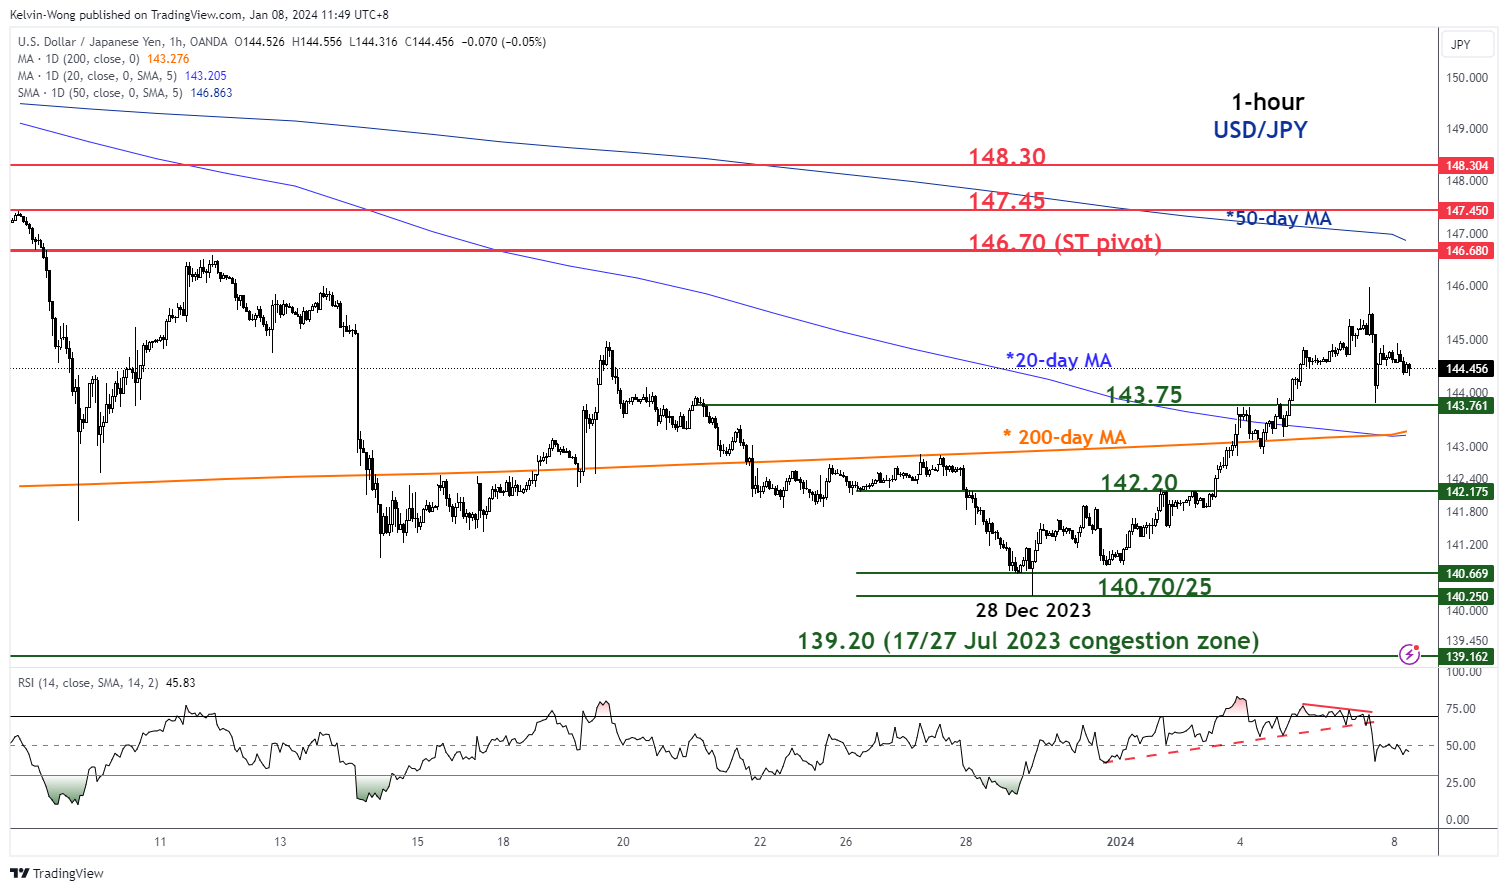
Fig 3: USD/JPY short-term minor trend as of 8 Jan 2023 (Source: TradingView, click to enlarge chart
The 5-day rebound of +573 pips/+4.9% that was seen in the USD/JPY from its 28 December 2023 minor swing low of 140.25 to last Friday, 5 January intraday high of 145.98 has almost reached a key inflection level of 146.70 (former swing low areas of 29 November/4 December 2023, downward sloping 50-day moving average & 50% Fibonacci retracement of the medium-term downtrend from 13 November 2023 high to 28 December 2023 low).
Last Friday, 5 January price actions of the USD/JPY formed a daily “long-legged Doji” candlestick by the end of the US session which suggests some form of exhaustion in the prior upmove sequence.
In addition, the upside momentum has also been eradicated in a shorter time frame as seen by the hourly RSI momentum indicator of the USD/JPY where it has broken down below a key parallel support at the 64 level after it flashed a bearish divergence at its overbought region.
Therefore, it is likely that the 5-day rebound from its 28 December 2023 low of 140.25 is more skewed towards a minor corrective rebound within a medium-term downtrend phase that is still intact for USD/JPY.
If the 146.70 key short-term pivotal resistance is not surpassed to the upside, a break below 143.75 may ignite a potential fresh impulsive downmove sequence to expose the next intermediate supports at 142.20 and 140.70/25 in the first step followed by 139.20 next.
On the flip side, a clearance above 146.70 invalidates the bearish scenario to see the next intermediate resistances coming in at 147.45 and 148.30.
AUD/CAD eyes 0.8875 support, await Australia CPI
The recovery of AUD/CAD since last September has been largely attributed to the divergence in monetary policies between RBA and BoC. While RBA extended its tightening cycle, BoC's interest rate reached a plateau. The rally in December was particularly driven by speculations of an additional RBA rate hike, although the momentum lost steam after briefly surpassing 0.9 handle.
Technically speaking, this recovery from 0.8562 is more corrective looking than impulsive. The notable decline since the start of the year indicates that a short term top was already formed at 0.9063, on bearish divergence condition in D MACD. Break of 0.8875 support should also confirm rejection by 50% retracement of 0.9545 to 0.8562 at 0.9054. That would turn near term outlook bearish for retest 0.8562 low.
The upcoming release of Australia's monthly CPI data could serve as a catalyst for a downturn in AUD/CAD. However, the sustainability of downside momentum, especially in breaking through 0.8562 support, will very much depend on which central bank between RBA and BoC starts cutting interest rates first and the subsequent policy paths they adopt.
Swiss Franc awaits CPI, GBP/CHF in corrective recovery
Traders of Swiss Franc are closely monitoring Swiss CPI release today. Headline inflation is anticipated to increase from 1.4% yoy to 1.7% yoy in December. This expected rise aligns with SNB's own conditional inflation forecast, which projects inflation to reaccelerate from 1.6% in Q4 of last year to 1.8% in Q1, peaking at 2.0% in Q2 before tapering off to 1.9% in Q4.
Regarding SNB's monetary policy, current interest rate stands at 1.75%, which is comparatively unrestrictive. Unlike the more aggressive rate hikes implemented by counterparts like ECB and Fed, SNB's past rate increases have had much less detrimental impact on the Swiss economy. Consequently, there is no immediate pressure for a rate cut, and it is generally anticipated that SNB will maintain current interest rate at least until Q3 of this year. Should today's inflation reading surpass expectations, it could increase the likelihood of SNB holding interest rate unchanged for the remainder of the year.
GBP/CHF recovered after hitting 1.0634, being supported by falling channel support line. Price actions since there are corrective looking. Also, the recovery is kept below 1.0879 minor resistance. Thus, outlook is staying bearish. Break of 1.0746 minor support will bring retest of 1.0634 low first. Further break there will resume recent down trend to 100% projection of 1.1502 to 1.0779 from 1.1153 at 1.0430.
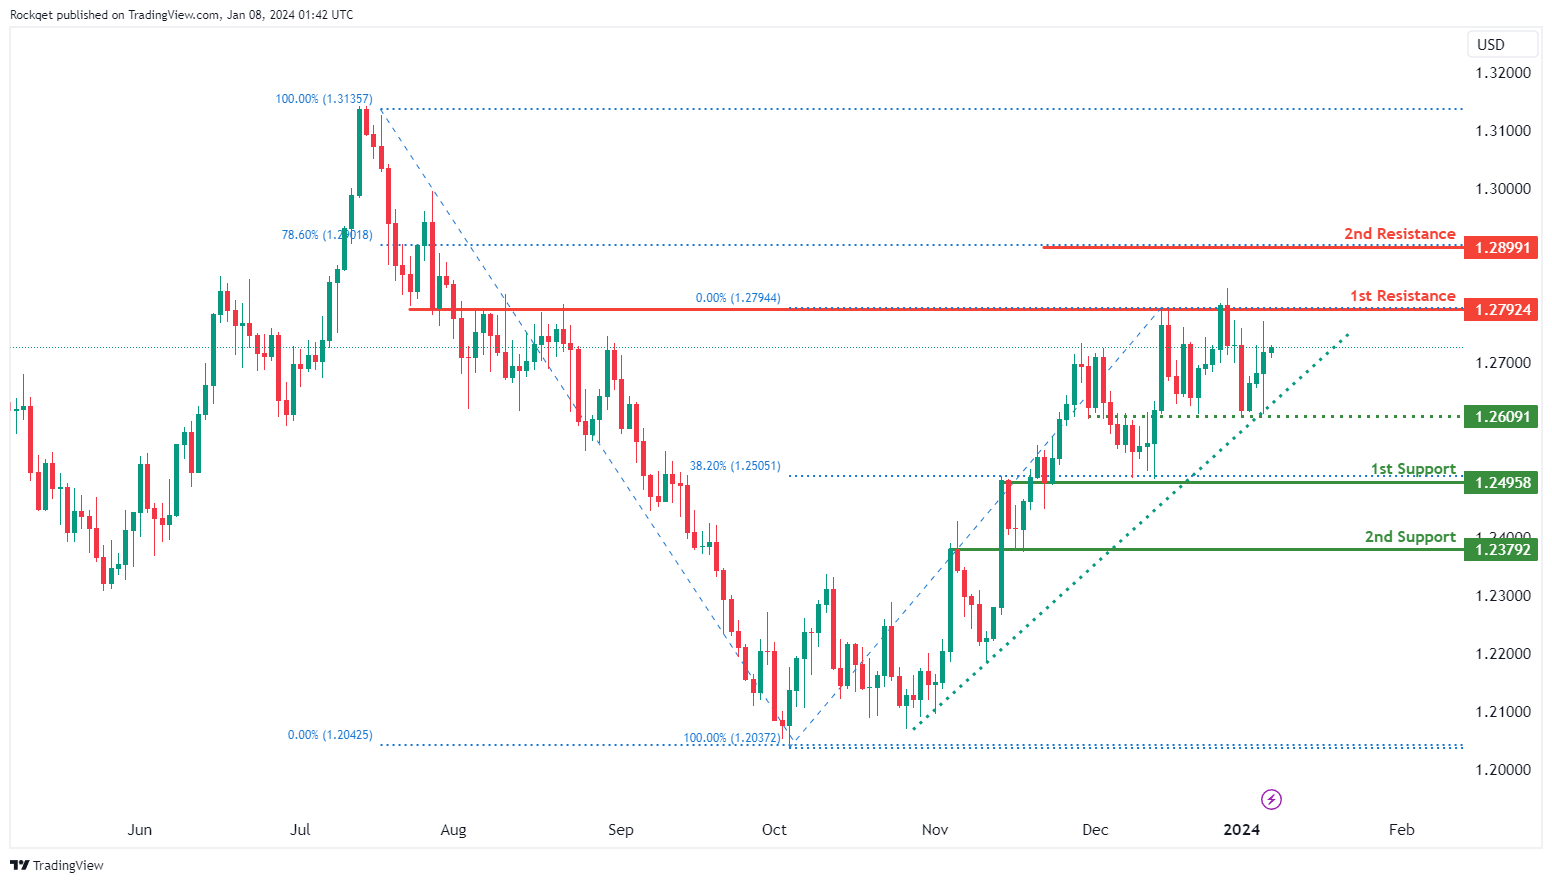
EUR/USD Holds Support But Can It Recover?
Key Highlights
- EUR/USD declined and retested the 1.0880 support zone.
- It traded below a key bullish trend line at 1.0900 on the 4-hour chart.
- GBP/USD is attempting a fresh increase above the 1.2650 resistance.
- USD/JPY climbed higher above the 143.20 resistance zone.
EUR/USD Technical Analysis
The Euro started a fresh decline from the 1.1140 zone against the US Dollar. EUR/USD declined below the 1.0950 support to enter a short-term bearish zone.
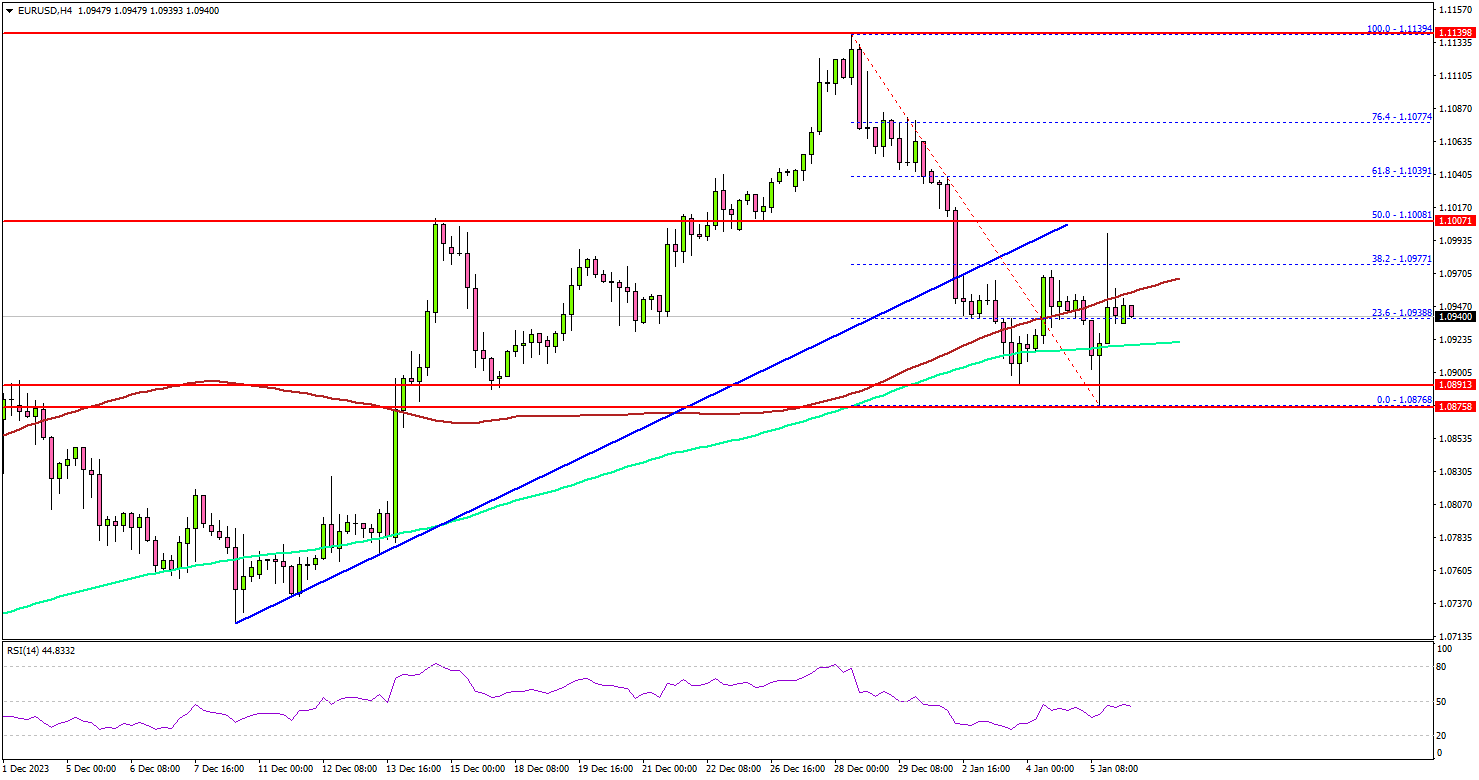
Looking at the 4-hour chart, the pair traded below a key bullish trend line at 1.0900. Finally, the pair tested the 1.0880 support zone. A low was formed near 1.0876 and the pair is now attempting a fresh increase.
There was a move above the 1.0920 level. The pair spiked above the 100 simple moving average (red, 4 hours) and settled above the 200 simple moving average (green, 4 hours).
On the upside, immediate resistance is near the 1.0980 level. The next key resistance is near the 1.1000 level or the 50% Fib retracement level of the downward move from the 1.1139 swing high to the 1.0876 low.
A close above the 1.1000 zone could open the doors for more upsides. The next stop for the bulls might be 1.1065. If there is a fresh decline, the pair might test the 1.0920 support.
The next major support sits at 1.0880. A downside break below the 1.0880 zone could spark a sustained decline. The next major support is 1.0850, below which the pair might decline and test 1.0820. Any more losses might send the pair toward the 1.0750 zone.
Looking at GBP/USD, the pair is attempting a fresh increase and the bulls could aim for a move above the 1.2800 level.
Economic Releases
- Euro Zone Consumer Confidence for Dec 2023 – Forecast -15.1, versus -15.1 previous.
- Euro Zone Services Sentiment for Dec 2023 – Forecast 4.9, versus 4.9 previous.
Fed’s Logan emphasizes need for tight financial conditions to curb inflation
Dallas Fed President Lorie Logan, in her speech on Saturday, emphasized the importance of maintaining tight financial conditions to prevent resurgence of inflation. She expressed concern that if these conditions are not sustained, progress made in controlling inflation could be reversed.
Logan Logan underscored the significant role that restrictive financial conditions have played in "bringing demand into line with supply and keeping inflation expectations well-anchored".
However, she noted a recent reversal in this trend, pointing out that long-term yields have relinquished much of the tightening observed over the summer. She warned, "We can't count on sustaining price stability if we don't maintain sufficiently restrictive financial conditions."
Logan also addressed the Federal Reserve's balance sheet runoff. She indicated that it might be appropriate to consider slowing the pace of this runoff, particularly as overnight reverse repurchase agreement balances approach lower levels.