
Sample Category Title
US Crude Oil – Price Action Technical Analysis
Talking Points
- US Crude Oil falls after Saudi Arabia cuts prices
- Technical Analysis Weekly Chart
- Technical Analysis 8-Hour Chart
Crude Oil prices ended 2023 with 3 months of consecutive declines, prices fell from a peak of $95 in September 2023 down to $70.75 today, a drop of almost 25% in price, shrugging off all the extra premiums resulting from the current political risks, and taking the markets back closer to its standard supply and demand dynamics. The latest COT report shows Commercials are at their 15-year extreme long levels, and possibly signaling a change in sentiment. This week, traders will be looking forward to US Crude Oil inventories which are expected to be at -1.2M, compared to its latest January 4th, 2024, reading of -5.5M.
Weekly Chart
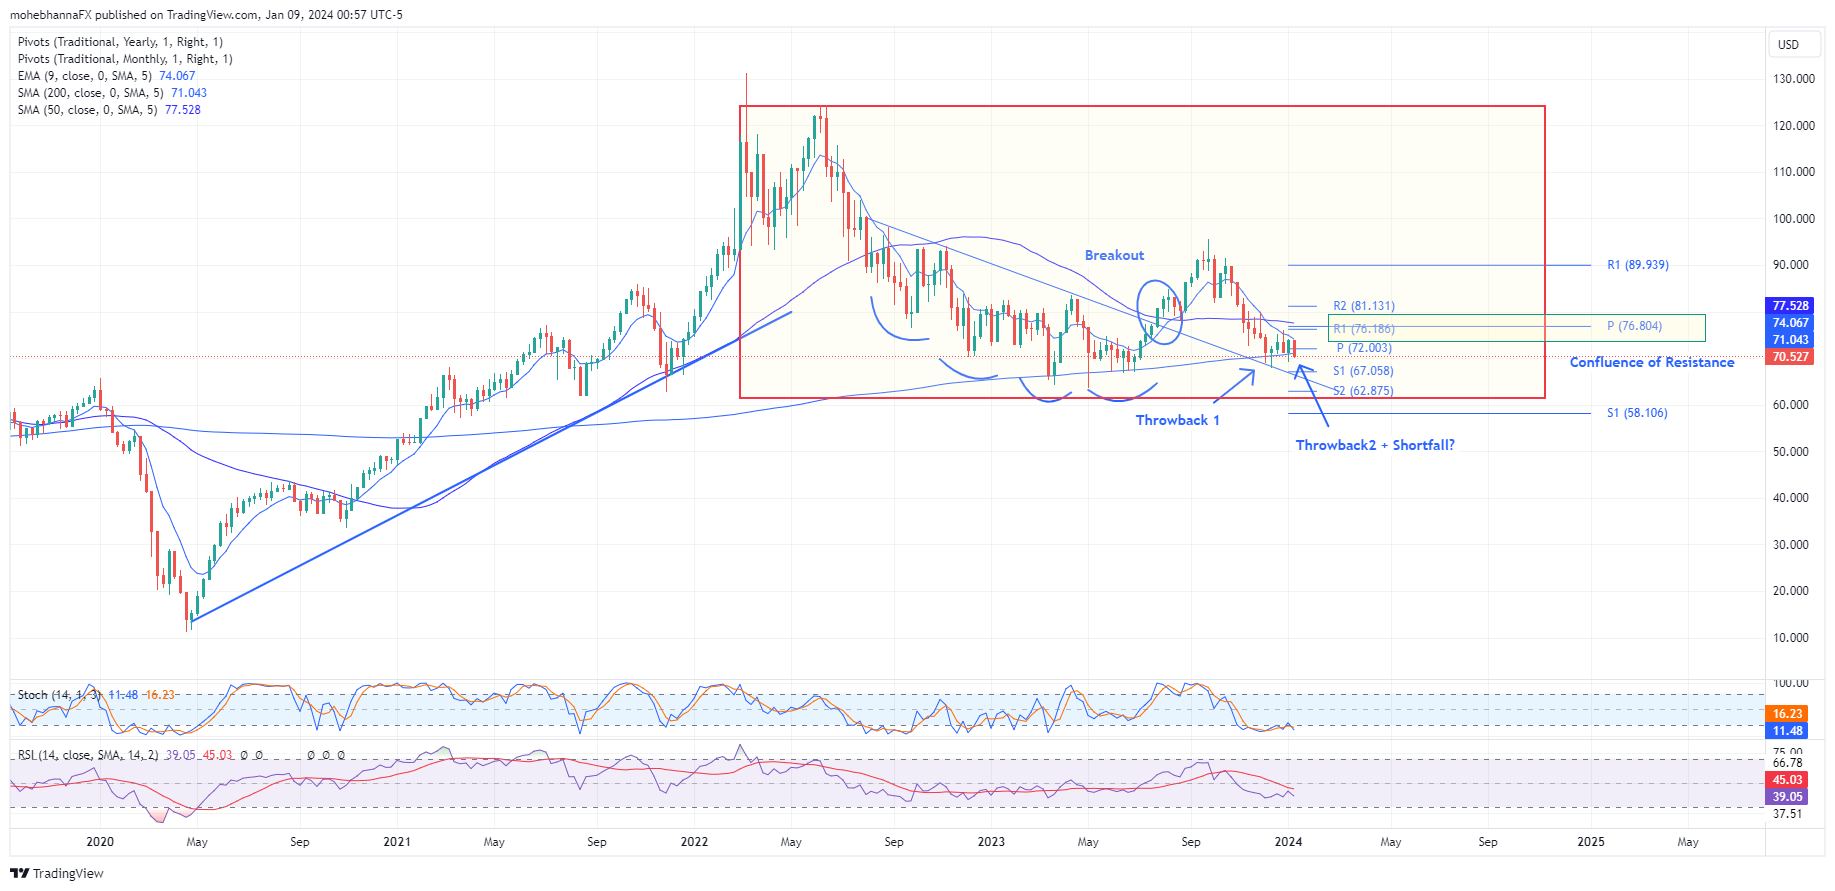
- Crude Oil price has been trading in an uptrend that began in early 2020, the price reached a peak of $131.00 up from its historic low of $11.50, the highlighted area on the chart can be a flag formation which if true, can be a continuation pattern.
- Price action broke out and closed above the resistance line connecting the bases for multiple bottoms formation as marked on the chart.
- The breakout was followed by a throwback reaching the extension of the resistance line (Throwback 1), this was followed shortly after by Throwback 2 which if remains intact, can be considered a shortfall as some expect buyers may enter ahead of the anticipated technical level.
- A confluence of resistance lies above price action represented by the annual pivot point and Monthly R1 calculations at the range of $76.18 – $76.80.
- So far, the price is finding support at its intersection with its SMA200, however, the price has been trading below the other commonly used averages, SMA50 and EMA9.
- RSI and Stochastic indicators reflect a slight positive divergence, as price action remains sideways while indicators are attempting higher highs.
8-Hour Chart
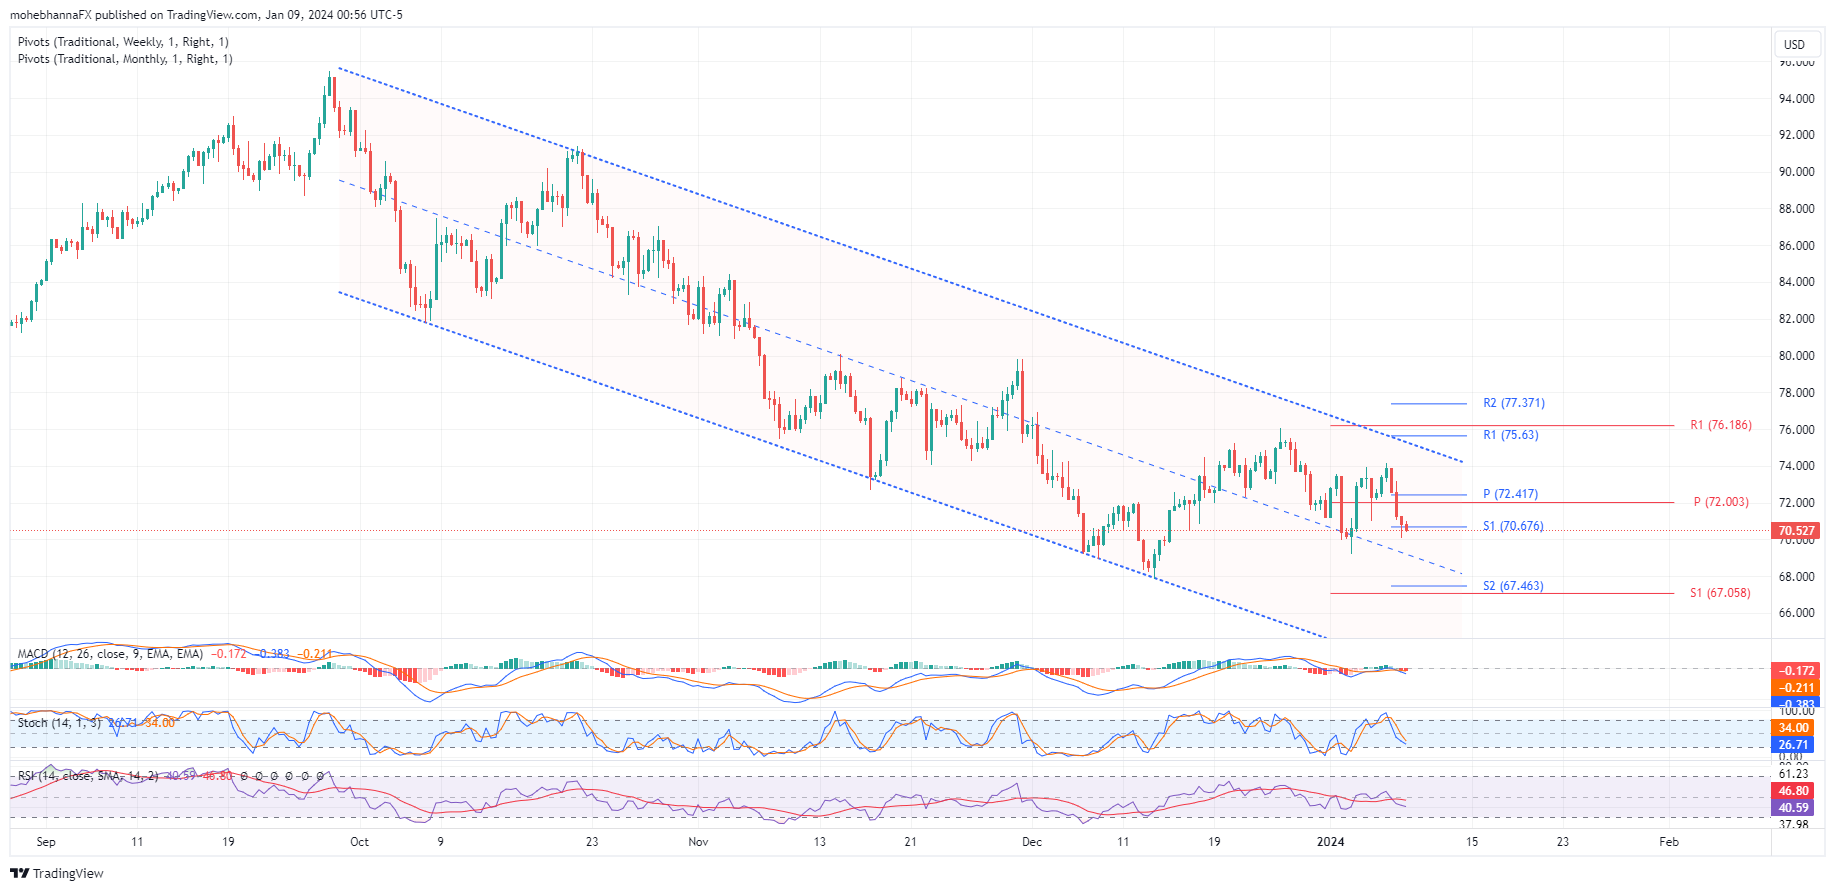
- Price continues to trade within a declining equidistant channel marked by dotted lines on the chart, a potential shortfall may be in place as price action is attempting to find support ahead of the channel median line.
- Price action broke and closed below its monthly and weekly pivot points and currently attempting to find support at its weekly S1 level, any reversal in price action will be met by broken support turned resistance represented by the broken pivot points level.
- RSI and Stochastic indicators are also attempting a reversal ahead of reaching their oversold levels, the Stochastic %K line is attempting to cross above the %D line.
- MACD line remains tangled with its signal line near its neutral levels signaling a potential breakout regardless of direction
Technical Outlook and Review
DXY:
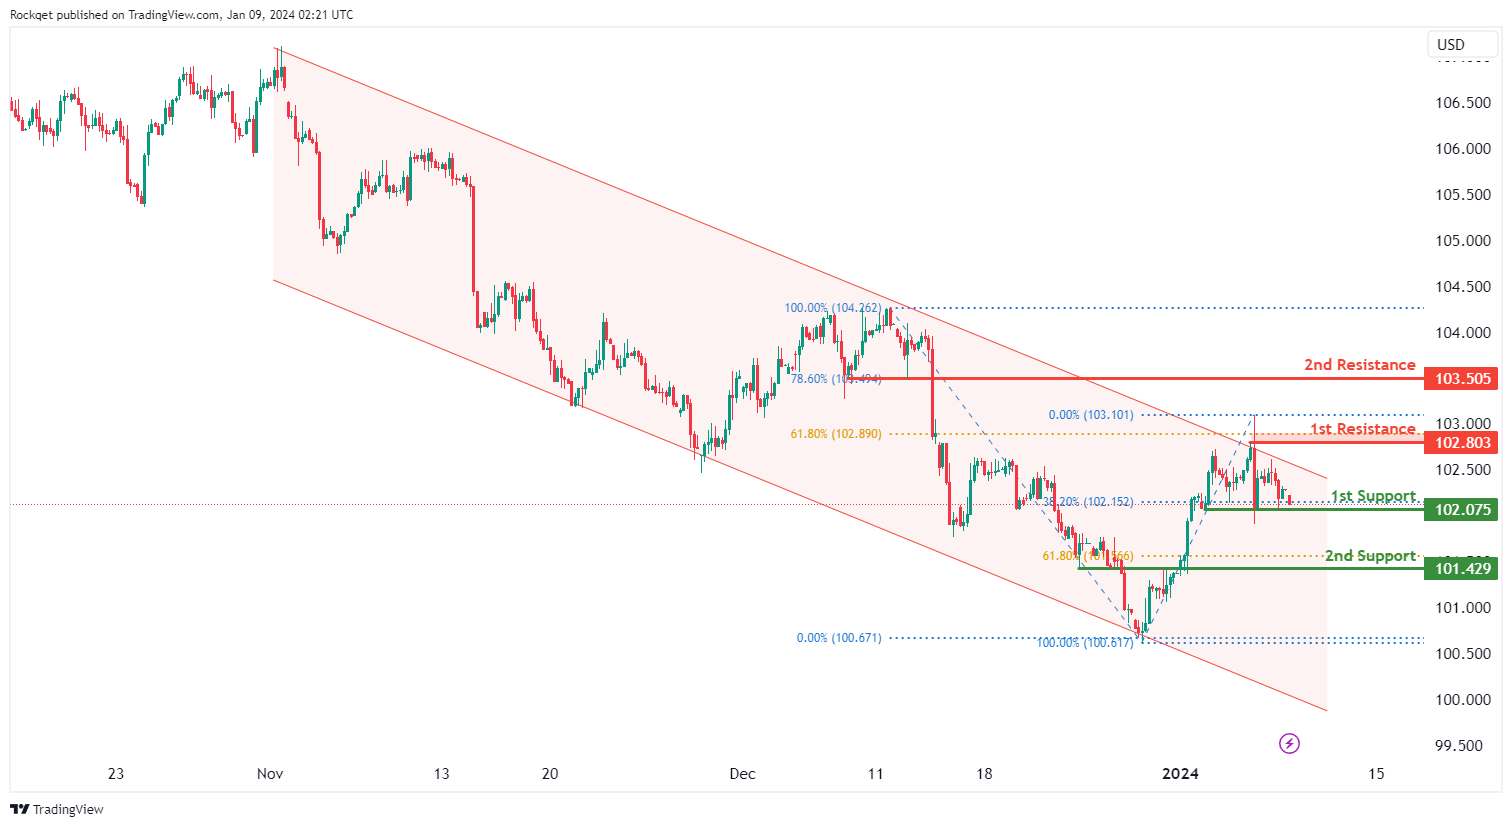
The DXY (US Dollar Index) chart currently displays an overall bearish momentum which is highlighted by the bearish channel. In this context, there is a potential scenario for price to make a bearish continuation towards the 1st support.
The 1st support level at 102.07 is identified as a pullback support that aligns with the 38.20% Fibonacci retracement level. Further below, the 2nd support level at 101.42 is also marked as a pullback support that aligns close to the 61.80% Fibonacci retracement level, further reinforcing its importance as a key support level.
On the resistance side, the 1st resistance level at 102.80 is identified as a pullback resistance that aligns close to the 61.80% Fibonacci retracement level. Higher up, the 2nd resistance level at 103.50 is also noted as a pullback resistance that aligns with the 78.60% Fibonacci retracement level, further reinforcing its significance as a potential resistance zone.
EUR/USD:
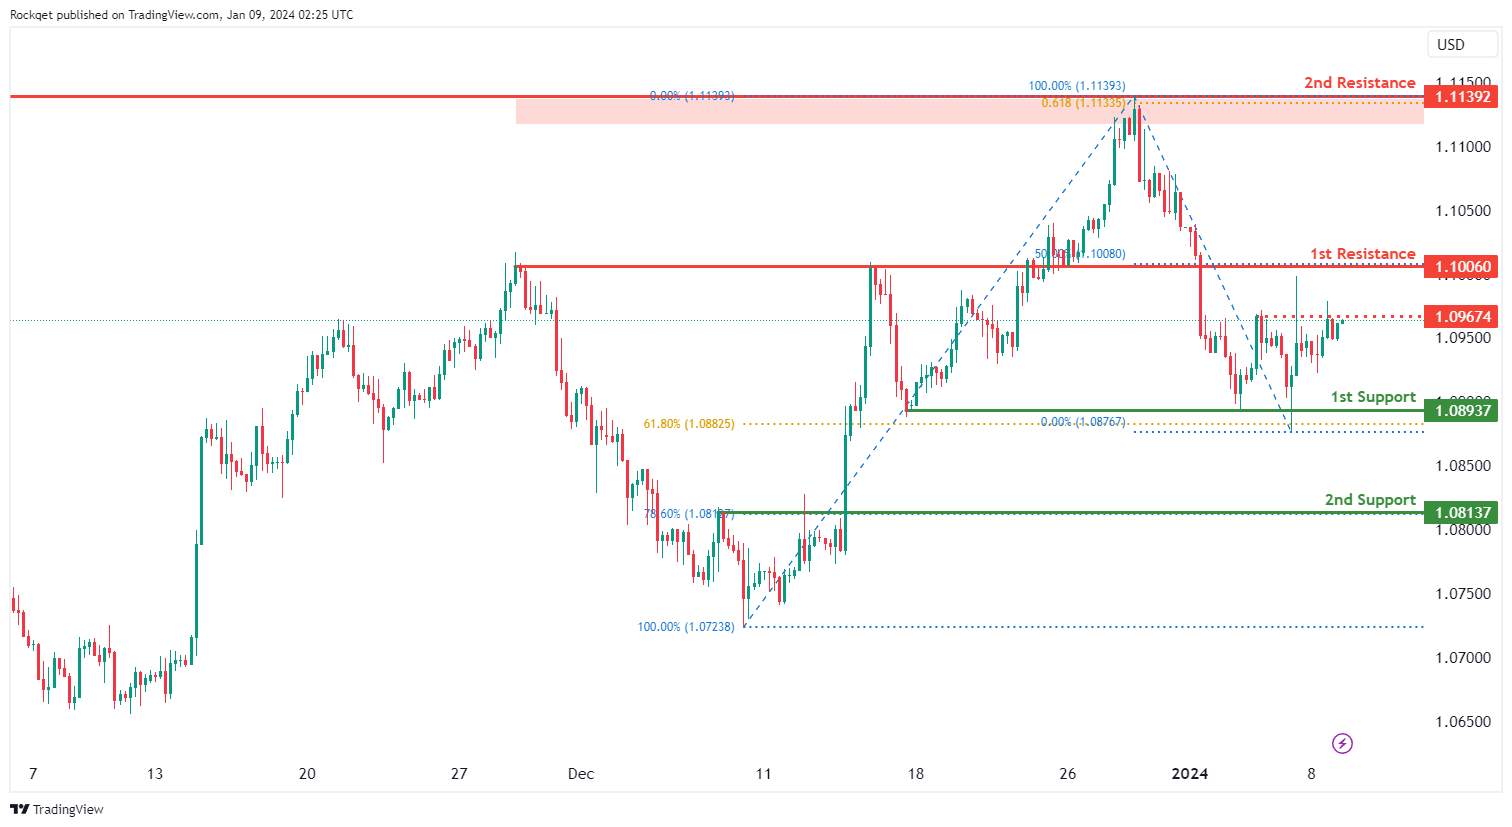
The EUR/USD chart currently demonstrates an overall bullish momentum. In this context, there is a potential scenario for price to make a bullish continuation towards the 1st resistance should it break above the intermediate resistance.
The intermediate resistance level at 1.0967 is identified as a pullback resistance while the 1st resistance level at 1.1006 is noted as an overlap resistance that aligns with the 50.00% Fibonacci retracement level. Higher up, the 2nd resistance level at 1.1139 is marked as a multi-swing-high resistance that aligns with the 61.80% Fibonacci projection level, further reinforcing its significance as a potential resistance zone.
To the downside, the 1st support level at 1.0893 is identified as a pullback support that aligns close to the 61.80% Fibonacci retracement level. Further below, the 2nd support level at 1.0813 is also noted as a pullback support that aligns with the 78.60% Fibonacci retracement level, further reinforcing its importance as a key support level.
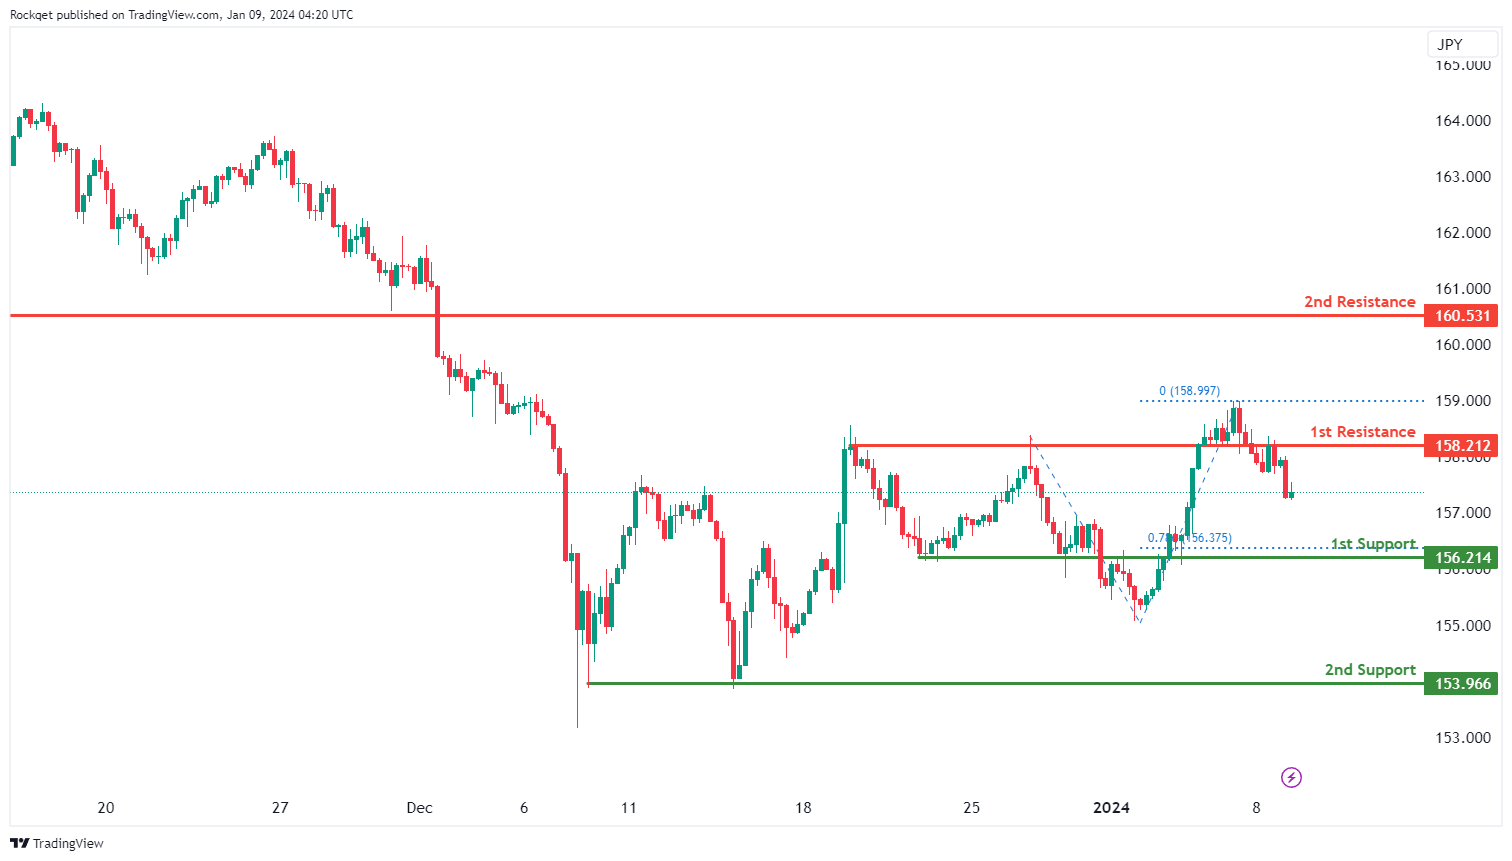
EUR/JPY:
The EUR/JPY chart currently displays a bearish overall momentum, indicating a downward trend. There is a potential scenario for a bearish reaction off the 1st resistance, leading to a drop towards the 1st support.
The 1st support at 156.21 is considered favorable due to its identification as an overlap support, suggesting historical significance as a level where buying interest has previously emerged. Additionally, the 78.60% Fibonacci Projection adds confluence to the potential support at this level. The 2nd support at 153.97 is noted as a multi-swing low support, further strengthening its potential as a support level.
On the resistance side, the 1st resistance at 158.21 is identified as an overlap resistance. This level may act as a barrier where historical selling interest and potential price reversal could occur. The 2nd resistance at 160.53 is also noted as an overlap resistance, adding significance to this potential resistance level.
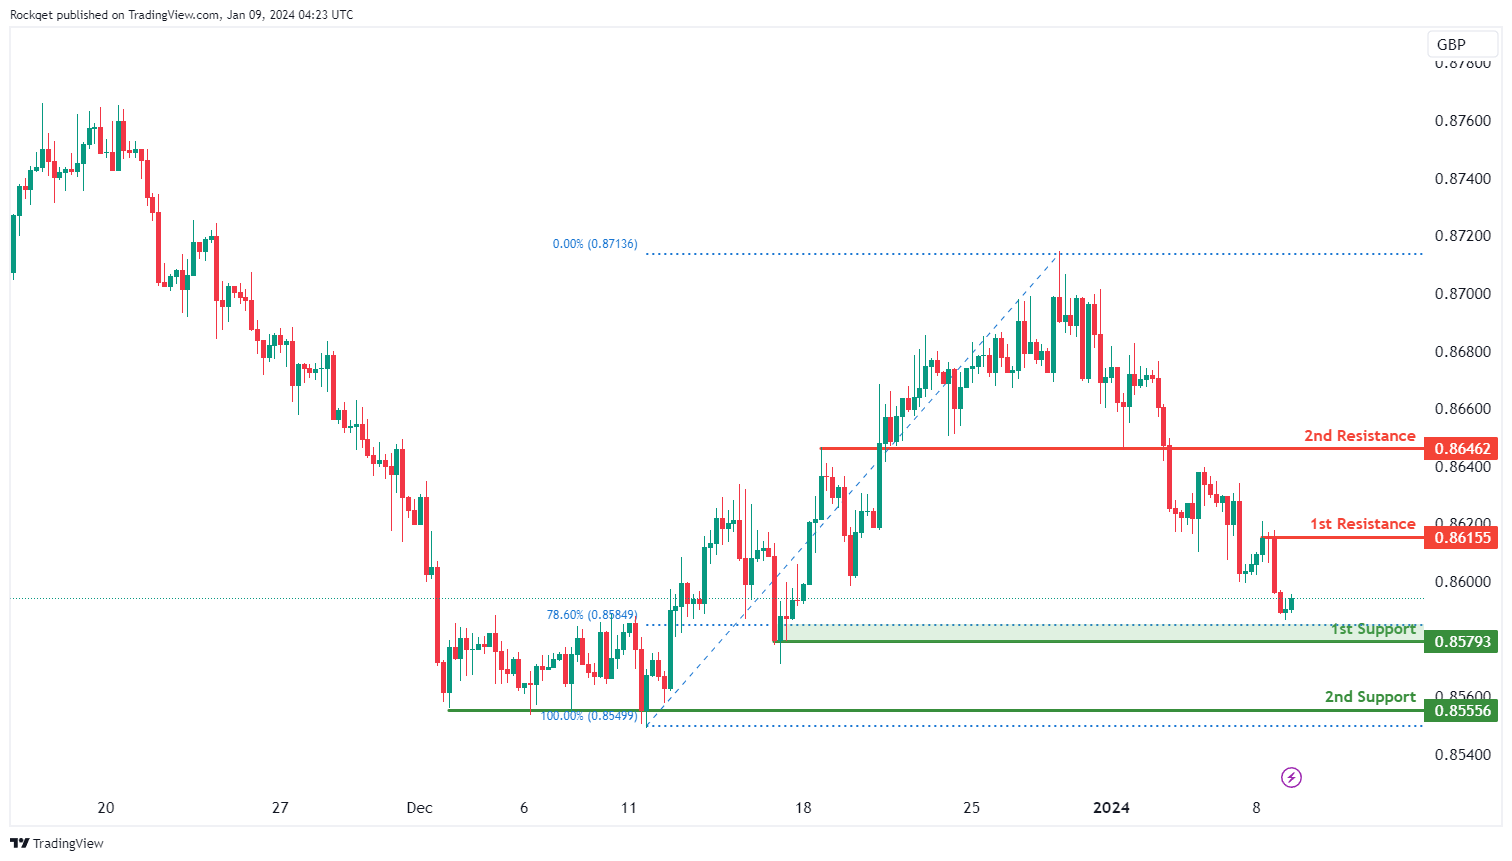
EUR/GBP:
The EUR/GBP chart currently exhibits a bullish overall momentum, indicating an upward trend. There is a potential scenario for a bullish continuation towards the 1st resistance.
The 1st support at 0.8579 is considered favorable due to its identification as a pullback support, suggesting a level where buying interest might emerge during a price retracement. Additionally, the 78.60% Fibonacci Retracement provides added confluence to the potential support at this level.
The 2nd support at 0.8556 is noted as a multi-swing low support, further strengthening its potential as a support level.
On the resistance side, the 1st resistance at 0.8616 is identified as a pullback resistance. This level may act as a barrier where historical selling interest and potential price reversal could occur.
The 2nd resistance at 0.8646 is also noted as an overlap resistance, adding significance to this potential resistance level.
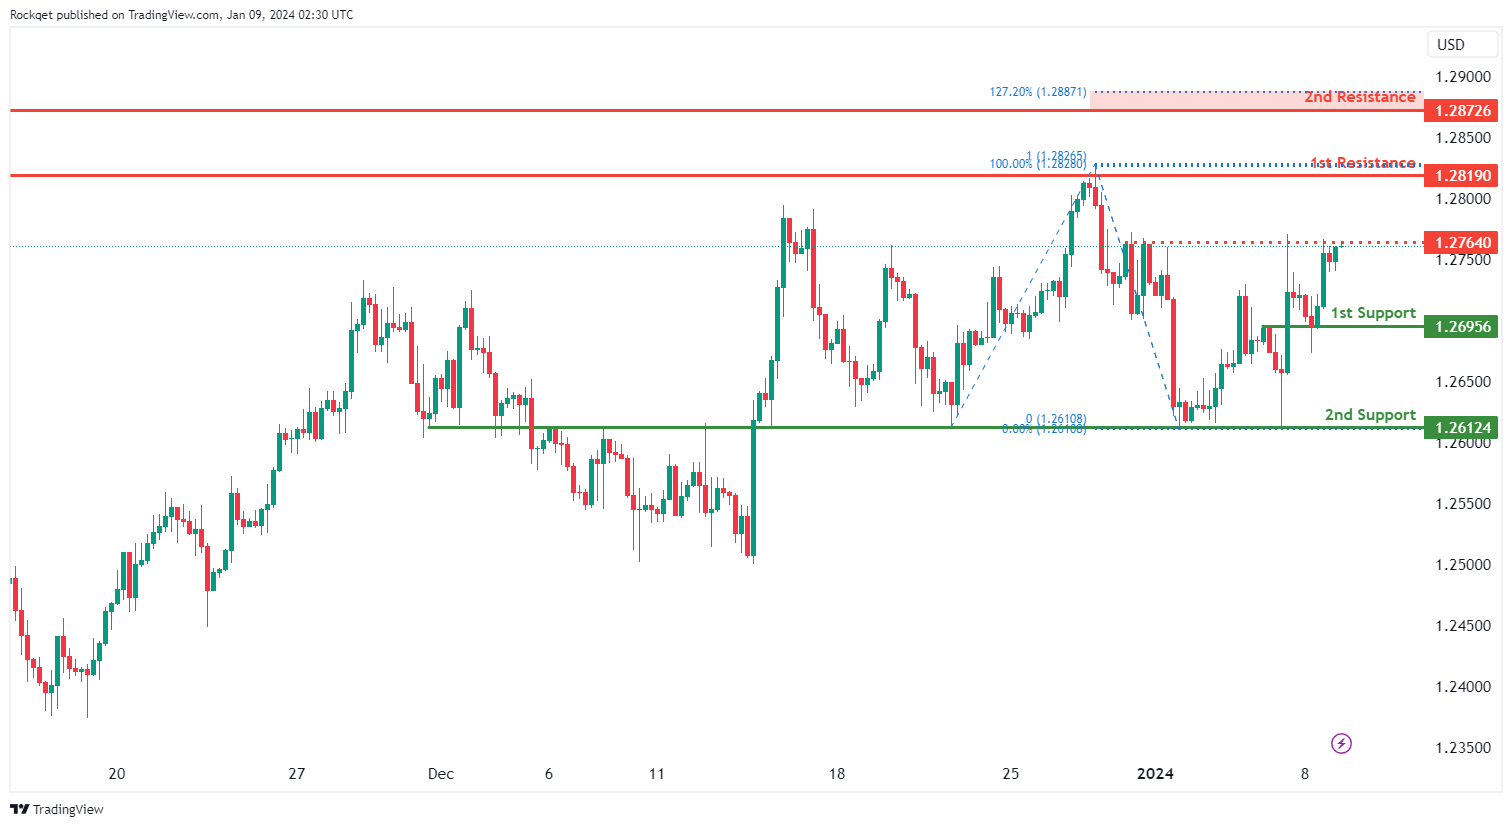
GBP/USD:
The GBP/USD chart currently demonstrates an overall bullish momentum. In this context, there is a potential scenario for price to make a bullish continuation towards the 1st resistance should it break above the intermediate resistance.
The intermediate resistance level at 1.2764 is identified as a pullback resistance while the 1st resistance level at 1.2819 is noted as a pullback resistance that aligns with the 100.00% Fibonacci projection level. Higher up, the 2nd resistance level at 1.2872 is also marked as a pullback resistance that aligns close to the 127.20% Fibonacci extension level, further reinforcing its significance as a potential resistance zone.
To the downside, the 1st support level at 1.2695 is identified as an overlap support. Further below, the 2nd support level at 1.2612 is also noted as an overlap support, further reinforcing its importance as a key support level.
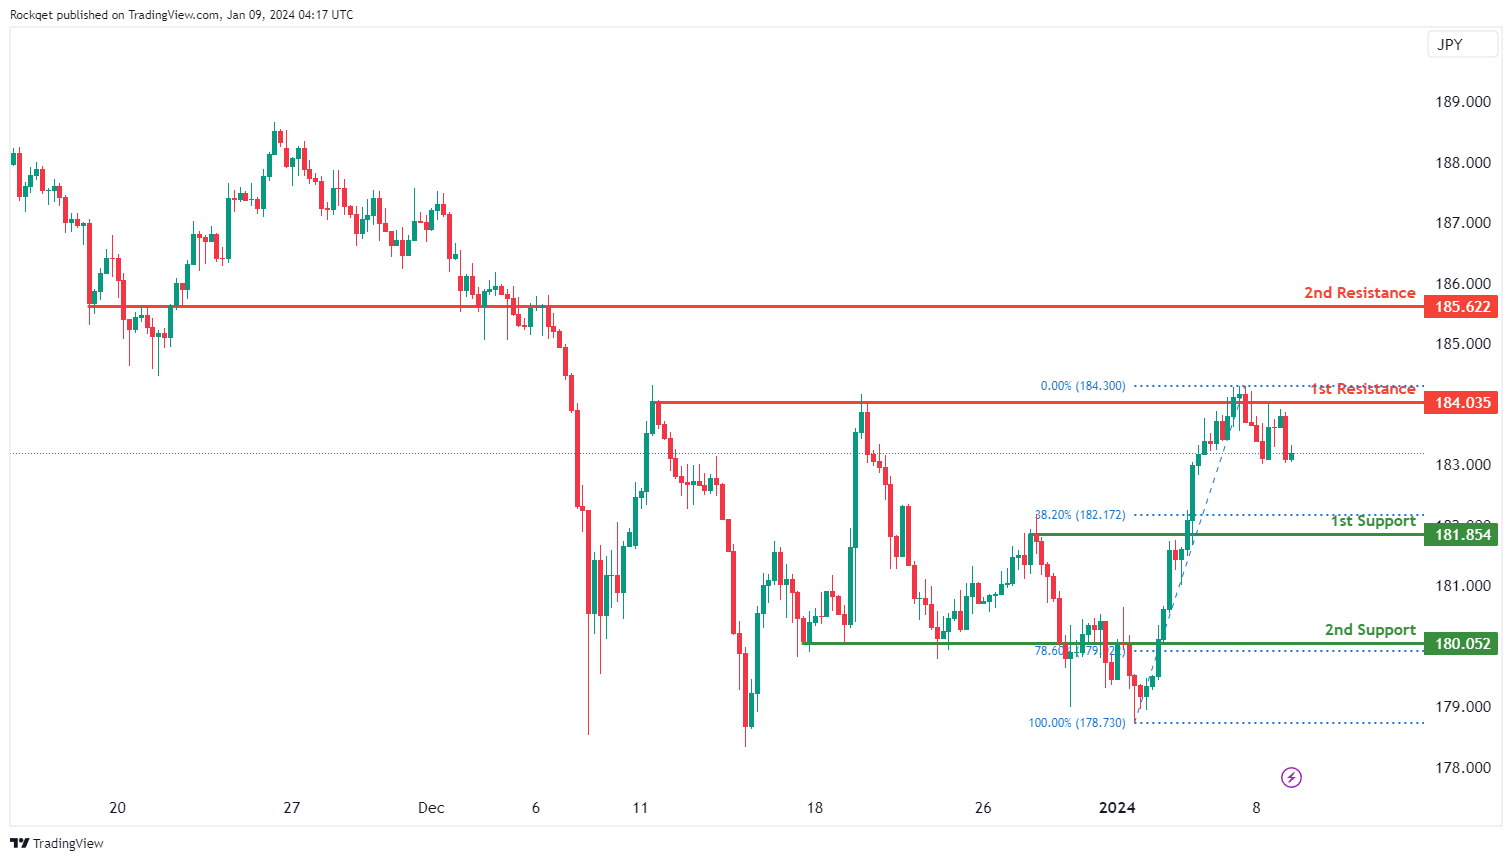
GBP/JPY:
The GBP/JPY chart currently demonstrates a bullish overall momentum, indicating an upward trend. There is a potential scenario for a bullish continuation towards the 1st resistance.
The 1st support at 181.85 is considered favorable due to its identification as an overlap support, suggesting historical significance as a level where buying interest has previously emerged. Additionally, the 38.20% Fibonacci Retracement adds confluence to the potential support at this level.
The 2nd support at 180.05 is also noted as an overlap support and aligns with the 78.60% Fibonacci Retracement, further strengthening its potential as a support level.
On the resistance side, the 1st resistance at 184.04 is identified as a multi-swing high resistance. This level may act as a barrier where historical selling interest and potential price reversal could occur.
The 2nd resistance at 185.62 is noted as an overlap resistance, adding significance to this potential resistance level.
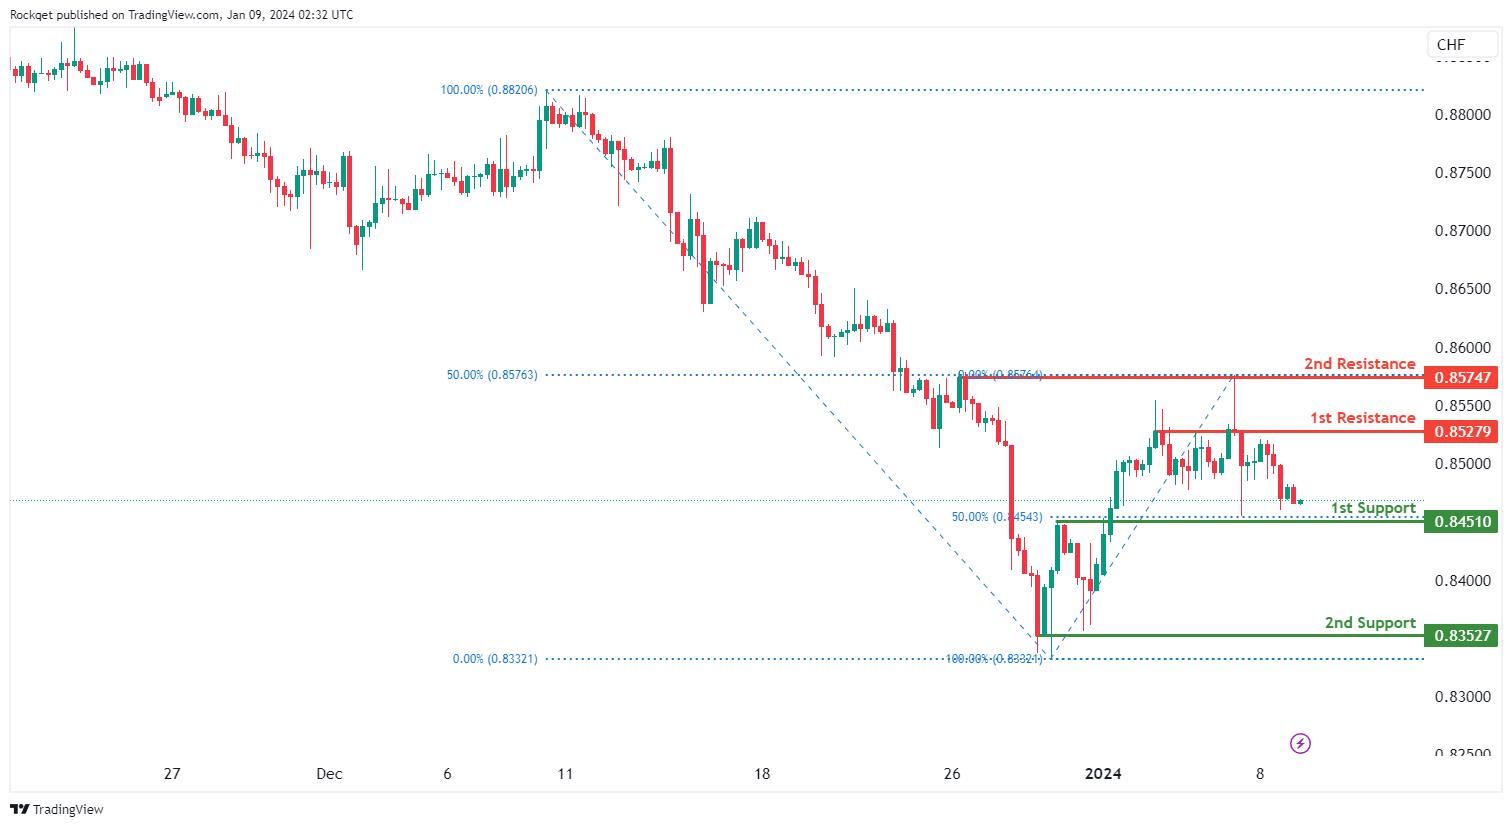
USD/CHF:
The USD/CHF chart currently displays an overall bearish momentum. In this context, there is a potential scenario for price to make a bearish continuation towards the 1st support.
The 1st support level at 0.8451 is identified as an overlap support that aligns with the 50.00% Fibonacci retracement level. Further below, the 2nd support level at 0.8352 is marked as a swing-low support, further reinforcing its importance as a key support level.
On the resistance side, the 1st resistance level at 0.8527 is identified as a pullback resistance. Higher up, the 2nd resistance level at 0.8574 is also noted as a pullback resistance that aligns with the 50.00% Fibonacci retracement level, further reinforcing its significance as a potential resistance zone.
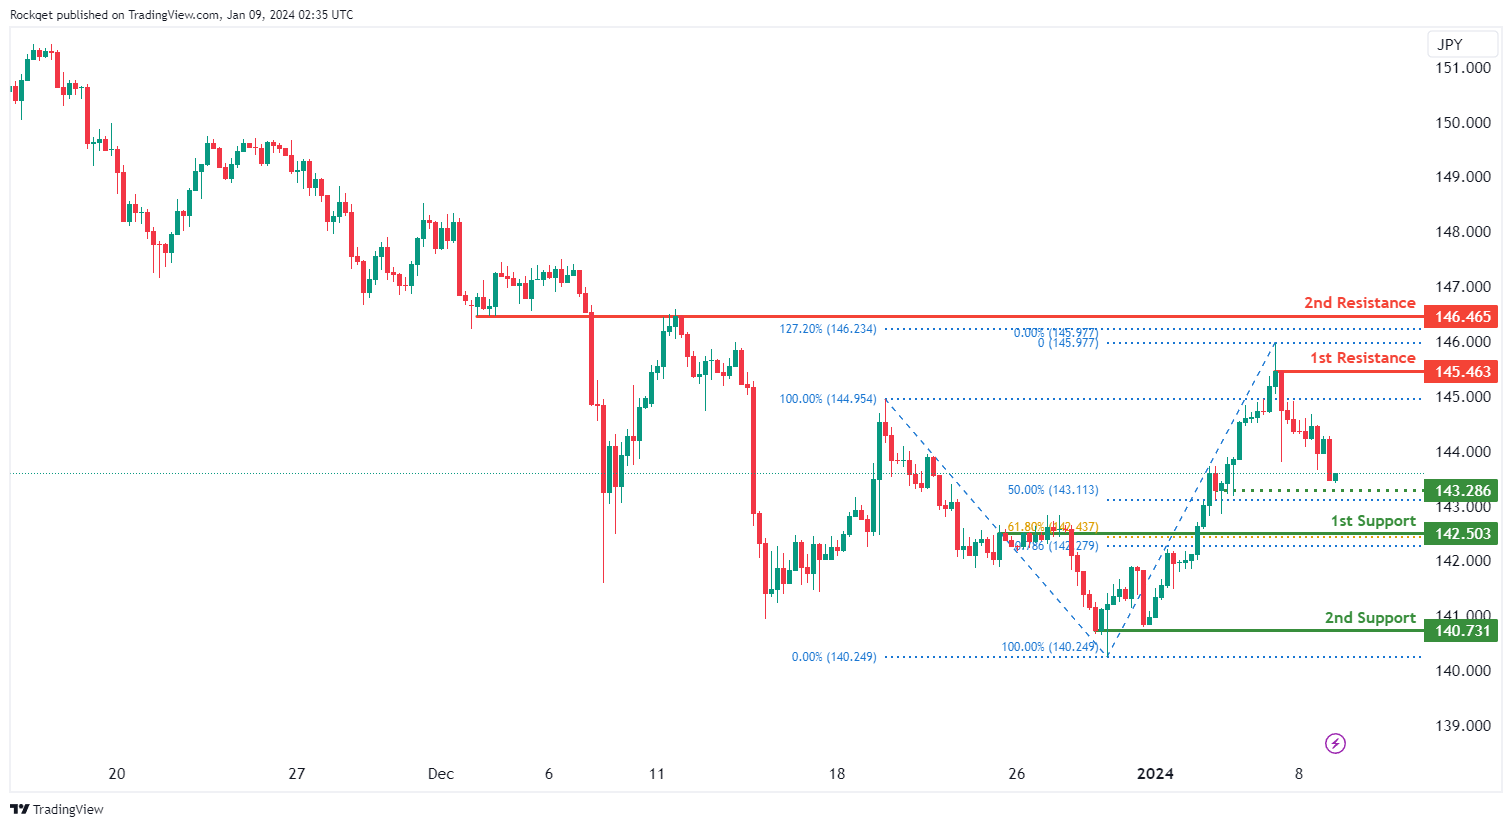
USD/JPY:
The USD/JPY chart currently displays an overall bearish momentum. In this context, there is a potential scenario for price to make a bearish continuation towards the 1st support should it break below the intermediate support.
The intermediate support level at 143.28 is identified as a pullback support that aligns close to the 50.00% Fibonacci retracement level while the 1st support level at 142.50 is also noted as a pullback support that aligns close to a confluence of Fibonacci levels i.e. the 61.80% retracement and the 78.60% projection. Further below, the 2nd support level at 140.73 is marked as a swing-low support, further reinforcing its importance as a key support level.
On the resistance side, the 1st resistance level at 145.46 is identified as a pullback resistance. Higher up, the 2nd resistance level at 146.46 is noted as an overlap resistance that aligns close to the 127.20% Fibonacci extension level, further reinforcing its significance as a potential resistance zone.
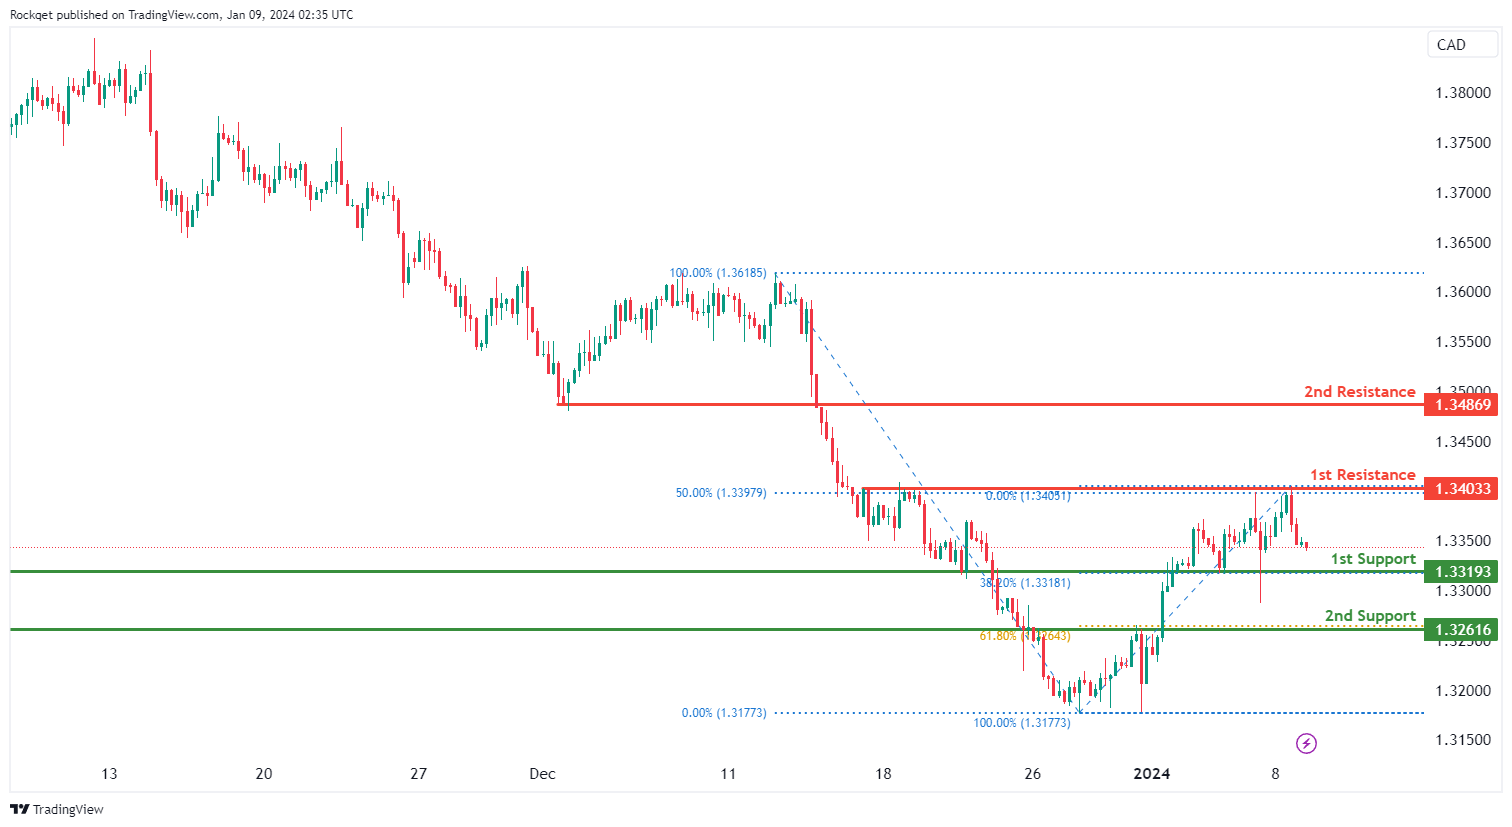
USD/CAD:
The USD/CAD chart currently exhibits an overall bullish momentum. However, there is a potential scenario for price to fall towards the 1st support and make a bullish bounce off this level.
The 1st support level at 1.3319 is identified as a pullback support that aligns with the 38.20% Fibonacci retracement level. Further below, the 2nd support level at 1.3261 is marked as an overlap support that aligns with the 61.80% Fibonacci retracement level, further reinforcing its importance as a key support level.
To the upside, the 1st resistance level at 1.3403 is identified as a pullback resistance that aligns with the 50.00% Fibonacci retracement level. Higher up, the 2nd resistance level at 1.3489 is noted as a pullback resistance, further reinforcing its significance as a potential resistance zone.
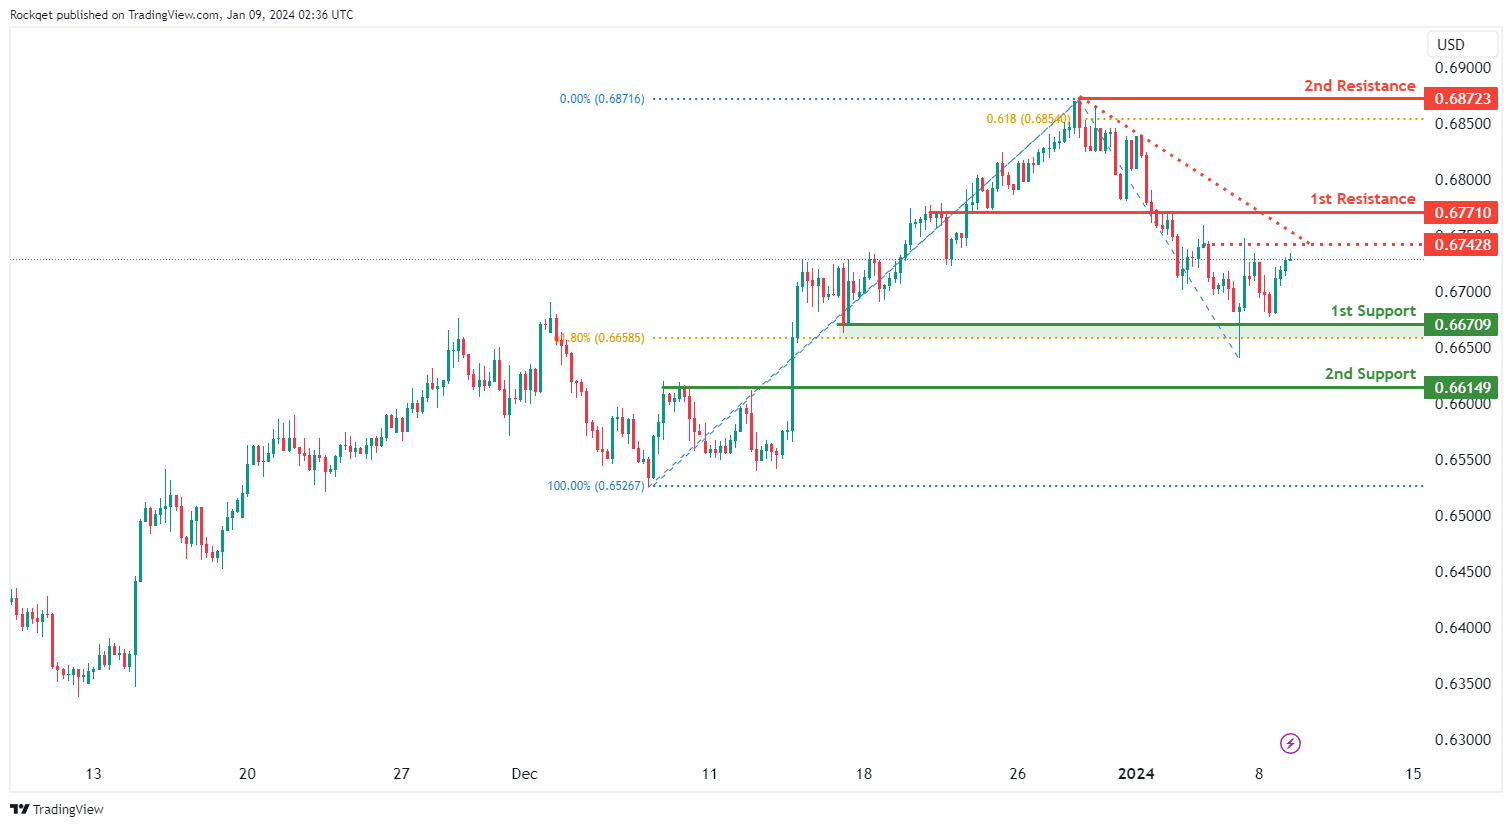
AUD/USD:
The AUD/USD chart currently exhibits an overall bearish momentum. However, there is a potential scenario for price to make a bullish rise towards the 1st resistance should it break above the descending trendline and the intermediate resistance.
The intermediate resistance level at 0.6742 is identified as a pullback resistance while the 1st resistance level at 0.6771 is identified as an overlap resistance. Higher up, the 2nd resistance level at 0.6872 is noted as a swing-high resistance that aligns with the 61.80% Fibonacci projection level, suggesting a potential barrier for further upside movement.
To the downside, the 1st support level at 0.6670 is identified as a pullback support that aligns close to the 61.80% Fibonacci retracement level. Further below, the 2nd support level at 0.6614 is also marked as an pullback support, further reinforcing its importance as a key support level.
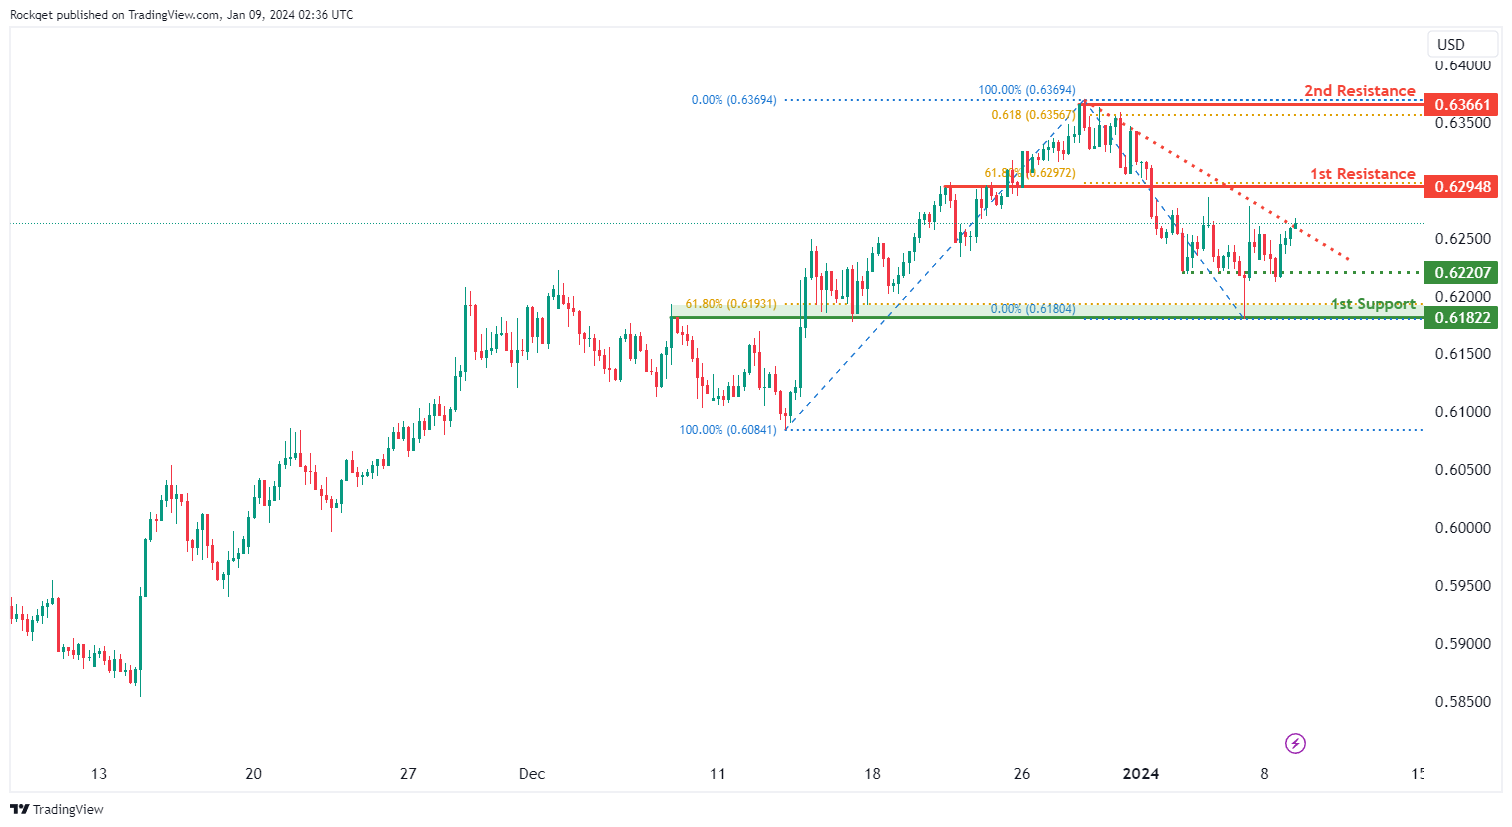
NZD/USD
The NZD/USD chart currently exhibits an overall bearish momentum. However, there is a potential scenario for price to make a bullish rise towards the 1st resistance should it break above the descending trendline.
The 1st resistance level at 0.6294 is identified as an overlap resistance that aligns with the 61.80% Fibonacci retracement level. Higher up, the 2nd resistance level at 0.6366 is noted as a swing-high resistance that aligns close to the 61.80% Fibonacci projection level, suggesting a potential barrier for further upside movement.
To the downside, the intermediate support level at 0.6220 is identified as a pullback support. Further below, the 1st support level at 0.6182 is marked as an overlap support that aligns close to the 61.80% Fibonacci retracement level, further reinforcing its importance as a key support level.
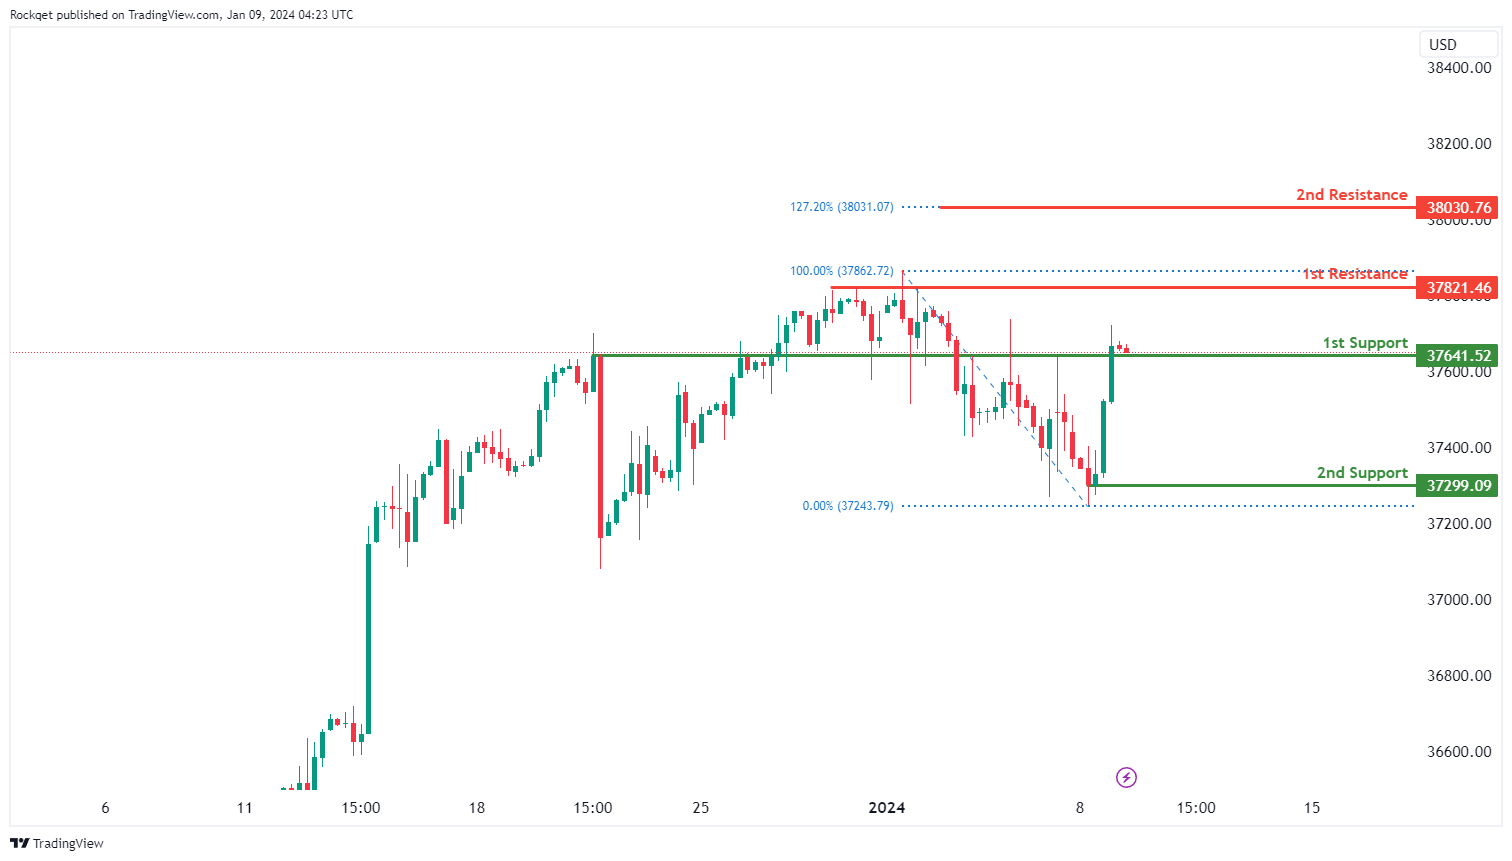
DJ30:
The DJ30 chart currently indicates a weak bearish overall momentum with low confidence, suggesting a potential downward trend. There is a scenario in which the price could continue bearishly towards the 1st support.
The 1st support at 37641.52 is considered favorable as it is identified as an overlap support, indicating historical significance as a level where buying interest has previously emerged.
The 2nd support at 37299.09 is recognized as a pullback support, further adding to its potential as a support level during a price retracement.
On the resistance side, the 1st resistance at 37821.46 is identified as a swing high resistance, which may act as a barrier where selling interest could materialize.
The 2nd resistance at 38030.76 is noteworthy for being at the 127.20% Fibonacci Extension, adding significance to this potential resistance level.
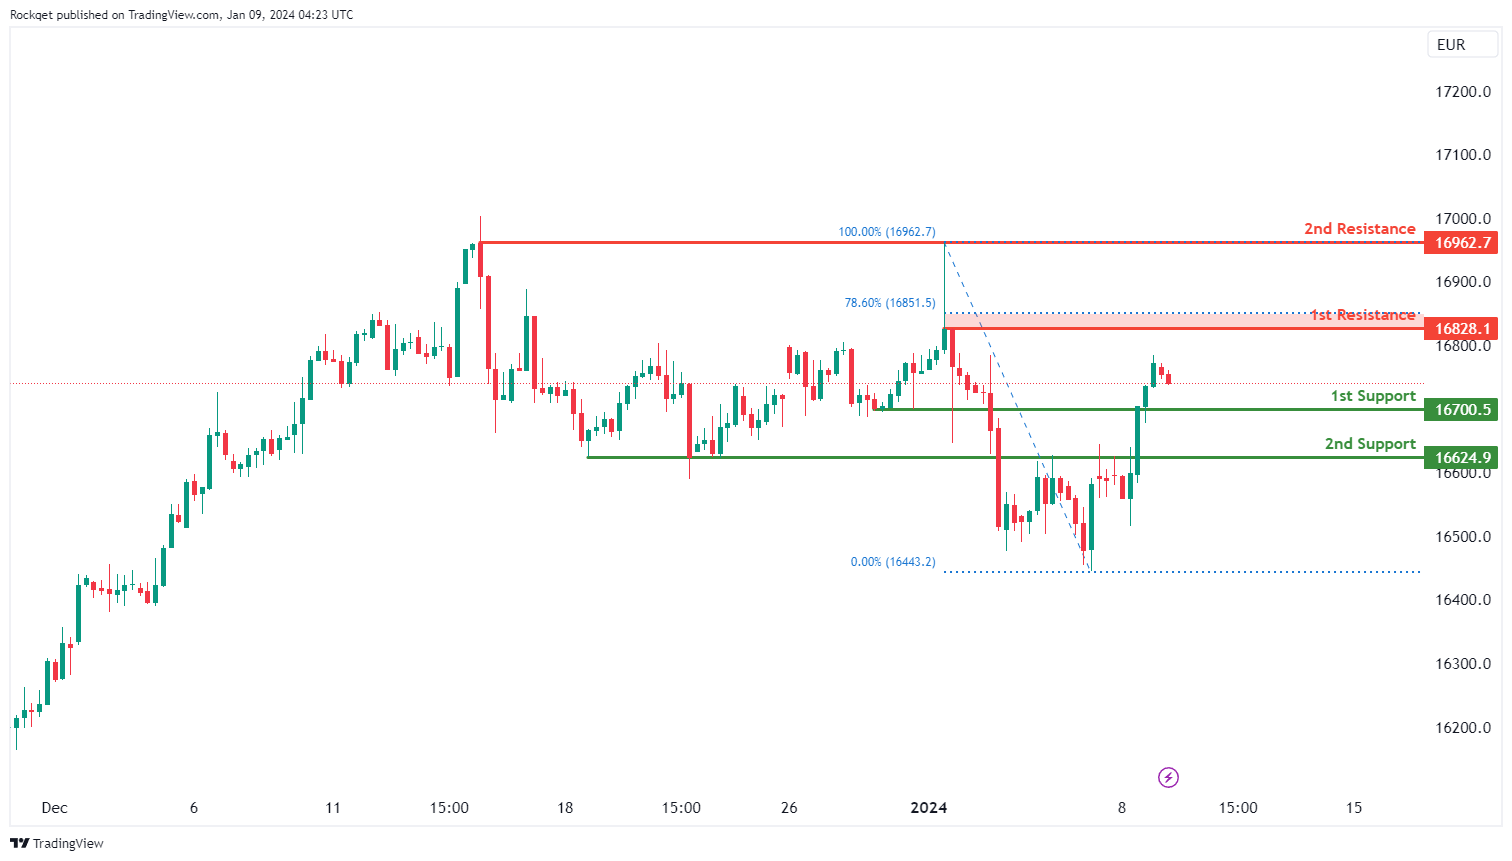
GER40:
The GER40 chart currently shows a bearish overall momentum, indicating a potential downward trend. Several factors contribute to this momentum, suggesting that the price could potentially make a bearish continuation towards the 1st support.
The 1st support at 16700.50 is considered favorable as it is identified as a pullback support, indicating a level where buying interest has historically emerged during retracements.
The 2nd support at 16624.90 is recognized as an overlap support, adding to its potential significance as a level of historical importance.
On the resistance side, the 1st resistance at 16828.10 is identified as a pullback resistance and coincides with the 78.60% Fibonacci Retracement, suggesting a level where selling interest could materialize.
The 2nd resistance at 16962.70 is noteworthy for being a swing high resistance, further reinforcing its potential as a barrier to upward movement.
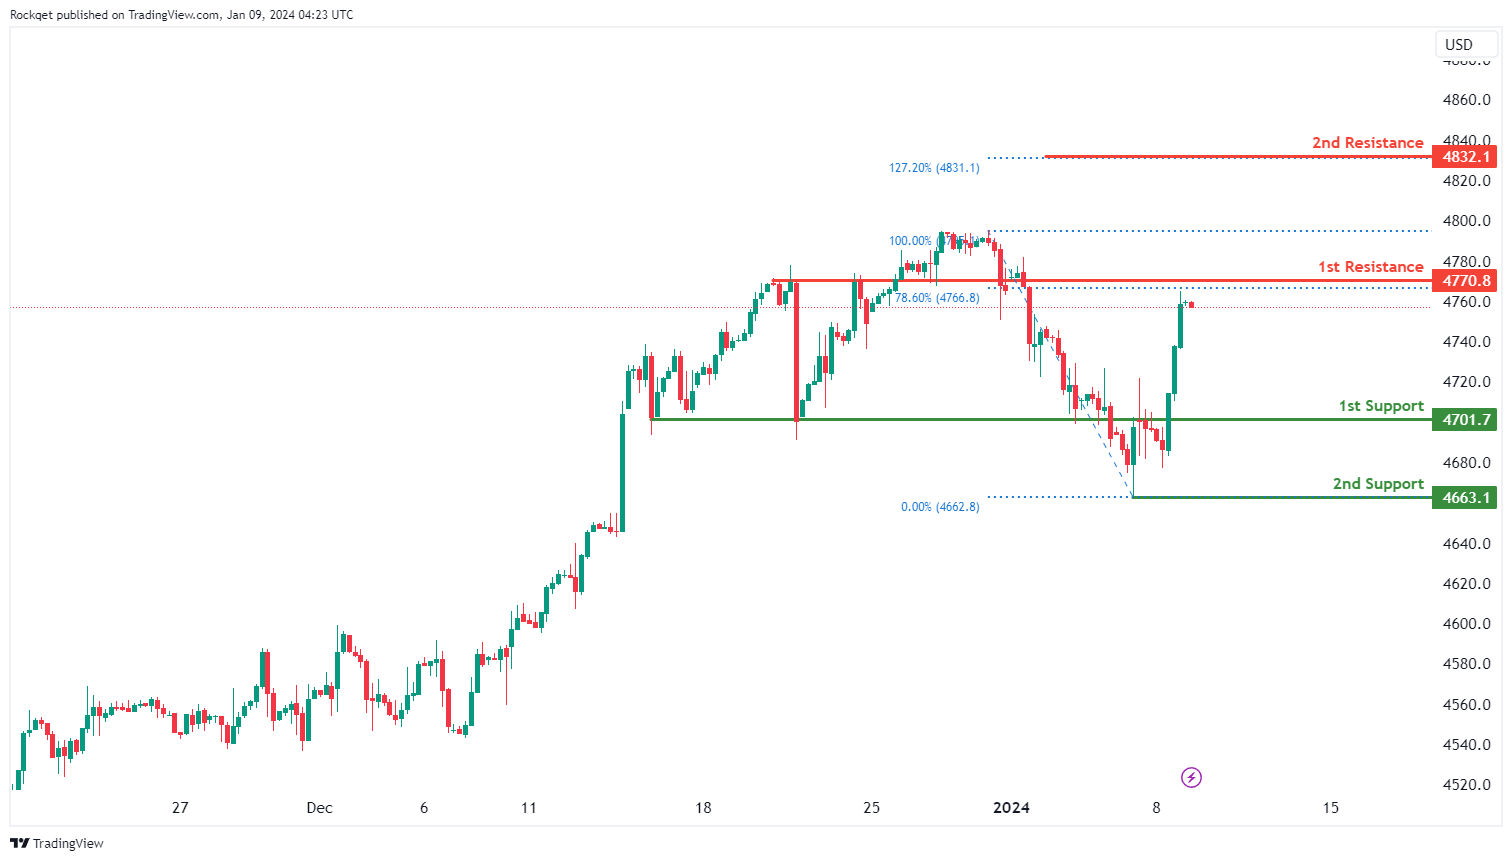
US500:
The US500 chart currently displays a bearish overall momentum, indicating a potential downward trend. Several factors contribute to this momentum, suggesting that the price could potentially make a bearish reaction off the 1st resistance and drop to the 1st support.
The 1st support at 4701.7 is considered favorable due to its identification as an overlap support, signifying historical significance as a level where buying interest has previously emerged.
The 2nd support at 4663.1 is recognized as a swing low support, adding to its potential as a support level.
On the resistance side, the 1st resistance at 4770.8 is identified as a pullback resistance and aligns with the 78.60% Fibonacci Retracement, suggesting a level where selling interest could materialize.
The 2nd resistance at 4832.1 is noteworthy for being the 127.20% Fibonacci Extension, adding significance to this potential resistance level.
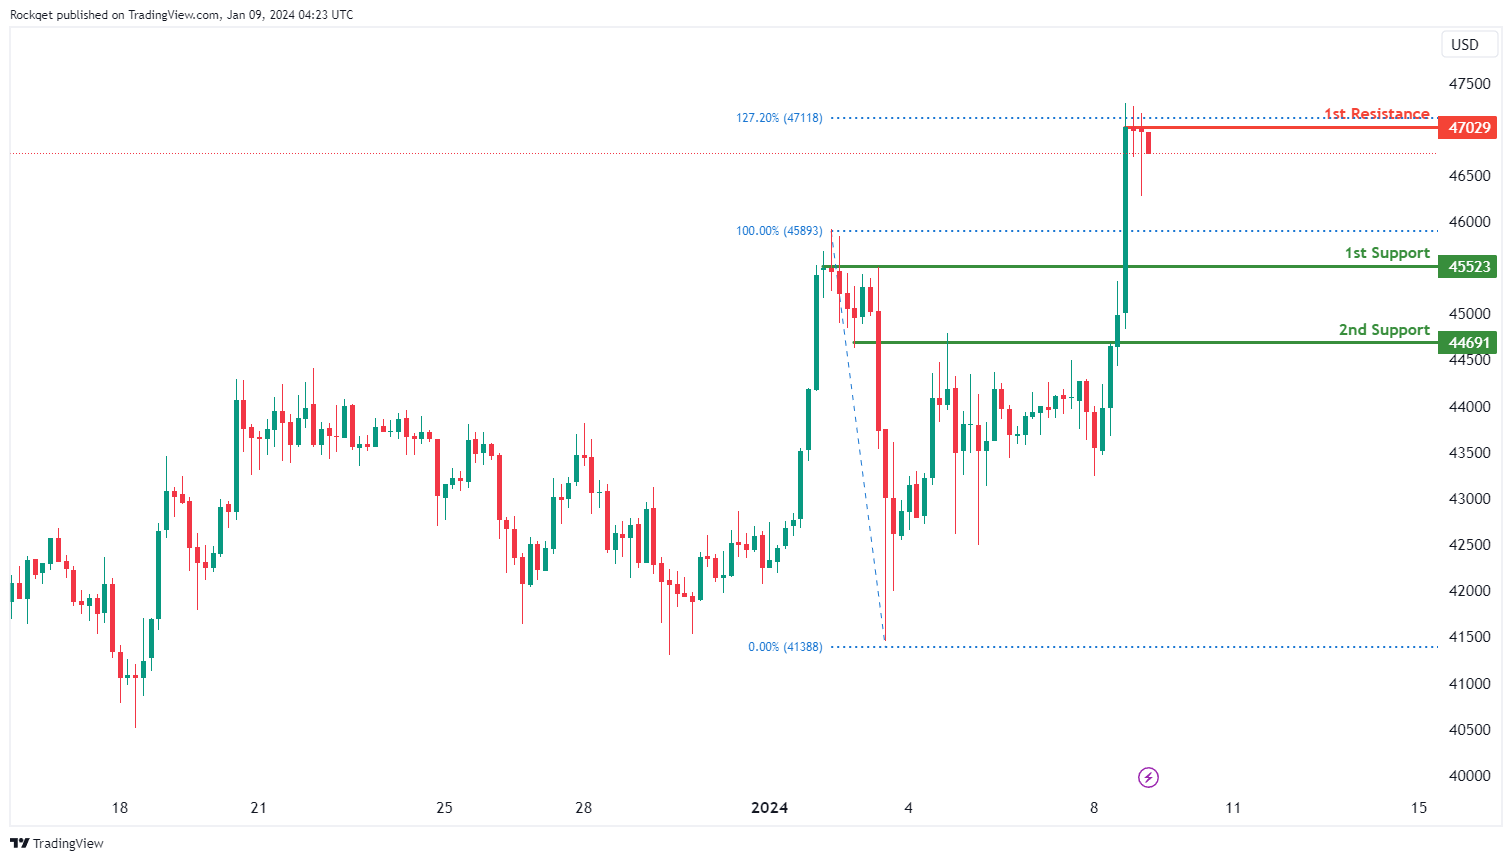
BTC/USD:
The BTC/USD chart currently reflects a bearish overall momentum, suggesting a potential downward trend. There is a scenario in which the price could make a bearish reaction off the 1st resistance and drop to the 1st support.
The 1st support at 45523 is considered favorable as it is identified as a pullback support, indicating historical significance as a level where buying interest has previously emerged.
The 2nd support at 44691 is also recognized as a pullback support, adding to its potential as a support level.
On the resistance side, the 1st resistance at 47029 is identified as a multi-swing high resistance and aligns with the 127.20% Fibonacci Extension, suggesting a level where selling interest could materialize.
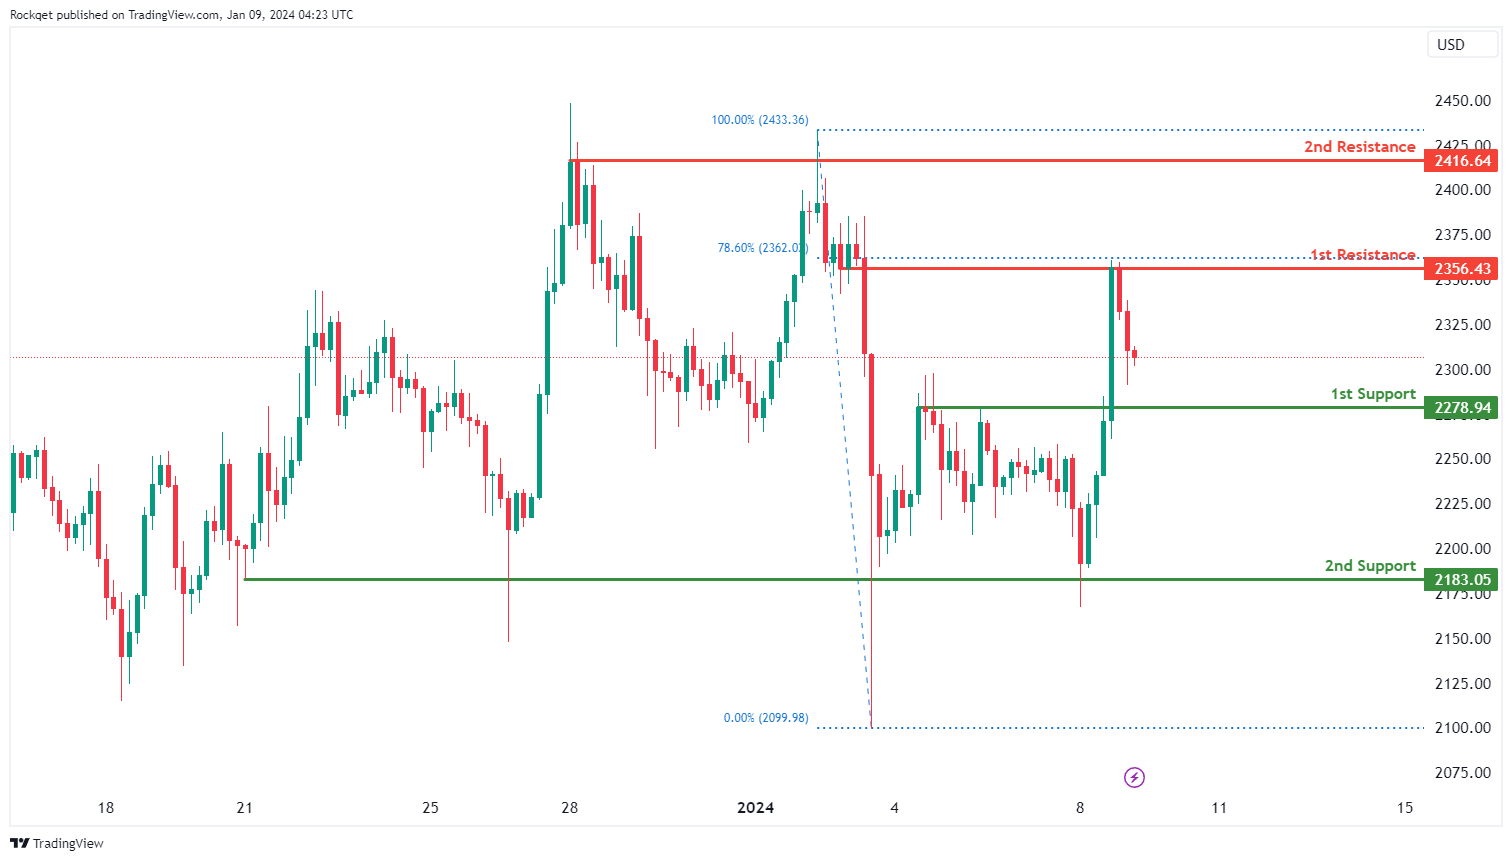
ETH/USD:
The ETH/USD chart currently exhibits a bearish overall momentum, indicating a potential downward trend. There is a scenario in which the price could make a bearish continuation towards the 1st support.
The 1st support at 2278.94 is considered favorable as it is identified as a pullback support, suggesting historical significance as a level where buying interest has previously emerged.
The 2nd support at 2183.05 is also recognized as a multi-swing low support, adding to its potential as a support level.
On the resistance side, the 1st resistance at 2356.43 is identified as an overlap resistance and aligns with the 78.60% Fibonacci Retracement, suggesting a level where selling interest could materialize.
The 2nd resistance at 2416.64 is recognized as a multi-swing high resistance, suggesting a potential barrier for further upside movement.
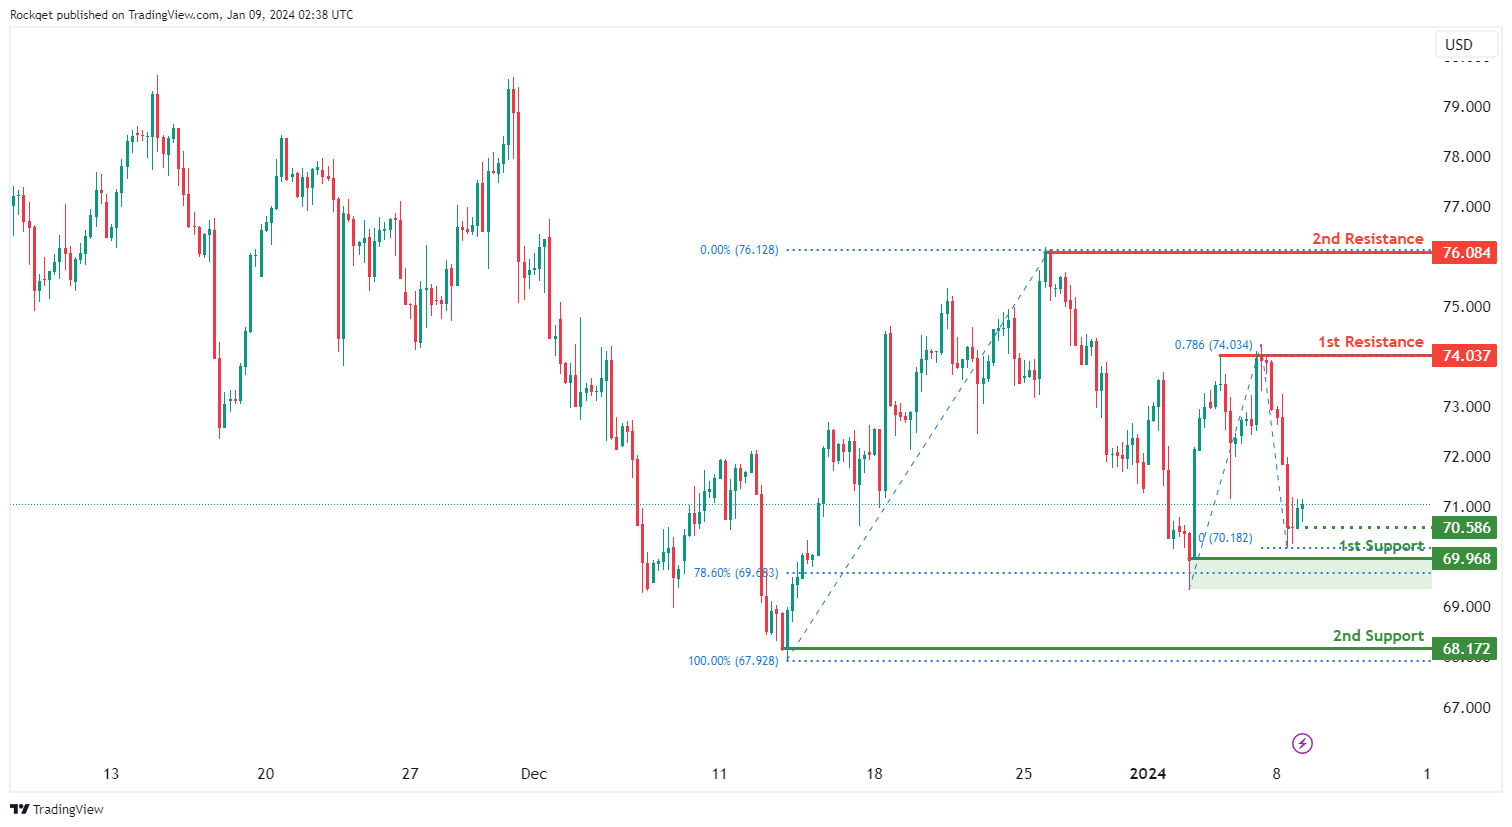
WTI/USD:
The WTI (West Texas Intermediate) chart currently exhibits an overall bearish momentum. However, there is a potential scenario for price to make a bullish reaction off the intermediate support before resuming the downtrend.
The intermediate support level at 70.58 is identified as a pullback support while the 1st support level at 69.96 is noted as a swing-low support that aligns close to the 78.60% Fibonacci retracement level. Further below, the 2nd support level at 68.17 is also marked as a swing-low support, further reinforcing its importance as a key support level.
To the upside, the 1st resistance level at 74.03 is identified as a swing-high resistance that aligns with the 78.60% Fibonacci projection level. Higher up, the 2nd resistance level at 76.08 is also noted as a swing-high resistance, suggesting a potential barrier for further upside movement.
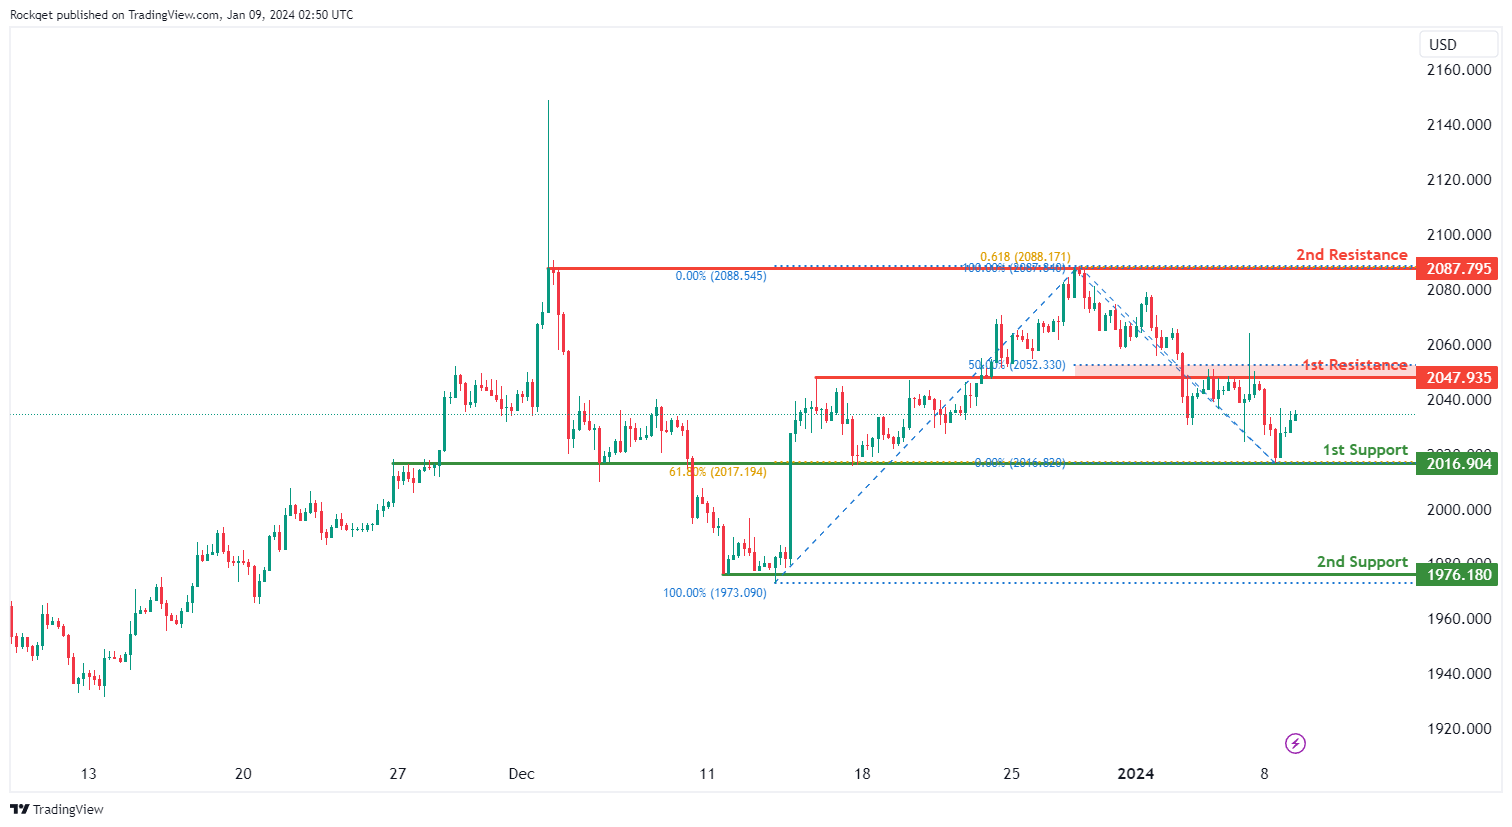
XAU/USD (GOLD):
The XAU/USD chart currently exhibits an overall bearish momentum. However, there is a potential for price to make a bullish rise towards the 1st resistance.
The 1st resistance level at 2,047.93 is identified as an overlap resistance that aligns close to the 50.00% Fibonacci retracement level. Higher up, the 2nd resistance level at 2,087.79 is noted as a swing-high resistance that aligns with the 61.80% Fibonacci projection level, suggesting a potential barrier for further upside movement.
To the downside, the 1st support level at 2,016.90 is identified as an overlap support that aligns with the 61.80% Fibonacci retracement level. Further below, the 2nd support level at 1,976.18 is marked as a swing-low support, further reinforcing its importance as a key support level.
Gold Price Signals Fresh Decline, Upsides Limited
Key Highlights
- Gold prices started a fresh decline from the $2,088 resistance.
- A key bearish trend line is forming with resistance near $2,050 on the 4-hour chart.
- Crude oil prices are also struggling to rise above the $74.00 resistance.
- EUR/USD managed to stay above the 1.0880 support zone.
Gold Price Technical Analysis
Gold gained pace above the $2,050 resistance against the US Dollar. It even broke $2,065 before the bears appeared near the $2,088 zone.
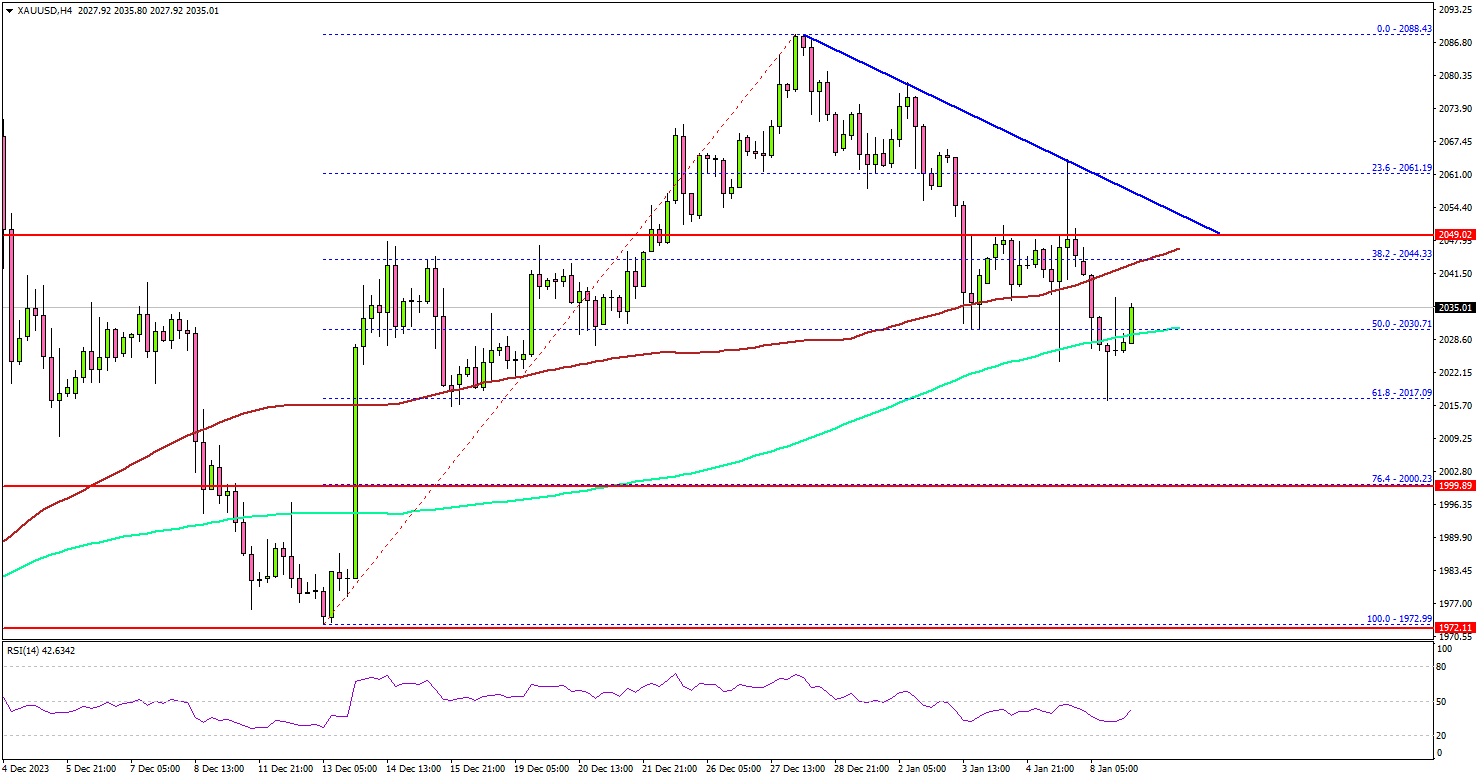
The 4-hour chart of XAU/USD indicates that the price formed a short-term top and started a fresh decline from $2,088. There was a move below the $2,065 support zone, the 100 Simple Moving Average (red, 4 hours), and the 200 Simple Moving Average (green, 4 hours).
There was a clear move below the 50% Fib retracement level of the upward move from the $1,972 swing low to the $2,088 high. Initial support is near the $2,010 level.
The first major support sits near the 76.4% Fib retracement level of the upward move from the $1,972 swing low to the $2,088 high at $2,000. Any more losses might call for a move toward the $1,975 level in the coming days.
On the upside, the price might face resistance near $2,050. There is also a key bearish trend line forming with resistance near $2,050 on the same chart.
An upside break above the $2,050 level could send the price soaring toward the $2,065 resistance. The next major resistance is near the $2,088 level, above which Gold could test $2,120.
Looking at crude oil, the bears seem to be active near the $74.00 zone and there could be a fresh bearish reaction to $68.00.
Economic Releases to Watch Today
- US Goods and Services Trade Balance for Nov 2023 - Forecast $-65.0B, versus $-64.3B previous.
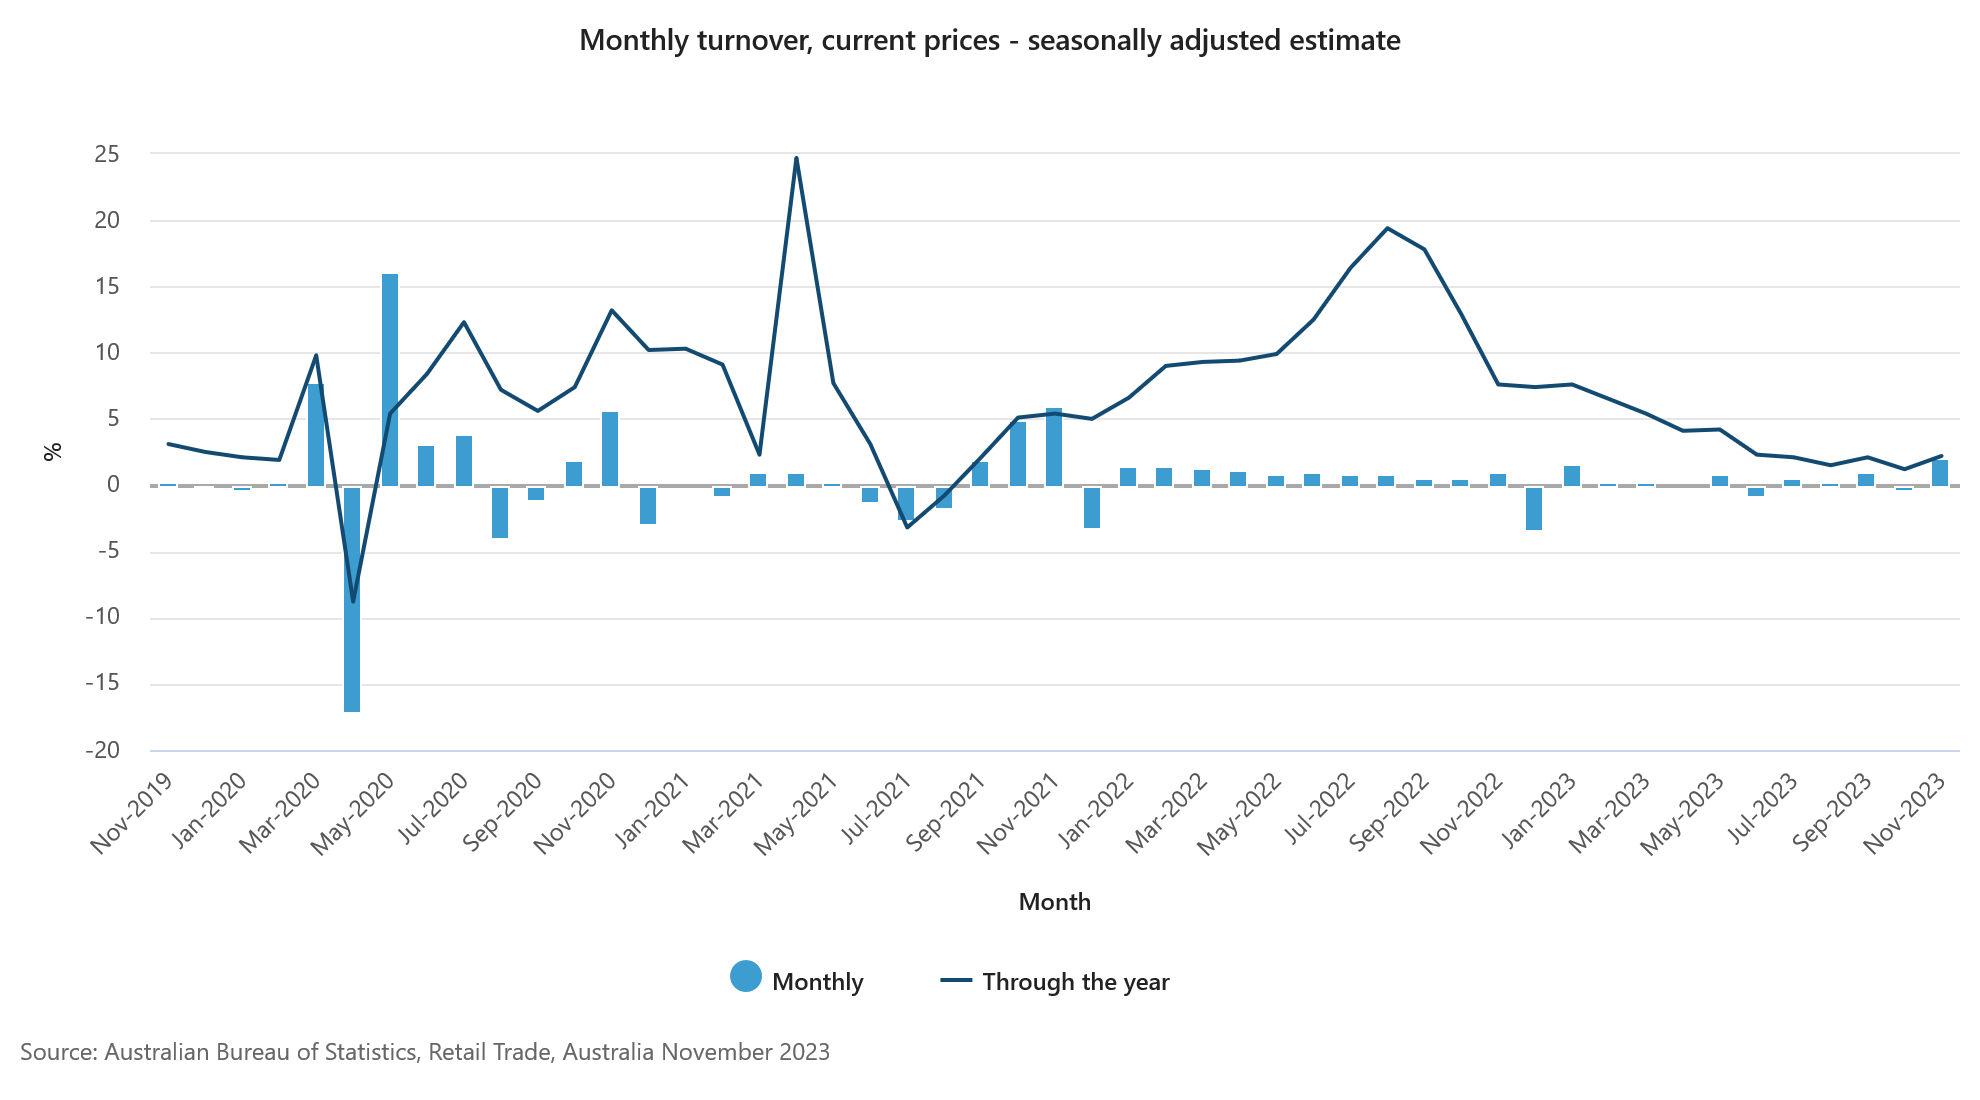
Australia’s retails sales rises 2.0% mom in Nov on Black Friday boost
Australia retail sales rose 2.0% mom to AUD 36.5B in November, above expectation of 1.2% mom. That followed a fell of -0.4% mom in October.
Robert Ewing, ABS head of business statistics, attributed this surge to the impact of Black Friday sales. He noted, "Black Friday sales were again a big hit this year, with retailers starting promotional periods earlier and running them for longer, compared to previous years."
Ewing further explained: "The strong rise suggests that consumers held back on discretionary spending in October to take advantage of discounts in November." Additionally, he observed that shoppers might have advanced some of their Christmas shopping to November, which typically occurs in December.
Japan’s Tokyo CPI core down for the second month to 2.1%
Japan's Tokyo CPI core, which excludes fresh food, slowed from 2.3% yoy to 2.1% yoy in December, aligning with market expectations. This figure represents the lowest reading since June 2022 and marks the second consecutive month of decline.
Additionally, CPI core-core, which excludes both food and energy, also slipped from 3.6% yoy to 3.5% yoy. This marks the fourth consecutive month of cooling in this measure. Headline CPI, similarly fell from 2.6% yoy to 2.4% yoy. T
Tokyo's CPI figures are often regarded as precursors to the national data, suggesting that a similar trend might be observed in the broader Japanese economy.
In separate report, households reduced their spending in November -by 2.9% yoy, worst than expectation of -2.3% yoy. This decrease in consumer spending is attributed to the rising costs of living, which have led to more selective purchasing behaviors among shoppers.
Fed’s Bowman: Current monetary policy deemed sufficiently restrictive
Fed Governor Michelle Bowman indicated yesteday her willingness to consider the possibility that the current policy rate might be adequately restrictive to further reduce inflation.
"My view has evolved to consider the possibility that the rate of inflation could decline further with the policy rate held at the current level for some time," she said in a speech yesterday.
She added that if inflation continues to decrease towards the 2% target, "it will eventually become appropriate to begin the process of lowering our policy rate."
However, she also emphasized "While the current stance of monetary policy appears to be sufficiently restrictive to bring inflation down to 2 percent over time, I remain willing to raise the federal funds rate further at a future meeting should the incoming data indicate that progress on inflation has stalled or reversed."
Fed’s Bostic reiterates importance to staying on path to 2% inflation
Atlanta Fed President Raphael Bostic, in a moderated discussion yesterday, reiterated his expectation of two rate cuts by the Fed this year. He anticipates the first rate cut to occur in the third quarter.
For now, he's "comfortable" with Fed's "restrictive stance". "I just want to see the economy continue to evolve with us in that stance and hopefully see inflation continue to get to our 2% level," he added.
The US is "on a path to 2%" inflation and "the goal is to make sure we stay on the path," he said.
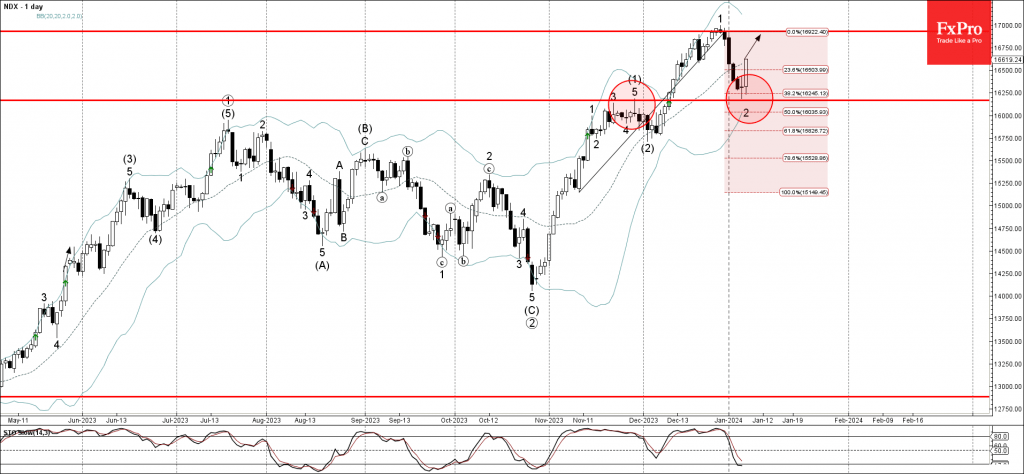
Nasdaq-100 Index Wave Analysis
- Nasdaq-100 index reversed from support level 16170.00
- Likely to rise to resistance level 16930.00
Nasdaq-100 index recently reversed up from the pivotal support level 16170.00 (former double top from the end of November) intersecting with the 38.2% Fibonacci correction of the upward impulse from November.
The upward reversal from the support level 16170.00 stopped the previous short-term correction 2.
Given the predominant daily uptrend, Nasdaq-100 index can be expected to rise further to the next resistance level 16930.00 (previous monthly top from December).
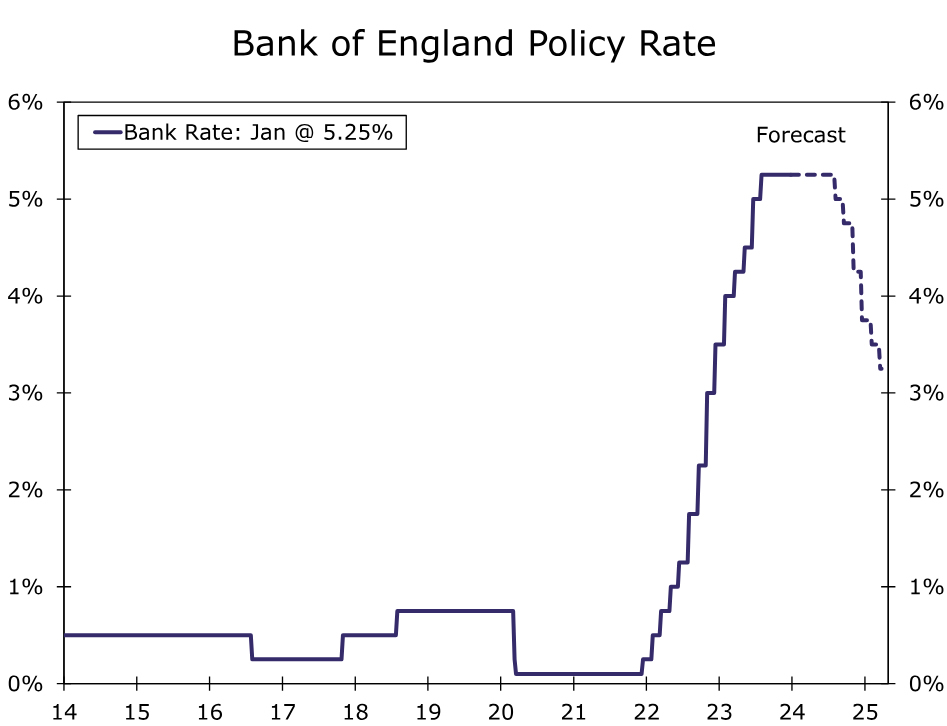
U.K. Slowdown Could Hasten BoE Easing, But By How Much?
Summary
- The U.K. economic environment remains challenging, with Q3 GDP contracting slightly and the fourth quarter starting on a subdued note. Even with some improvement in consumer fundamentals and sentiment surveys, we believe a mild technical recession for the U.K. remains more likely than not.
- Stubborn persistence in U.K. price and wage inflation has started to break, with both prices and wages surprising to the downside in recent months. While these are clearly welcome developments, wage inflation is likely still too high to sustainably achieve the central bank's 2% inflation target, and it's not yet clear how long the more muted pace of price increases will persist.
- The U.K. growth and inflation slowdown suggests the risks are tilted towards an earlier rate cut than our current base case of the August meeting. An initial rate cut could perhaps come in June, possibly May.
- Nonetheless, we still think the risks are tilted towards more gradual easing than reflected in current market pricing, which already sees around a 75% chance of an initial rate cut by the time of the May meeting. Against this backdrop, we think U.K. bond yields could drift higher from current levels. It could also mean moderate gains in the pound against the U.S. dollar as 2024 progresses, especially if—as we expect—the U.S. economy moderates and the Fed eases monetary policy as well.
U.K. Economy Flirting With Recession
Recent data have highlighted the challenging environment still facing the U.K economy. After avoiding the threat of contraction over the past few quarters, revised data for Q3-2023 GDP showed the economy finally shrank by 0.1% quarter-over-quarter, compared to the previously reported flat outcome. The downward revision was due in part to consumer spending which fell 0.5%, a larger than initially reported decline, while exports were revised to show a modest fall in Q3. Finally, with downward revisions also evident in prior quarters, Q3 GDP rose just 0.3% year-over-year, down from an initially reported 0.6% increase.
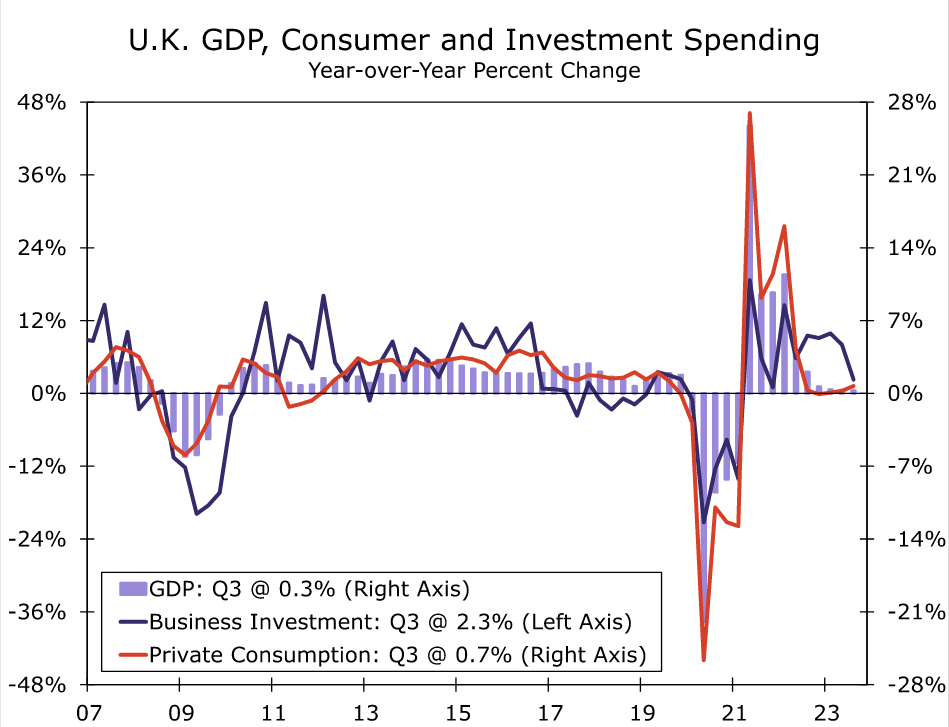
The final quarter of 2023 started on an equally soft footing. For October, U.K. GDP fell a larger-than-forecast 0.3% month-over-month, as services activity fell 0.2% and industrial output fell 0.8%. While unusually wet weather likely crimped activity in some sectors, the level of October GDP was still 0.1% below its Q3 average. That suggests the U.K. is still dangerously close to a (mild) technical recession—that is, two consecutive quarters of negative GDP growth.
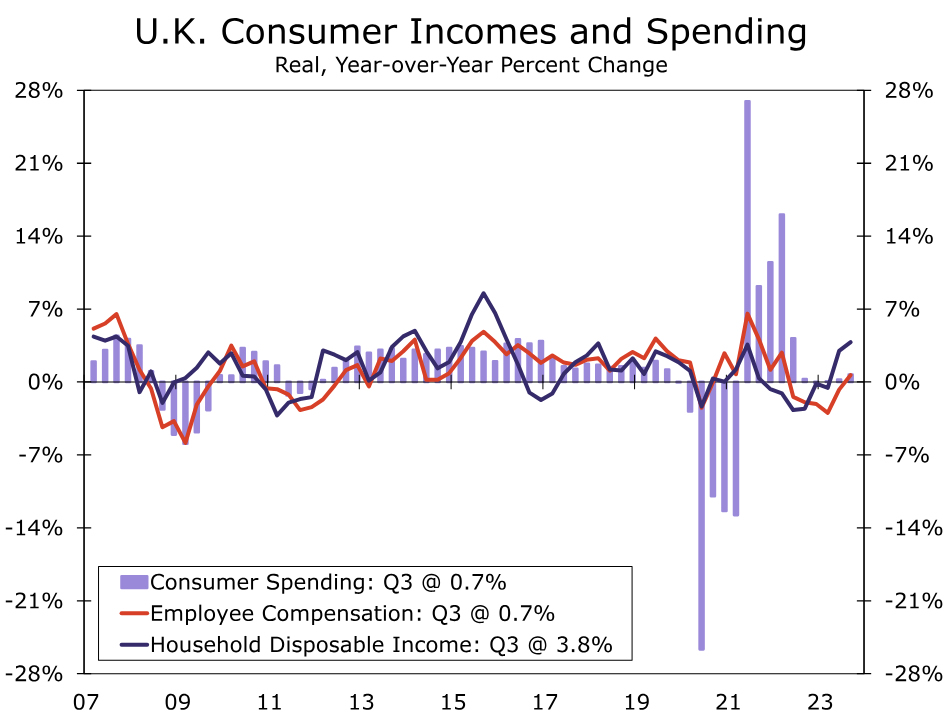
While a technical recession is possible and, indeed, perhaps more likely than not, such a downturn is not yet inevitable. Consumer fundamentals, while mixed, hint that the worst of the U.K consumer slowdown may be behind us. For the third quarter the rise in nominal household incomes outpaced the increase in prices, meaning that Q3 real household disposable income rose 0.4% quarter-over-quarter and is now up 3.8% year-over-year. Combined with subdued consumer spending, that also led to an increase in the household savings rate to 10.1% of disposable income in Q3. The savings rate is up from 9.5% in Q2, and well above the levels that prevailed prior to the pandemic. On a less encouraging note, and something of an offset to these improving fundamentals, the Bank of England's interest rate hikes are increasingly flowing through to household budgets and cash flows. For Q3-2023, interest costs represented 5.5% of household income, around four times the1.4% of income as recently as Q3-2021. Still, considering the improving trends in real incomes and household savings, further declines in U.K. consumer spending may be limited, even given the backdrop of sharply higher interest rates over the past several quarters.
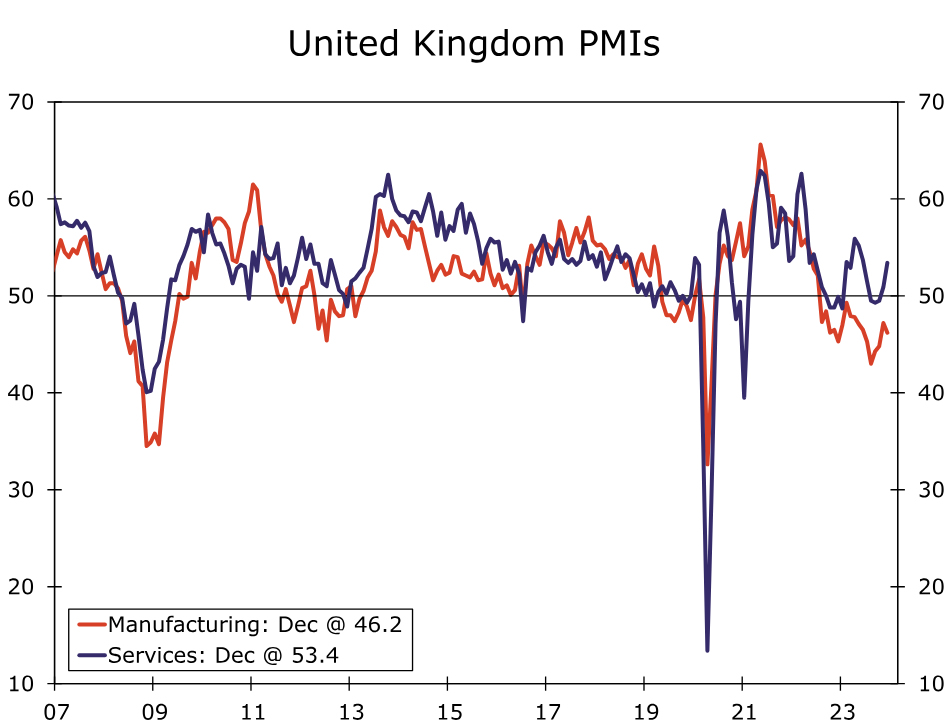
Sentiment surveys also offer hope that the U.K. economy could end the fourth quarter on a better note than it started. The U.K. manufacturing PMI slipped to 46.2 in December, and has been contraction territory since mid-2022. However, for the more economically dominant service sector, the services PMI has improved in recent months. The U.K. services PMI rose to 53.4 in December, a level consistent with moderate expansion. Overall, recent economic indicators are mixed, and we still lean towards a mild U.K. recession. But regardless of whether that recession occurs, our outlook for the U.K. economy is decidedly subpar. Our base case forecast is for U.K. GDP growth of 0.5% in 2023 and 0.1% for 2024, even if improving sentiment surveys hint at modest upside risk to the 2024 outlook.
U.K. Inflation Fever Is Breaking
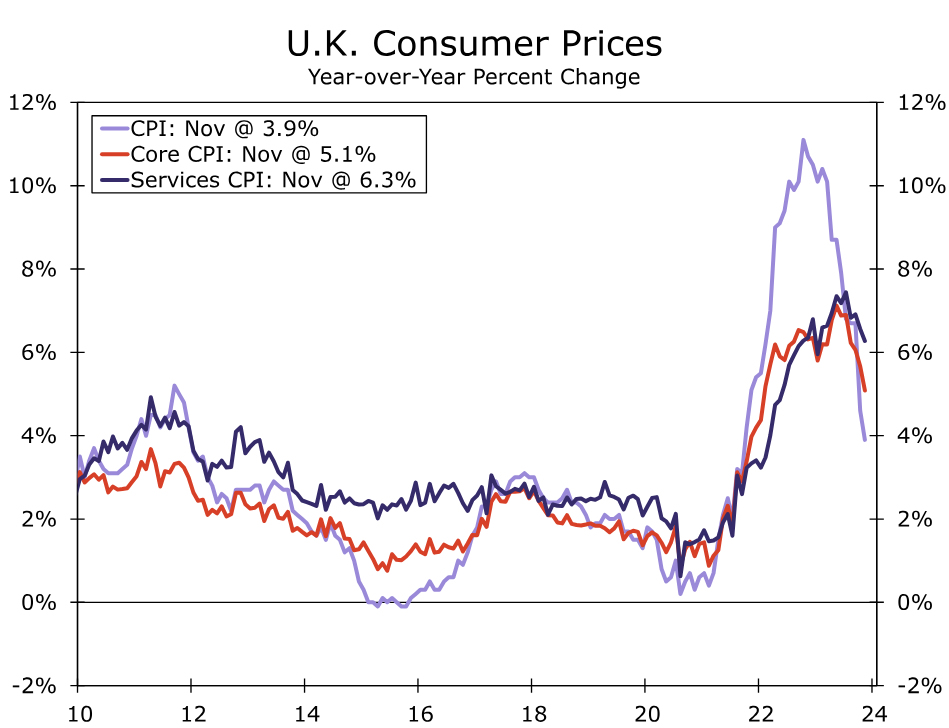
Just as U.K. economic growth has apparently come under increasing pressure, a more welcome development has been a significant improvement in U.K. inflation trends. U.K. price inflation and wage inflation trends have been stubbornly elevated for an extended period, and more so than for peer economies such as the Eurozone and United States. In recent months, however, the U.K. has started to enjoy favorable surprises on the price and wage front, at least as it pertains in returning CPI inflation towards its 2% inflation target. For November, U.K. headline inflation slowed more than forecast to 3.9% year-over-year, the slowest pace since late 2021. U.K. core inflation and services inflation similarly surprised to the downside, slowing to 5.1% and 6.3% respectively. In fact, we estimate that on a three-month annualized basis the U.K. core CPI has slowed below a 2% pace, although it is not yet clear that muted rate of price increase will continue.
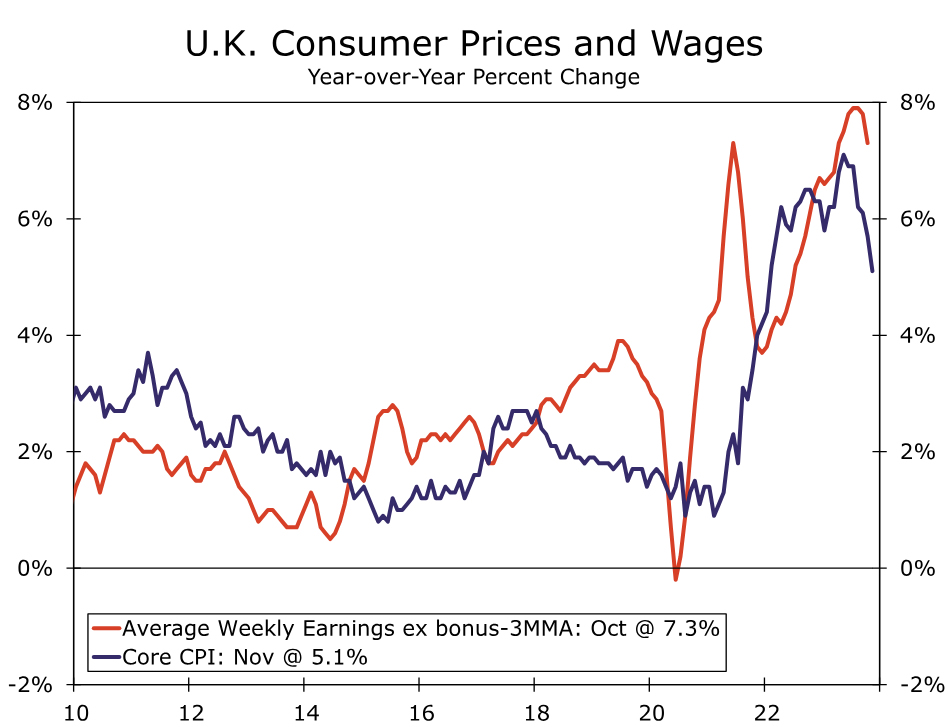
In addition, stubbornly persistent wage growth has also shown some signs of easing in recent months. In particular, growth in average weekly earnings slowed more than expected to 7.2% year-over-year for the three months to October, while growth in average weekly earnings excluding bonuses slowed to 7.3% for the same period. While that slower wage growth is clearly a welcome development from an inflation-fighting perspective, for now the pace of wage growth is probably still at a level that is inconsistent with CPI inflation returning to and staying at the 2% target over a long term horizon.
Before the most recent slowing and in U.K. growth and inflation, and amid a backdrop of hawkish comments from Bank of England (BoE) policymakers who had pledged to keep interest rates “higher for longer”, we took the opportunity to adjust our BoE monetary policy outlook, anticipating a later initial rate cut in August. That timing adjustment now appears to be somewhat inopportune, and the latest deceleration in the U.K. economy could still elicit earlier rather than later Bank of England monetary easing.
Nonetheless, the outlook remains quite uncertain at this point. As we highlighted above, it is not clear how long the recent muted pace of price increases will last, and we still view the current level of wage inflation as inconsistent with achieving the 2% inflation target on a sustainable basis, suggesting that even with the softening in U.K. data, BoE rate cuts are not imminent. That is, BoE rate cuts could occur earlier than our base case of the August meeting, but not much earlier—perhaps June, and certainly no earlier than May. The BoE's monetary policy announcement on 1 February, which will include updated policy guidance and economic projections in the accompanying Inflation Report, should provide further clarity into the outlook for U.K. monetary policy. That is, whether an initial August rate cut still seems likely, or a June or May cut seem more probable.
Even if the outlook is not entirely certain, we still believe the risks are tilted towards more gradual easing than market participants currently expect. At this time a May BoE rate cut is already 75% priced in by market participants. While we think an initial cut in May is possible, we also think initial moves in June or August also remain in play. The risk of more gradual Bank of England easing than currently expected by market participants could see U.K. bond yields drift higher from current levels. Higher bond yields and gradual easing could also see moderate gains in the pound against the U.S. dollar as 2024 progresses, especially if—as we expect—the U.S. economy moderates and the Fed eases monetary policy as well.