
Sample Category Title
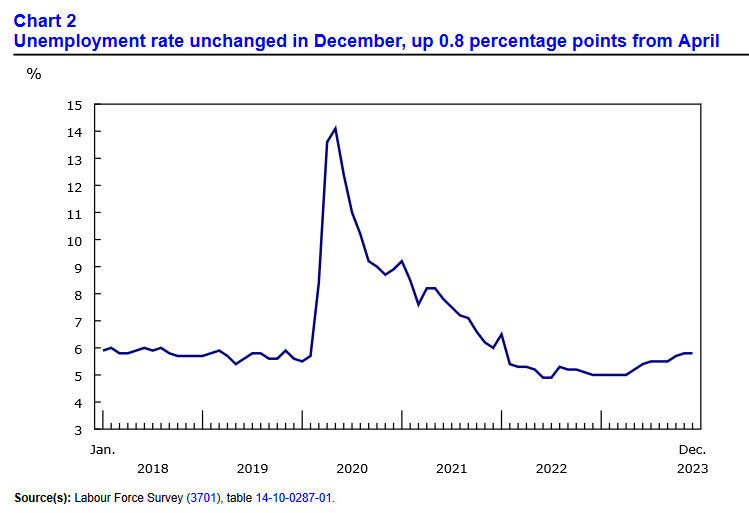
Canada’s employment rises 0.1k in Dec, vs exp 13.2k
Canada's employment rose 0.1k in December, well below expectation of 13.2k.
Employment rate fell -0.2% to 61.6%. Unemployment rate was unchanged at 5.8%. Participation rate fell -0.2% to 65.4%. Total hours worked rose 0.4% mom , 1.7% yoy. Average hourly wages rose 5.4% yoy.
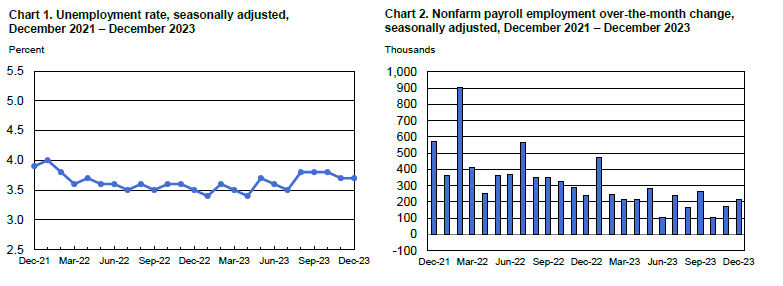
US NFP rises 216k, unemployment rate unchanged at 3.7%
US non-farm payroll employment grew 216k in December, above expectation of 168k. Unemployment rate was unchanged at 3.7%, below expectation of a rise to 3.8%. Participation rate fell from 62.8% to 62.5%. Average hourly earnings rose 0.4% mom, above expectation of 0.3% mom. Over the past 12 months, average hourly earnings increased 4.1% yoy.
EUR/USD Slips, Eurozone Inflation Rises
- Eurozone inflation rises, core rate dips
- US nonfarm payrolls expected to drop to 177,000
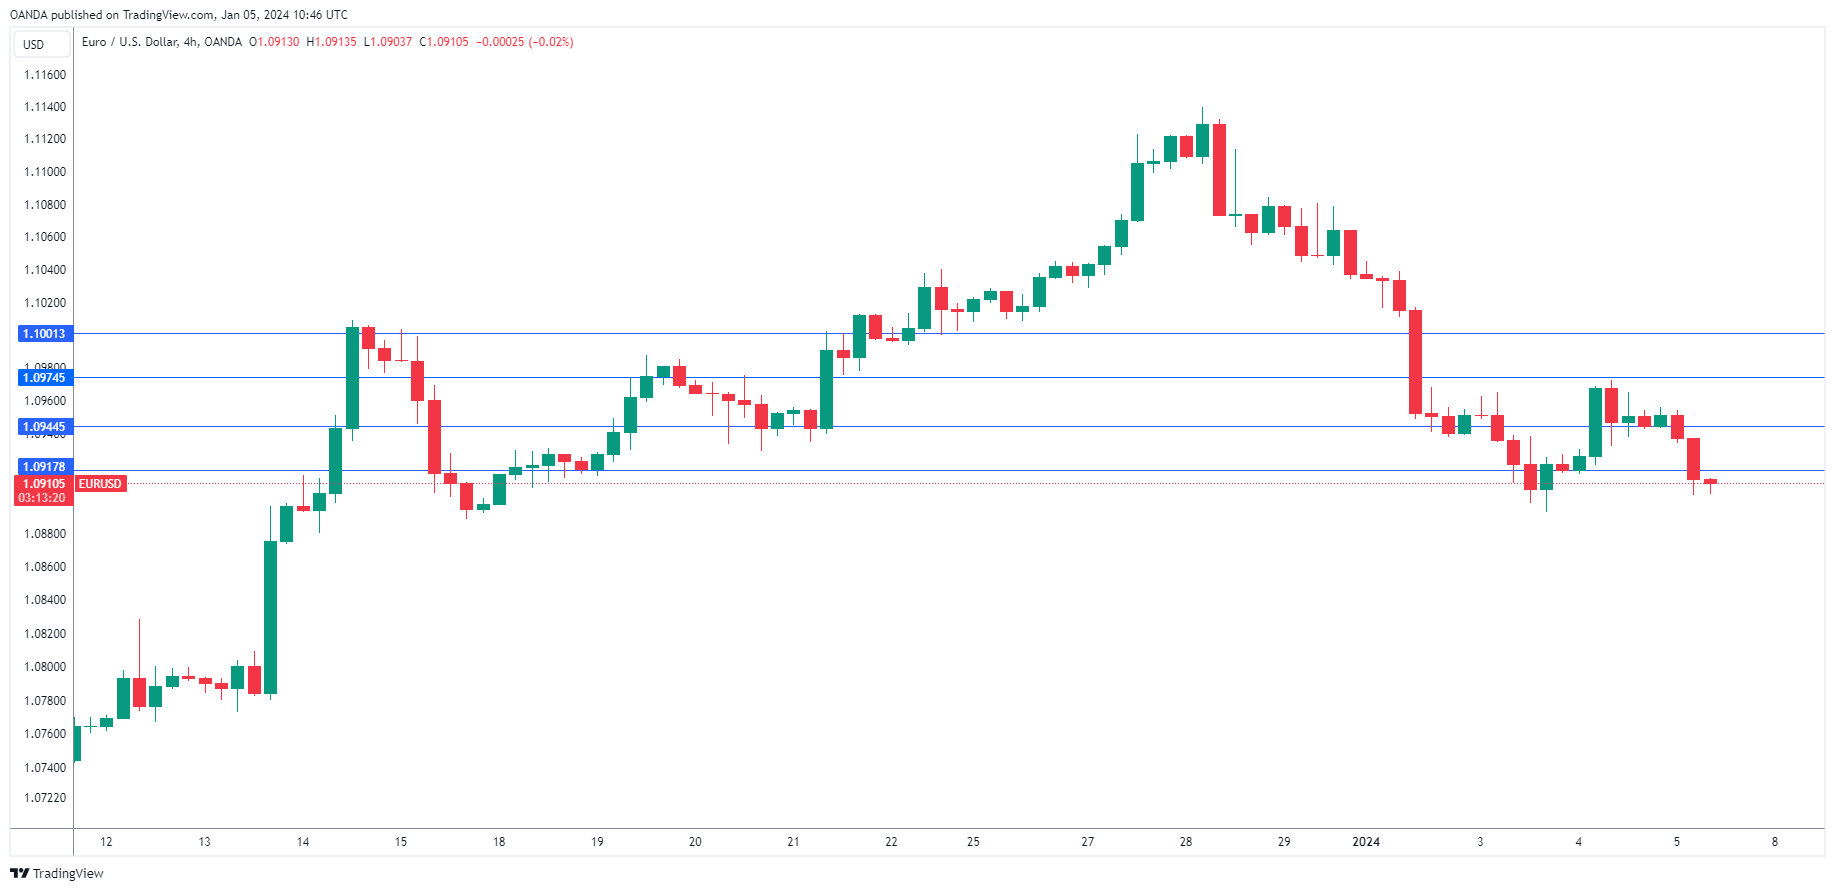
The euro is in negative territory on Friday. In the European session, EUR/USD is trading at 1.0908, down 0.33%.
Eurozone inflation rises to 2.9%
Eurozone inflation has been falling and dropped to 2.4% y/y in November, within striking distance of the 2% target. The downward trend reversed itself in December, as CPI jumped to 2.9%, just below the consensus estimate of 3.0%. This was the first uptick in inflation since April. There was better news from Core CPI, which dropped to 3.4% y/y, matching the consensus estimate and down from 3.6% in November. This marked the lowest level for the core rate since March 2022.
The eurozone inflation report should not have come as a surprise, as Germany, the bellwether of the eurozone, posted similar numbers earlier this week. German CPI rose to 3.7% y/y, up from 3.2%, while the core rate fell from 3.7% to 3.5%. I don’t expect the European Central Bank to lose much sleep over a spike in one inflation report but policy makers will be on the alert for inflation continuing to rise. The drop in Core CPI is an encouraging sign, as the core rate is considered a more accurate gauge of inflation trends than the headline release.
US nonfarm payrolls expected to ease
All eyes will be on the US payrolls release later today. The consensus for the December report stands at 177,000, down from 199,000 in November. The markets will be keeping an eye on wage growth, which is projected to ease to 3.9% y/y, compared to 4.0% in October. This would mark the lowest annual gain since mid-2021. The Fed would like to see wage growth decline as it is a driver of inflation. Fed policymakers will be pleased if the releases are within expectations, as it would indicate that the labour market remains solid but is slowly cooling.
The US will also release the ISM Services PMI for December. The services sector has expanded for 11 straight months and is expected at 52.7 for December, little changed from 52.6 a month earlier.
EUR/USD Technical
- EUR/USD is testing support at 1.0944. Below, there is support at 1.0917
- 1.0974 and 1.1001 are the next resistance lines
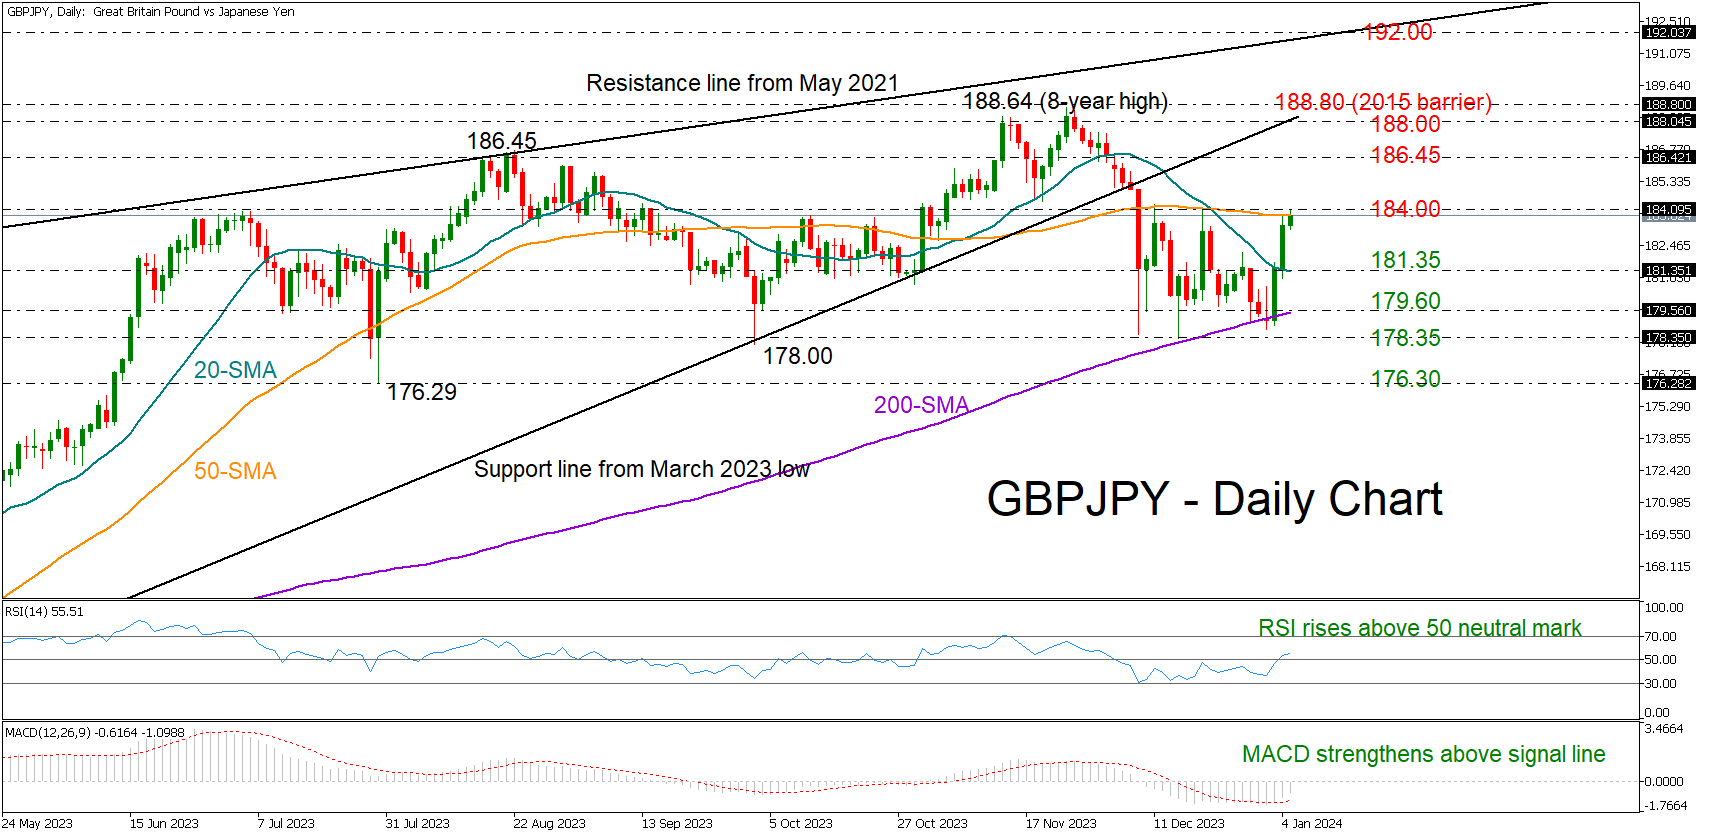
GBPJPY Bullish Near the Top of a Short-term Range
- GBPJPY meets former resistance after quick bounce
- Technical signals endorse a bullish breakout
GBPJPY pivoted swiftly near its 200-day simple moving average (SMA) and recovered a three-week-old soft downturn but despite that, it's still struggling to exit the short-term range above the tough 50-day SMA at 183.90.
The technical indicators are feeding optimism that buying appetite could strengthen in the coming sessions. The RSI has crawled above its 50 neutral mark, while the MACD keeps deviating above its red signal line.
If the pair successfully pierces through the 50-day SMA and the 184.00 number, it could accelerate towards August’s peak of 186.45. The area between the 188.00 round level and November’s eight-year high of 188.65 could be the next destination on the way up. Should upside forces persist above the 2015 barrier of 188.80, the price might post a new higher high near the 192.00 mark. Interestingly, this is where the long-term resistance line from June 2021 is located.
In the event the 50-day SMA stands firm, the price might seek support near its 20-day SMA at 181.35. Failure to rebound there would shift the spotlight back to the 200-day SMA at 179.60. A break lower could immediately stabilize around the 178.35 floor, which has been limiting downside corrections over the past five months. If that collapses too, the sell-off might intensify towards the key 176.30 constraining zone.
Summing up, GBPJPY is holding a bullish bias near an important resistance area in the short-term picture. A close above 184.00 could trigger the next rally in the market.
USDCHF Sustains Weekly Gains Ahead of Jobs Data
- USDCHF’s rebound is not convincing yet
- A continuation above 20-SMA could boost sentiment
- US nonfarm payrolls report due at 13:30 GMT
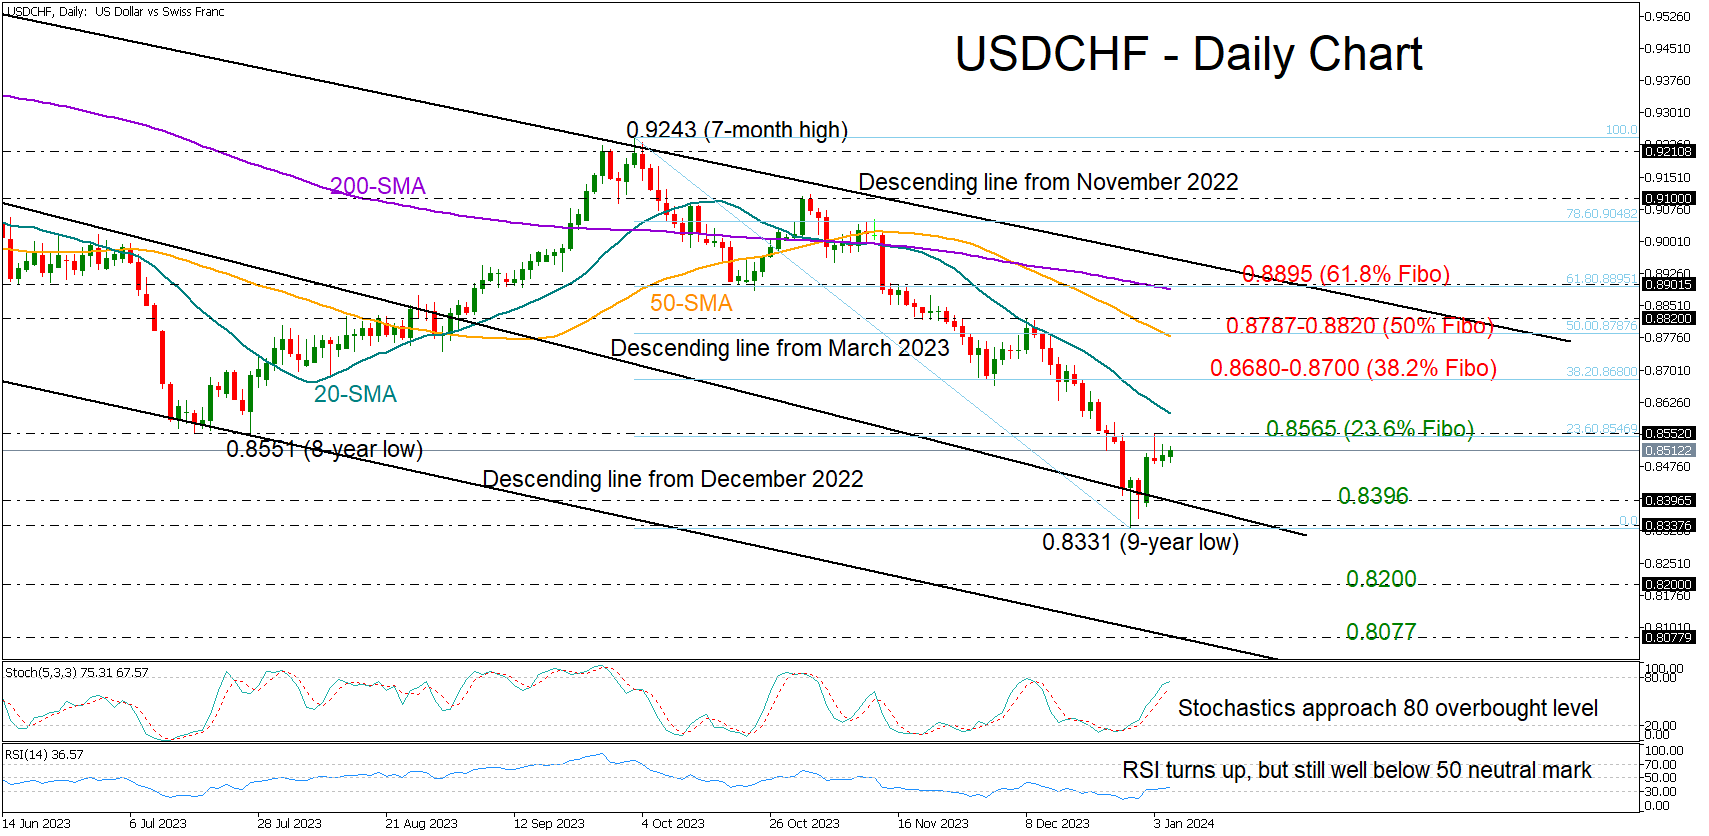
USDCHF is set to close the first week of the year within the positive area, having secured a strong foothold around the support-turned-resistance trendline from March 2023 at 0.8400 following the flash drop to an almost nine-year low of 0.8331.
That said, the latest upturn in the price hasn’t gained credence yet as the constraining 23.6% Fibonacci retracement of the October-December 2023 downleg could still cap bullish forces around 0.8565 along with the 20-day simple moving average (SMA). The technical signals are reflecting some caution as well. The stochastic oscillator has risen closer to its overbought levels, whilst the RSI, although stronger, is comfortably below its 50 neutral mark.
If the recovery continues above the 20-day SMA at 0.8600, the bulls could advance towards the 38.2% Fibonacci of 0.8680 and the 0.8700 psychological level. Moving higher, they might next challenge the 50-day SMA and the 0.8787-0.8820 region, where the pair peaked in December.
Alternatively, a downside correction could initially pause somewhere between the falling trendline at 0.8396 and December’s low of 0.8331. If that floor cracks, the downtrend could examine the 0.8200 round level before stretching towards the support line from December 2022 at 0.8077.
In brief, USDCHF seems to have found an ideal place for a rebound, though buyers would like a confirmation above the 20-day SMA and the 0.8600 number to drive it higher.
Could US 500 Cash Index Correction Have Legs?
- US 500 index is in the red again today
- Correction underway since touching the 4,796 high
- Momentum indicators support the current bearish move
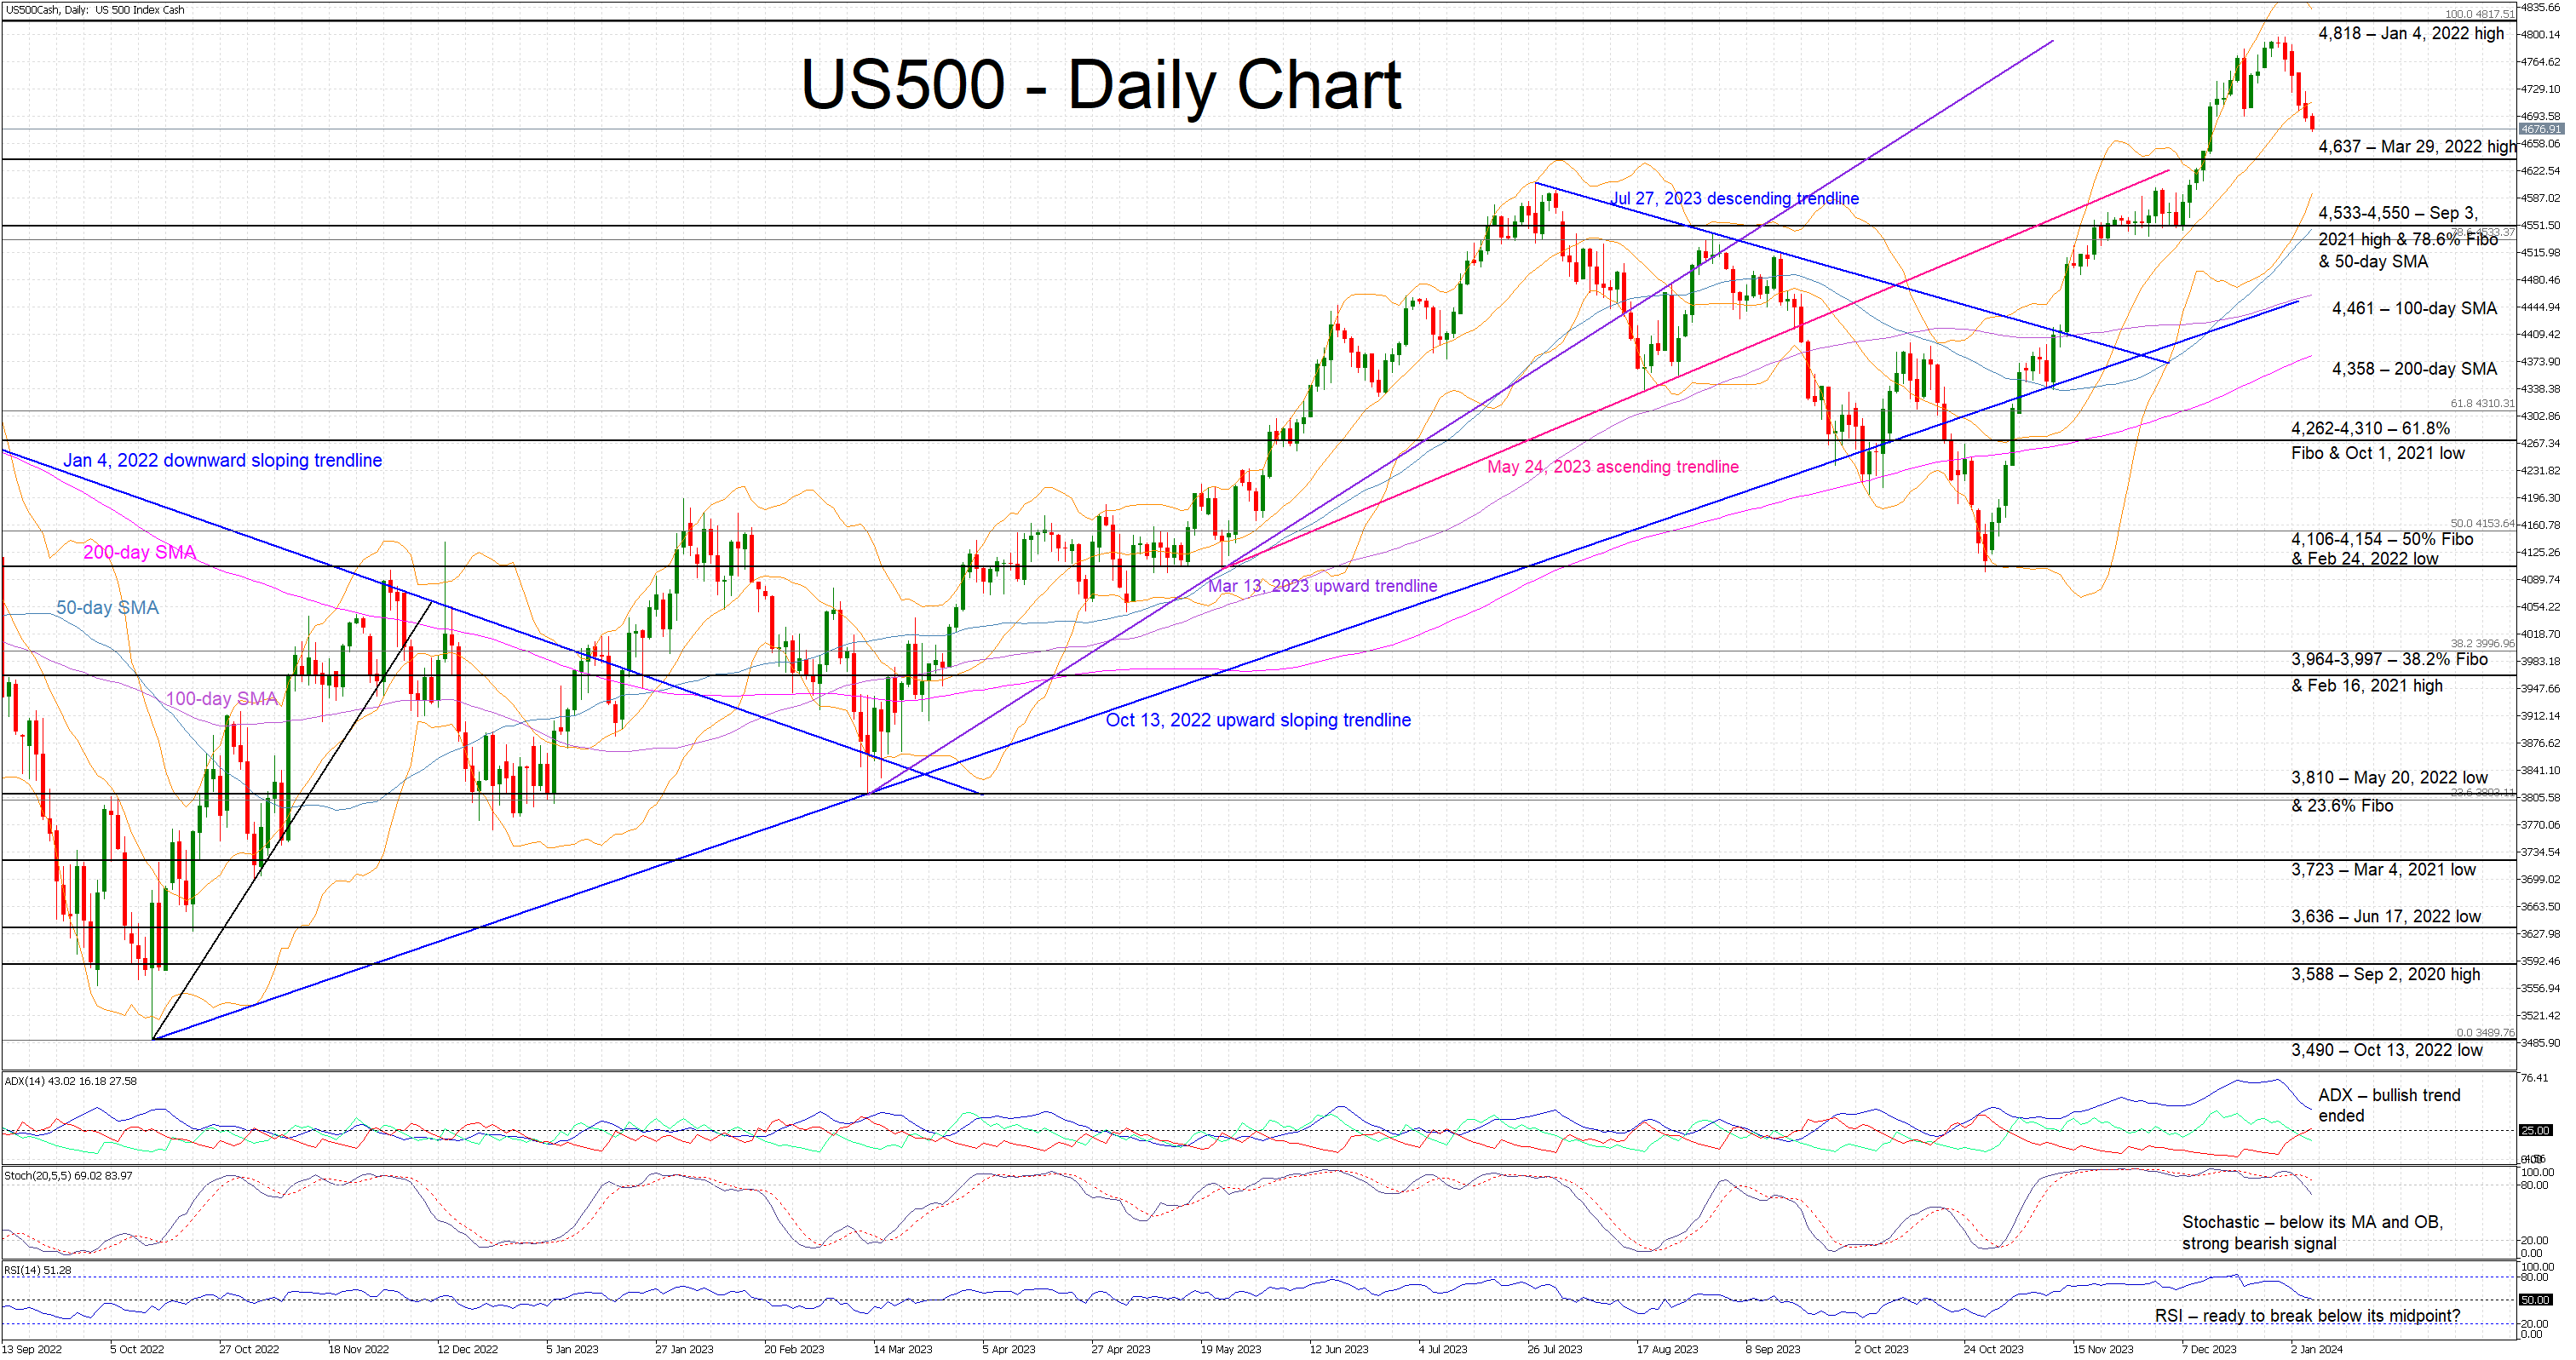
The US 500 cash index is trying to record its sixth consecutive red candle, starting 2024 in a rather negative note. The current correction could gain further traction if the data releases on Friday disappoint market participants. Having said that the US 500 index remains around 14% higher than the October 27, 2023 low of 4,100.
The recent bullish trend is still assumed to be in place, but the momentum indicators have turned firmly in favour of the bears’ side at this stage. The Average Directional Movement Index (ADX) is edging aggressively towards its 25-midpoint, signaling the end of the recent bullish trend. Similarly, the RSI is preparing to break below its 50-midpoint for the first time in two months. More importantly, the stochastic oscillator has finally broken below both its moving average and overbought territory. This move is usually seen as a strong bearish signal.
The bears are trying to regain the upper hand and are keen to push the US 500 index below the March 29, 2022 high at 4,637. If successful, they could have a go at testing the support set by the 4,533-4,550 area, which is populated by the September 3, 2021 high, the 78.6% Fibonacci retracement level of the January 4, 2022 – October 12, 2022 downtrend and the 50-day simple moving average (SMA). Even lower, the 100-day SMA at 4,461 could prove tougher to crack than currently envisaged.
On the flip side, the bulls could first try to keep the US 500 index above the 4,637 level. They could then stage a move towards the 2023 high and eventually test the resistance set by the January 4, 2022 high at 4,818. Even higher, the 4,900 level looks like the plausible next target.
To conclude, the impressive rally in the US 500 index from the October lows has been followed by a correction that could get further traction on the back of bearish momentum indicators.
USD/JPY: The Price Reaches Resistance at 145 Yen per US Dollar
As of Friday morning, the situation on the USD/JPY market deserves attention:
→ the US dollar is on course to demonstrate its strongest week since July 2023. The media writes that markets are adjusting expectations regarding the easing of monetary policy by the Fed.
→ The yen fell about 3% against the US dollar in the first week of the year, which could be its weakest weekly performance since August 2022.
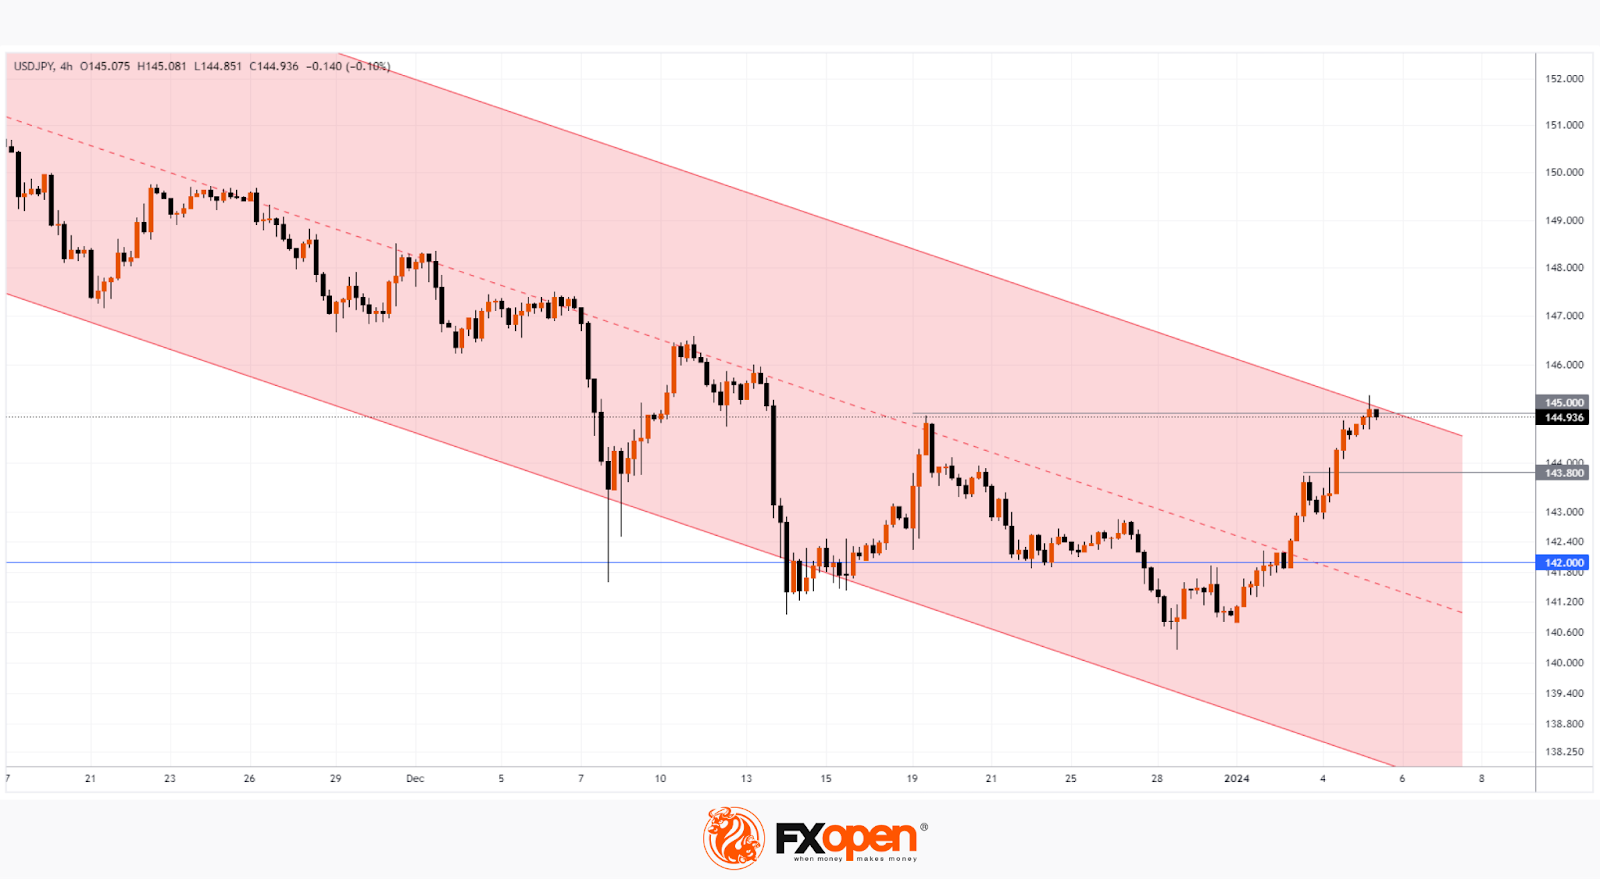
The USD/JPY chart shows that:
→ the price moves within the descending channel (shown in red). Growth at the beginning of the year expanded its boundaries along the principle of a parallel channel.
→ the median line has been broken by the bulls. The price action around 142 shows increased demand. The price could not consolidate below this level in December, serving as a powerful support for ending panic on December 7 and 14-15. Also, demand forces did not allow the price to reach the lower border of the channel on December 28.
Note that the bulls managed to break above the psychological level of 145, something they failed to do on December 19 when a notable high was formed. Thus, the market is in a vulnerable position for a pullback from the upper boundary of the channel after rapid growth in the first days of the year. If this happens, a false bullish breakout of the psychological level of 145 will form on the chart. The bears will have a chance to resume the trend, but given the listed signs of demand strength around the 142 yen per dollar level, they will have to make significant efforts to do this.
Be careful, today at 16:30 GMT+3 there will be news on the labour market in the US, which may affect the USD exchange rate.
This article represents the opinion of the Companies operating under the FXOpen brand only. It is not to be construed as an offer, solicitation, or recommendation with respect to products and services provided by the Companies operating under the FXOpen brand, nor is it to be considered financial advice.
Eurozone PPI down -0.3% mom, -8.8% yoy in Nov
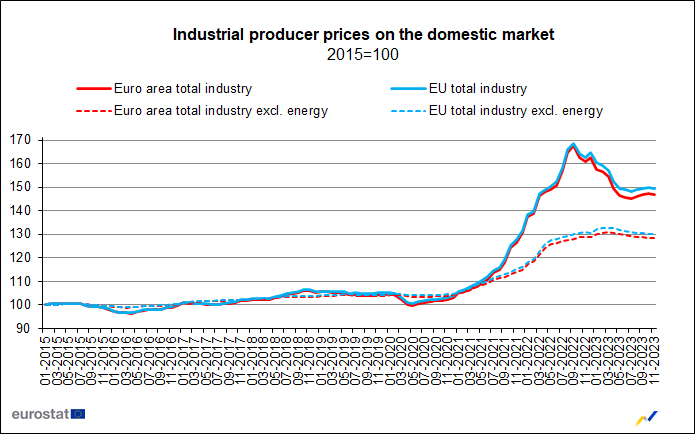
Eurozone PPI was down -0.3% mom, -8.8% yoy in November, versus expectation of -0.1% mom, -8.7% yoy. For the month, industrial producer prices, decreased by -0.8% for energy, by -0.5% for intermediate goods and by -0.1% for both capital goods and durable consumer goods, while prices remained stable for non-durable consumer goods. Prices in total industry excluding energy decreased by -0.2%.
EU PPI was down -0.2% mom, -8.1% yoy. The largest monthly decreases in industrial producer prices were recorded in Slovakia (-3.0%), Portugal (-2.3%) and Spain (-2.1%), while the highest increases were observed in Sweden (+4.1%), France (+2.4%) and Bulgaria (+0.7%).
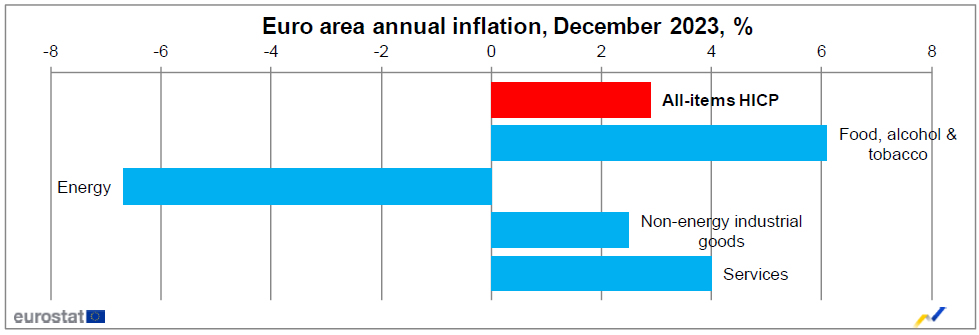
Eurozone CPI rises to 2.9% yoy in Dec, core CPI down to 3.4% yoy
Eurozone CPI reaccelerated from 2.4% yoy to 2.9% yoy in December, below expectation of 3.0% yoy. Core CPI (excluding energy, food, alcohol & tobacco) slowed from 3.6% yoy to 3.4% yoy, matched expectations.
Looking at the main components, food, alcohol & tobacco is expected to have the highest annual rate in December (6.1%, compared with 6.9% in November), followed by services (4.0%, stable compared with November), non-energy industrial goods (2.5%, compared with 2.9% in November) and energy (-6.7%, compared with -11.5% in November).
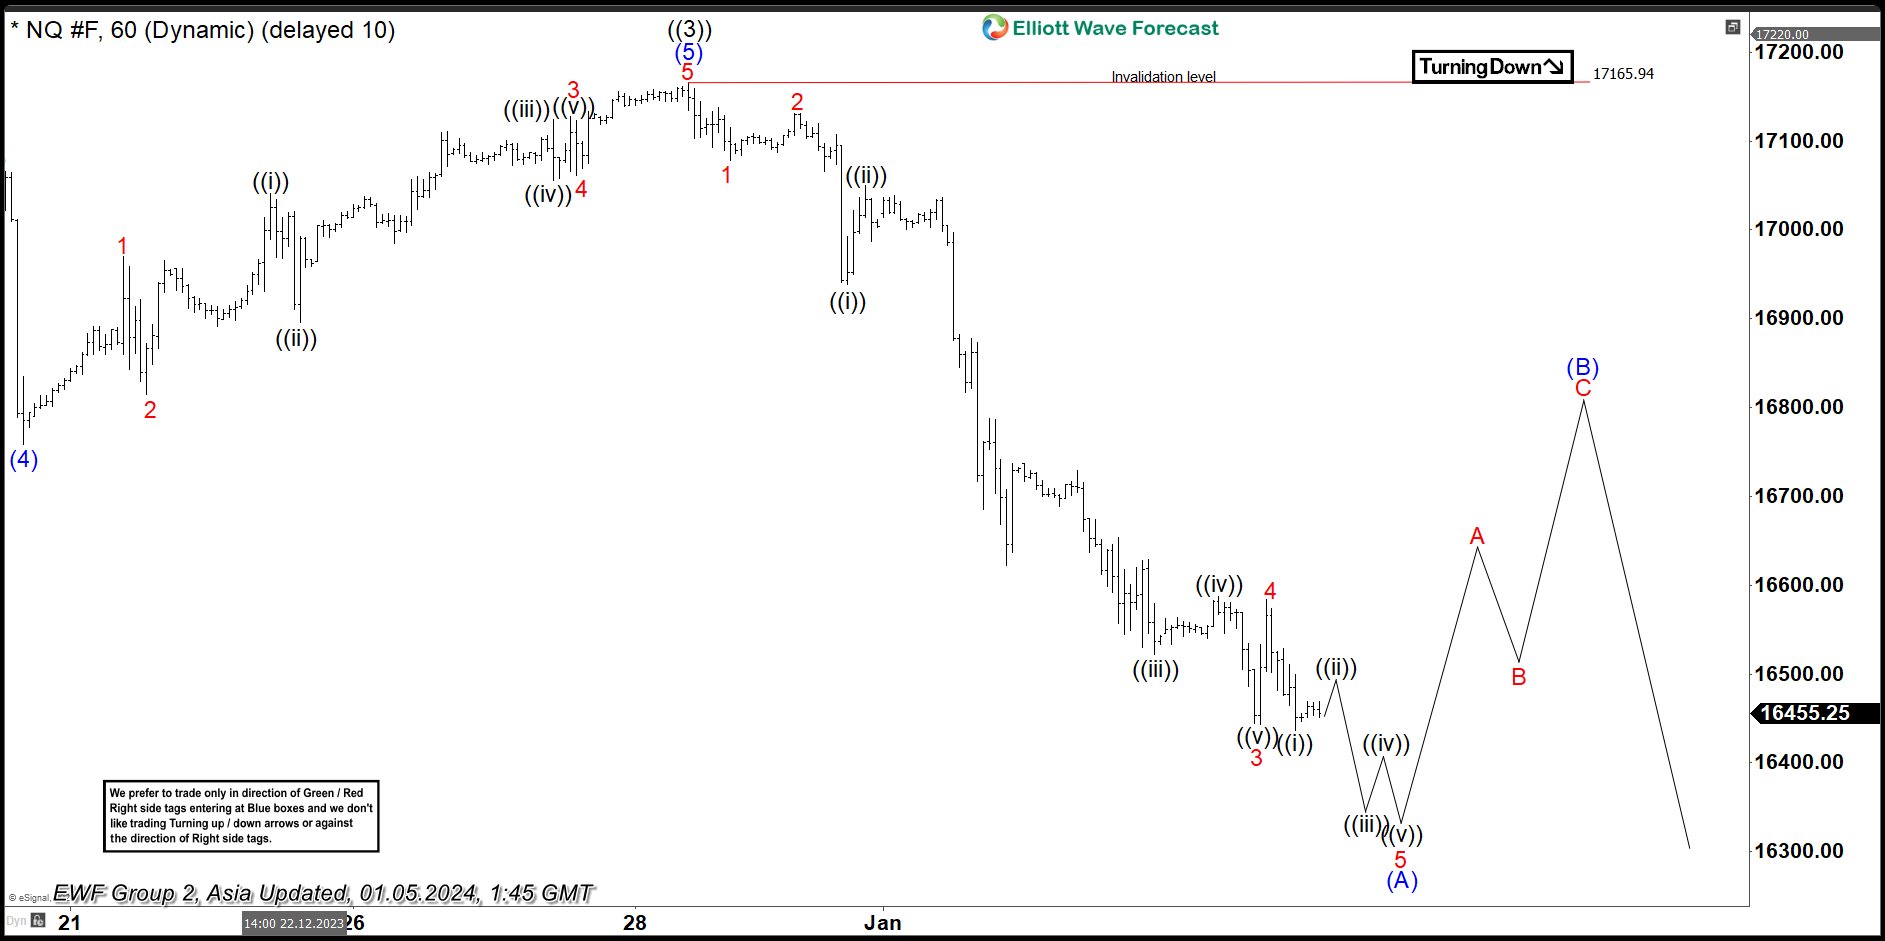
Nasdaq 100 (NQ_F) Looking to do Correction Within Bullish Trend
Nasdaq 100 (NQ_F )shows a bullish sequence from October 2022 low favoring further upside. The rally higher from 10.13.2022 is unfolding as Elliott Wave leading diagonal. Up from 10.13.2022 low, wave ((1)) ended at 16062.75 and pullback in wave ((2)) ended at 14140.25 low. Wave ((3)) finished at 17165.94 high as the 1 hour chart below shows. Pullback as wave ((4)) is currently in progress with internal subdivision of a zigzag (A), (B) and (C).
Down from ((3)), wave (A) is developing an impulse structure. Wave 1 ended 17077.75 low and bounced slightly completing wave 2 at 17131.00. Wave ((i)) of 3 in lesser degree ended at 16938.25 low and pullback as wave ((ii)) ended at 17049.75 high. Then, the Index dropped strongly to 16522.00 to complete wave ((iii)). Wave ((iv)) bounce ended 16587.25 and last leg lower ended at 16443.25 as wave ((v)). This completed wave 3 in higher degree.
Wave 4 correction finished at 16583.75 and the Index resumed to the downside. Expect NQ_F to continue to the downside in wave 5 to end complete wave (A) in higher degree. Wave 5 of (A) could drop to 16410 – 16357 area (1.236 – 1.618 inverse Fib retracement). After which, we should see a reaction higher in wave (B) before it resumes lower again. Near term, as far as pivot at 17165.94 high stays intact, the Index has scope to extend correction lower.
NQ_F 60 Minutes Elliott Wave Chart
NQ_F Elliott Wave Video
https://www.youtube.com/watch?v=V01gbBjiQIk