
Sample Category Title
USD/JPY Daily Outlook
Daily Pivots: (S1) 143.38; (P) 144.11; (R1) 145.37; More...
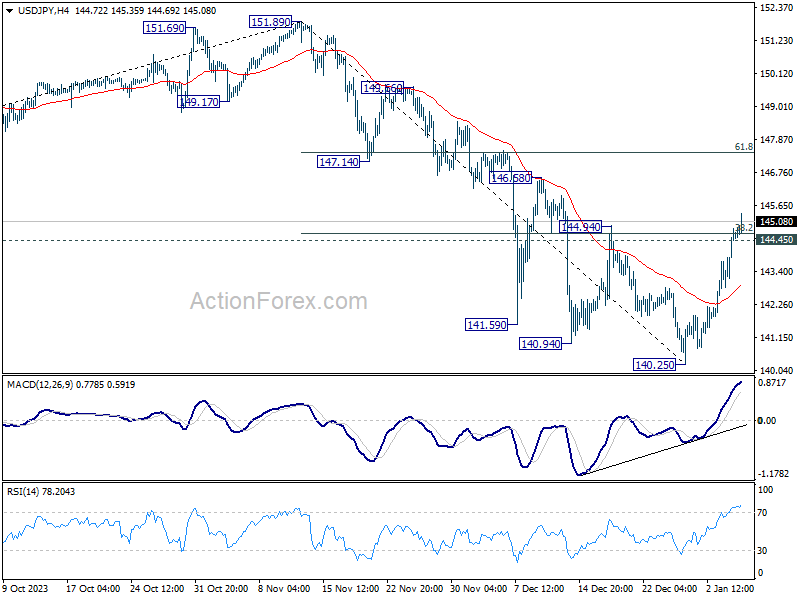
USD/JPY's break of 144.94 resistance argues that fall from 151.89 has completed. Intraday bias stays on the upside at this point. Rebound from 140.25 would target 61.8% retracement of 151.89 to 140.25 at 147.44, even as a corrective move. On the downside, below 144.45 minor support will turn intraday bias neutral first. But risk will now stay on the upside as long as 55 4H EMA (now at 142.96) holds.
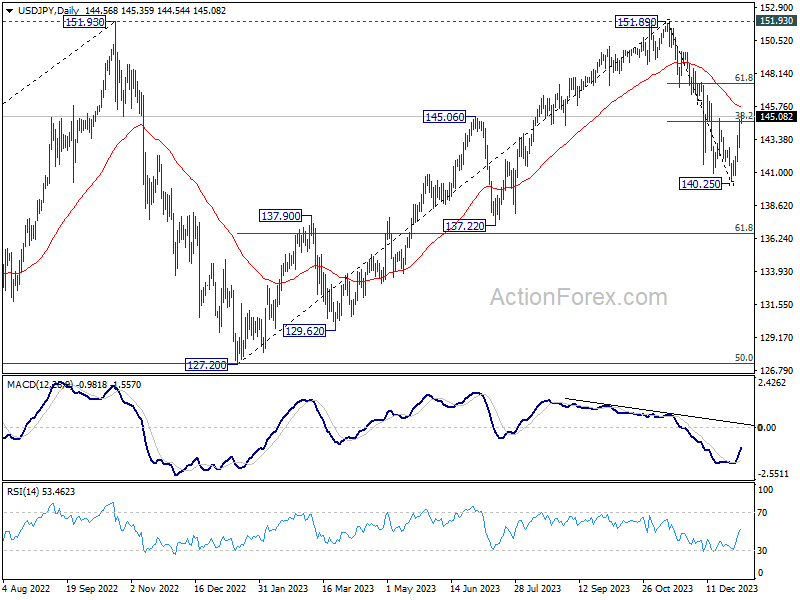
In the bigger picture, stronger than expected rebound from 140.25 is mixing up outlook. On the upside, sustained trading above 55 D EMA (now at 145.72) will argue that fall from 151.89 is merely a correction to the up trend from 127.20 (2022 low). This rally is still in progress for 151.93 and above at a later stage. Nevertheless, break of 140.25 will revive the case that corrective pattern from 151.93 has already started the third leg, back towards 127.20.
USD/CHF Daily Outlook
Daily Pivots: (S1) 0.8477; (P) 0.8503; (R1) 0.8528; More....
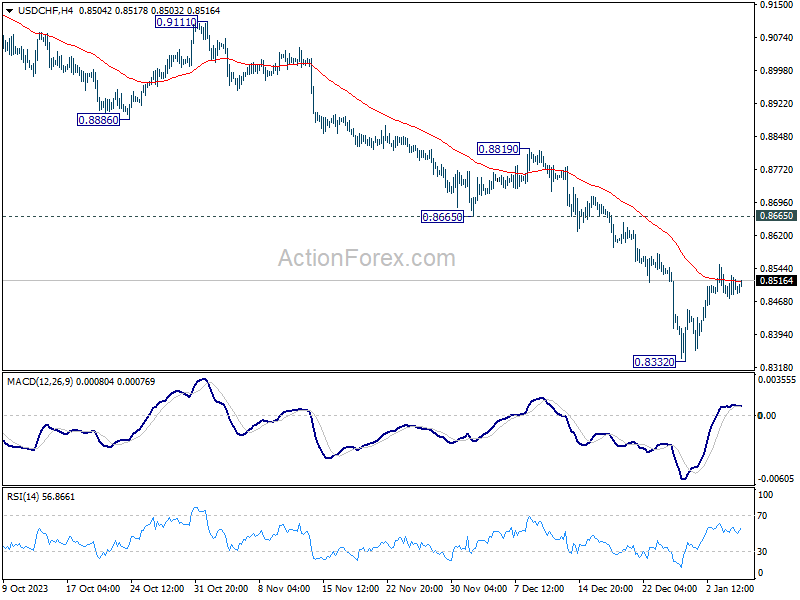
No change in USD/CHF's outlook as price actions from 0.8332 are still seen as a corrective pattern only. Intraday bias stays neutral and outlook remains bearish with 0.8665 support turned resistance intact. On the downside, break of 0.8332 will resume larger fall from 0.9243 to 0.8257 projection level.
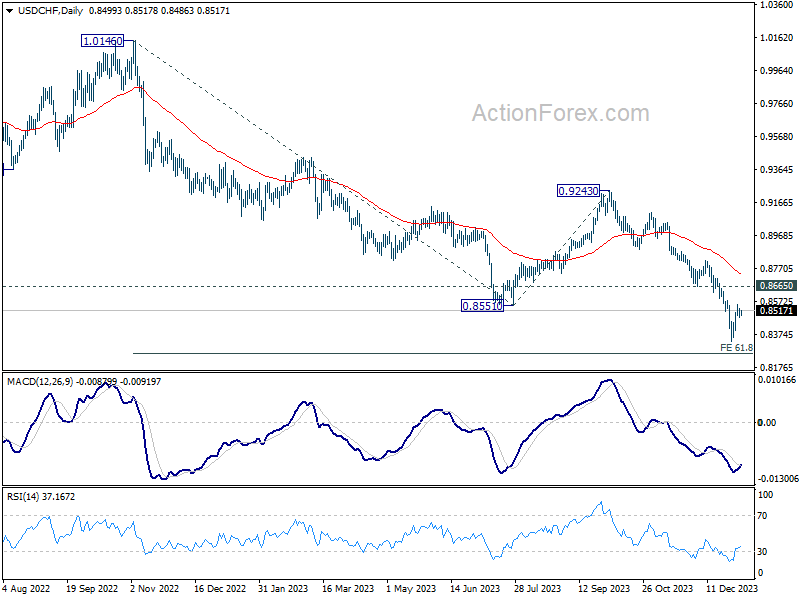
In the bigger picture, break of 0.8551 support indicates resumption of whole decline from 1.0146 (2022 high). Next target is 61.8% retracement of 1.0146 to 0.8551 from 0.9243 at 0.8257. Sustained break there could prompt downside acceleration to 100% projection at 0.7648. This will now remain the favored case as long as 0.8819 resistance holds.
GBP/USD Daily Outlook
Daily Pivots: (S1) 1.2650; (P) 1.2690; (R1) 1.2723; More...
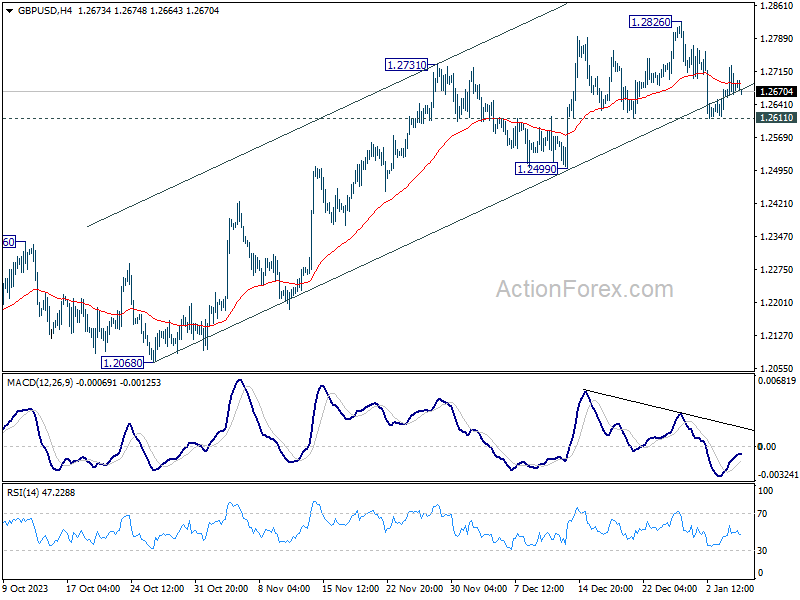
Intraday bias in GBP/USD remains neutral as range trading continues. On the upside, break of 1.2826 will resume whole rally from 1.2036. However, break of 1.2611 will indicate short term topping, and turn bias back to the downside for 1.2499 support.
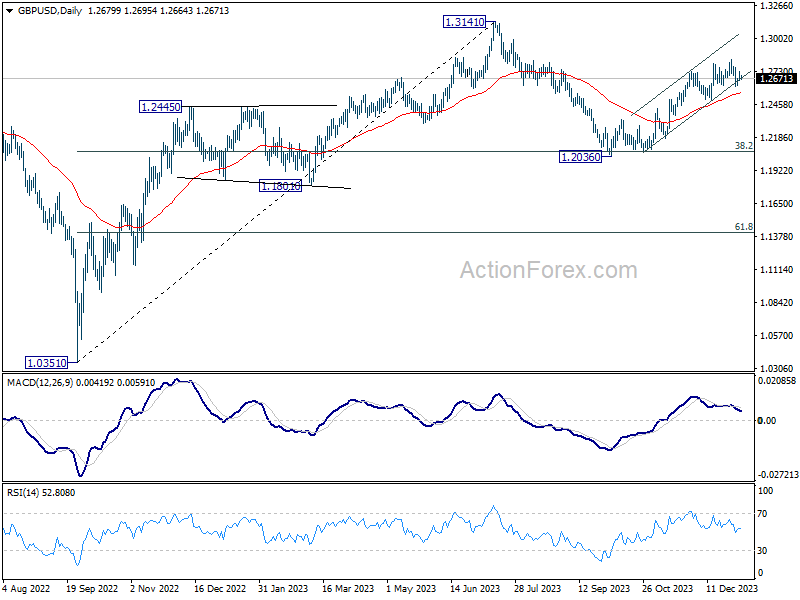
In the bigger picture, price actions from 1.3141 medium term top are seen as a corrective pattern to rise from 1.0351 (2022 low). Rise from 1.2036 is seen as the second leg that's in progress. Upside should be limited by 1.3141 to bring the third leg of the pattern. Meanwhile, break of 1.2499 support will argue that the third leg has already started for 38.2% retracement of 1.0351 (2022 low) to 1.3141 at 1.2075 again.
EUR/USD Daily Outlook
Daily Pivots: (S1) 1.0917; (P) 1.0944; (R1) 1.0974; More...
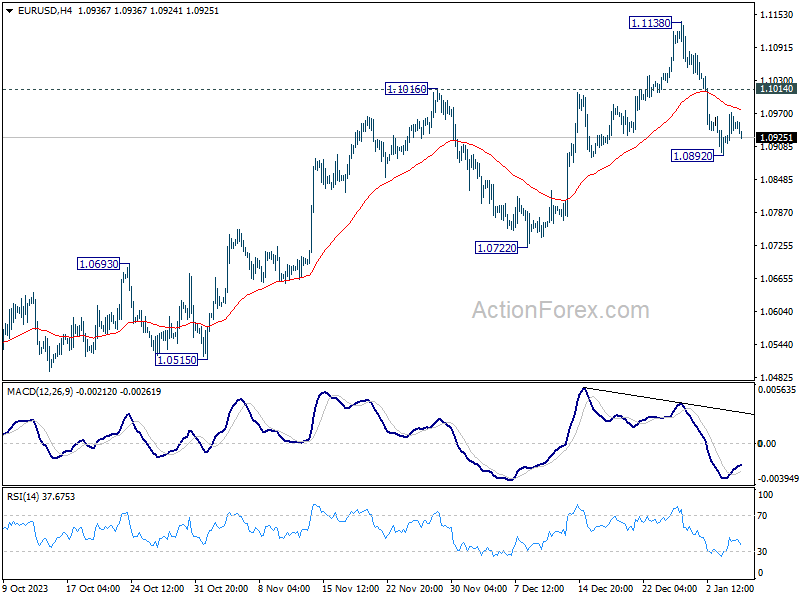
Intraday bias in EUR/USD remains neutral and further decline is mildly in favor with 1.1014 minor resistance holds. Below 1.0892 will resume the fall from 1.1138 short term top for 1.0772 support. Sustained break there will argue that whole rise from 1.0447 has completed, and break deeper fall back to this support. On the upside, however, break of 1.1014 minor resistance will turn bias back to the upside for retesting 1.1138 instead.
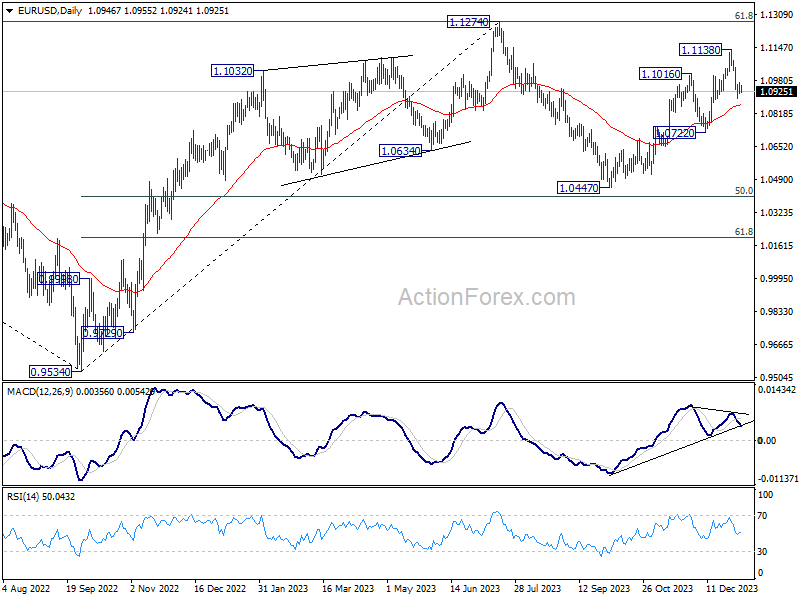
In the bigger picture, price actions from 1.1274 are viewed as a corrective pattern to rise from 0.9534 (2022 low). Rise from 1.0447 is seen as the second leg. While further rally could cannot be ruled out, upside should be limited by 1.1274 to bring the third leg of the pattern. Meanwhile, sustained break of 1.0722 support will argue that the third leg has already started for 1.0447 and below.
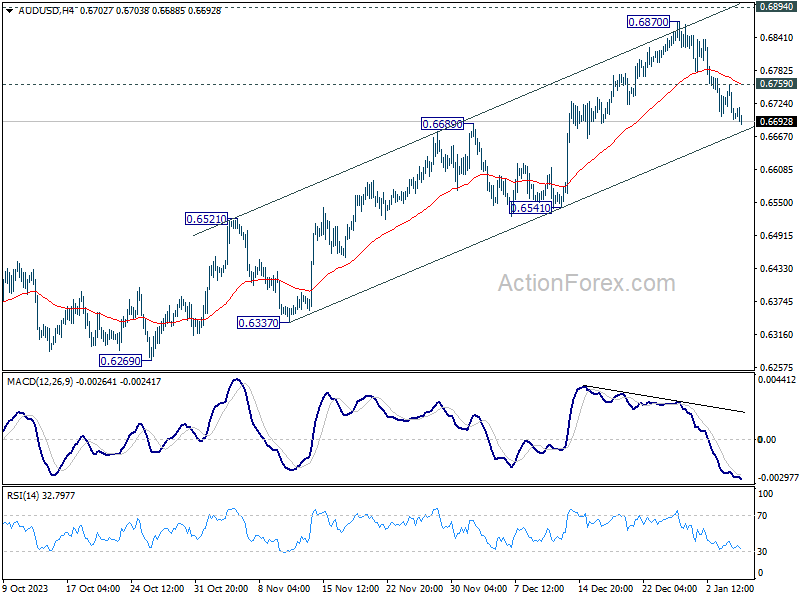
AUD/USD Daily Report
Daily Pivots: (S1) 0.6683; (P) 0.6721; (R1) 0.6746; More...
Intraday bias in AUD/USD remains mildly on the downside at this point. Pull back from 0.6870 short term top is in progress. But strong support would be seen from channel support (now at 0.6677) to bring rebound. On the upside, above 0.6759 minor resistance will turn bias back to the upside for retesting 0.6870. However, sustained break of 0.6689 will bring deeper decline to 55 D EMA (now at 0.6612).
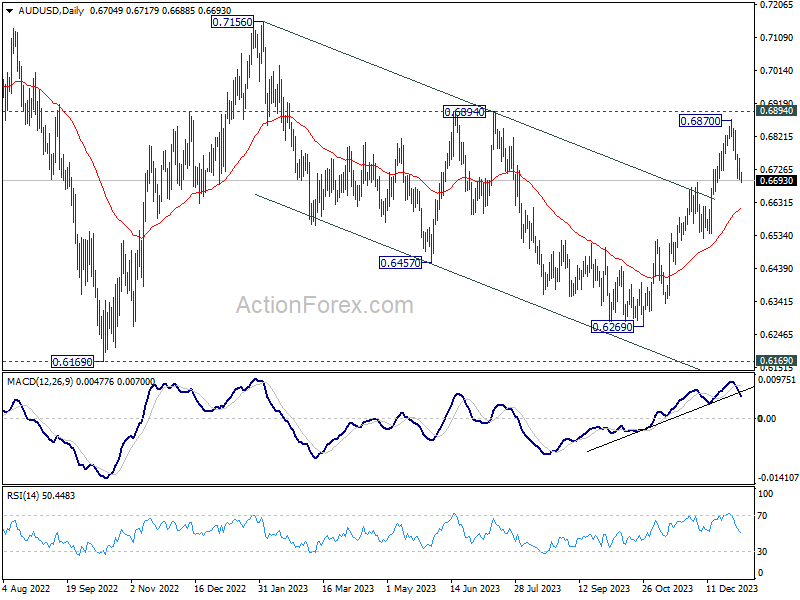
In the bigger picture, there is no confirmation that down trend from 0.8006 (2021 high) has completed. Price actions from 0.6169 (2022 low) could be just a medium term corrective pattern. Rise from 0.6269 is seen as the third leg of the pattern. For now, range trading should be seen between 0.6169 and 0.7156 (2023 high), until further developments.
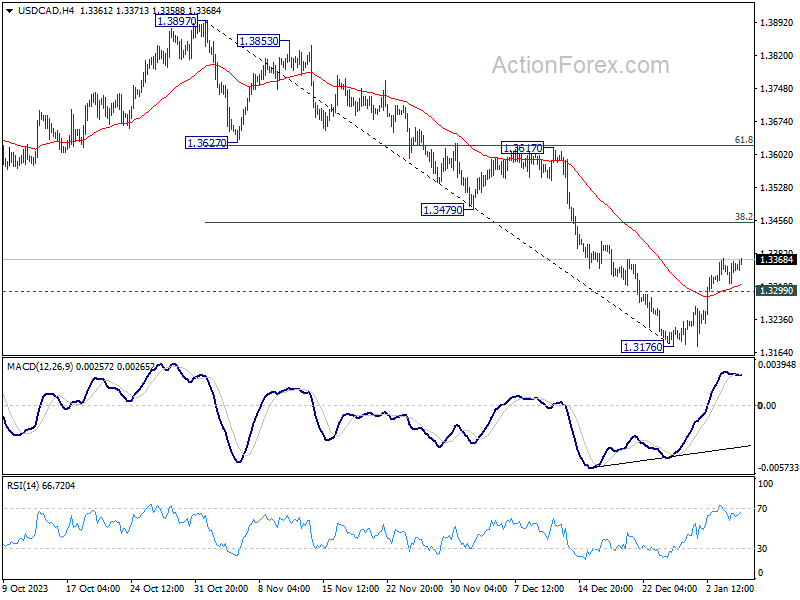
USD/CAD Daily Outlook
Daily Pivots: (S1) 1.3322; (P) 1.3344; (R1) 1.3371; More...
Intraday bias in USD/CAD remains on the upside at this point. Rebound from 1.3176 short term bottom is in progress for 38.2% retracement of 1.3897 to 1.3176 at 1.3451. Firm break there will pave the way to 61.8% retracement at 1.3622. On the downside, however, break of 1.3299 minor support will turn bias back to the downside for retesting 1.3176 low instead.
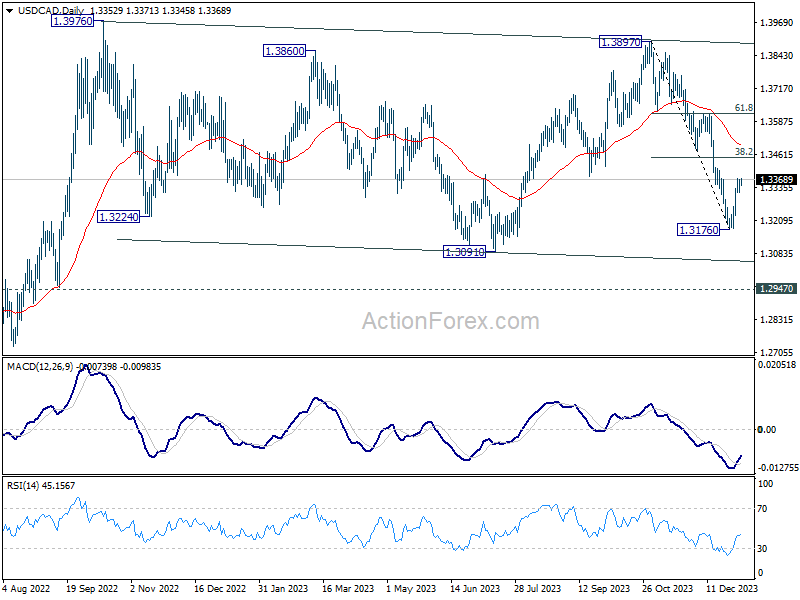
In the bigger picture, outlook is mixed up by deeper then expected fall from 1.3897. But after all, price actions from 1.3976 (2022 high) are viewed as a corrective pattern that's in progress. Larger up trend from 1.2005 (2021 low) is still expected to resume at a later stage as long as 1.2947 resistance turned support holds.
Dollar Rallies Ahead of NFP, Eurozone CPI Looms
Dollar is having a broad upswing today as investors and traders brace for the latest US non-farm payroll data. With the recent pullback in stock markets and noticeable recovery in treasury yields, the prevailing sentiment indicates that traders are increasingly skeptical about the likelihood of an early Fed rate cut. Consequently, any upside surprises in NFP data could further cement this view, bolstering the case for Fed to maintain high interest rates for longer duration. Such an outcome would likely benefit Dollar and yields but could exert downward pressure on stocks.
Prior to the NFP release, Eurozone's CPI flash report is another pivotal event that's closely being monitored by the markets. Euro appears vulnerable against its European peers. Should CPI data fall short of market expectations, it could trigger renewed wave of selling on Euro, at least against Sterling and Swiss Franc. Meanwhile, Canadian employment data also stands out as another key focus.
Technically, USD/JPY's break of 144.94 resistance argues that fall from 151.89 has completed. While rebound from 140.25 could still be a corrective move, further rally is now in favor to 61.8% retracement of 151.89 to 140.25 at 147.44. At the same time, EUR/JPY's break of 158.55 resistance suggests that whole rebound from 153.15 is resuming. Now, one focus is on whether GBP/JPY would follow by breaking through 184.15 resistance decisively too.

In Asia, Nikkei closed up 0.27%. Hong Kong HSI is down -0.61%. China Shanghai SSE is down -0.73%. Singapore Strait times is up 0.42%. Japan 10-year JGB yield is down -0.0125 at 0.614. Overnight, DOW rose 0.03%. S&P 500 fell -0.34%. NASDAQ fell -0.56%. 10-year yield rose 0.084 to 3.991.
Japan's PMI services finalized at 51.5, steeper increase in inflationary pressures
Japan's PMI Services was finalized at 51.5 in December, up slightly from November's 50.8, signaling a modest but positive growth in the sector. Composite PMI also improved, reaching the neutral mark at 50.0, up from 49.6 in the previous month.
Usamah Bhatti of S&P Global Market Intelligence attributed this growth to an increase in new orders and customer numbers. This uptick in business activity led firms to end the year with a more positive outlook. Service providers also expressed confidence about future activity, driven by expectations of economic recovery and plans for long-term business expansion.
However, Bhatti noted "steeper increase in inflationary pressures", mainly from escalated costs for raw materials, fuel, and labor. This resulted in the highest increase in service output charges since August.
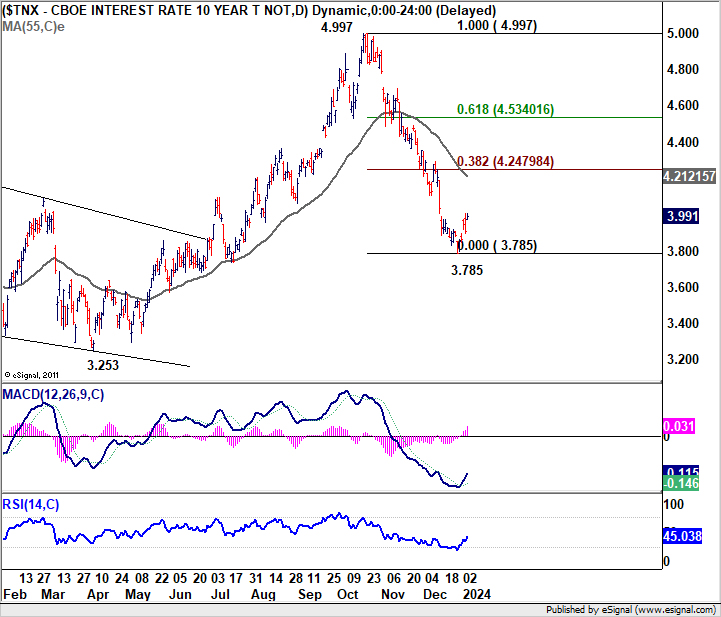
10-year yield could break above 4% on strong NFP
As financial markets await December US non-farm payroll data, remains the strongest major currency for the week. 10-year treasury yield continues its attempt to breach break 4% psychological level, as its near-term recovery is still intact. Concurrently, NASDAQ leads pullback in the stock markets, reflecting cautious investor sentiment.
The current market mood suggests recalibration of expectations regarding Fed's policy loosening path. Traders are increasingly skeptical about Fed starting rate cuts as early as March, with the likelihood now estimated around 65% according to Fed funds futures. A robust set of NFP numbers could further solidify this sentiment shift, potentially boosting Dollar and treasury yields while exerting pressure on stocks.
Markets expect NFP to show 168k job growth in December. Unemployment rate is expected to tick up from 3.7% to 3.8%. Average hourly earnings are expected to grow 0.3% mom.
Recent released job market data suggest the possibility of an upside surprise in the NFP report. ADP private employment report showed 164k new jobs in the same month, exceeding expectations and showing an increase from the previous month's 101k. ISM Manufacturing PMI's employment component also improved, rising to 48.1 from 45.8, though it remains in contraction territory. Furthermore, 4-week moving average of initial unemployment claims decreased to 208k, down from previous month's 221k.
Market response to NFP data could particularly impact 10-year treasury yield. Technically, a short-term bottom appears to be in place at 3.785 with the current recovery, and D MACD crossed above signal line. Firm break above 4% level could provide momentum for TNX to target the 55 D EMA, currently at 4.212. While a break through 38.2% retracement of 4.997 to 3.785 at 4.247 seems unlikely at present, even a moderate rebound in TNX should lend near-term support to Dollar, especially against Yen.
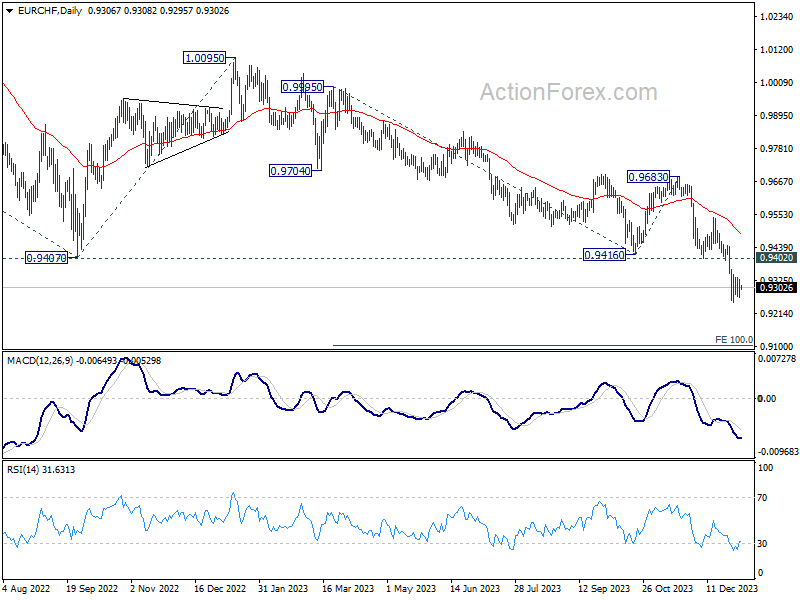
EUR/CHF on edge: Will Eurozone CPI trigger downside breakout?
Euro is currently trading weaker against its European peers and Dollar as market anticipates the release of Eurozone CPI flash data for December. Expectations are set for the headline CPI to increase from 2.4% yoy to 3.0% yoy, ending a six-month streak of consecutive declines. Meanwhile, core CPI is expected to slow down from 3.6% yoy to 3.4% yoy.
The jump in headline inflation shouldn't be a surprise to ECB officials. Executive Board member Isabel Schnabel had acknowledged last month that a temporary uptick in inflation was possible. But she also expected it to "gradually" fall to ECB's 2% target by 2025. The anticipated continued decline in core inflation could reinforce the ECB's confidence that the trend of disinflation is still ongoing.
Currently, swap markets are factoring in approximately 1.6 percentage points of rate cuts by ECB this year, with 60% probability of these cuts commencing as early as March. The critical consideration now is the pace of disinflation: whether it is rapid enough to justify earlier rate cuts, or slow enough to warrant maintaining the current restrictive policy stance for a longer duration.
Today's Eurozone CPI data could be pivotal for the Euro's performance. Any results that fall short of expectations might trigger another wave of selling pressure. Specifically, break of 0.9252 support will resume EUR/CHF's down trend from 1.0095, and target 100% projection of 0.9995 to 0.9416 from 0.9683 at 0.9104 next.
Looking ahead
Germany retail sales, UK PMI construction, Eurozone CPI and PPI will be released in European session. Later in the day, US will release non-farm payrolls, ISM services and factory orders. Canada will also publish employment data and Ivey PMI.
USD/CAD Daily Outlook
Daily Pivots: (S1) 1.3322; (P) 1.3344; (R1) 1.3371; More...
Intraday bias in USD/CAD remains on the upside at this point. Rebound from 1.3176 short term bottom is in progress for 38.2% retracement of 1.3897 to 1.3176 at 1.3451. Firm break there will pave the way to 61.8% retracement at 1.3622. On the downside, however, break of 1.3299 minor support will turn bias back to the downside for retesting 1.3176 low instead.
In the bigger picture, outlook is mixed up by deeper then expected fall from 1.3897. But after all, price actions from 1.3976 (2022 high) are viewed as a corrective pattern that's in progress. Larger up trend from 1.2005 (2021 low) is still expected to resume at a later stage as long as 1.2947 resistance turned support holds.
Economic Indicators Update
| GMT | Ccy | Events | Actual | Forecast | Previous | Revised |
|---|---|---|---|---|---|---|
| 23:50 | JPY | Monetary Base Y/Y Dec | 7.80% | 9.00% | 8.90% | |
| 05:00 | JPY | Consumer Confidence Index Dec | 37.2 | 36.6 | 36.1 | |
| 07:00 | EUR | Germany Retail Sales M/M Nov | -0.50% | 1.10% | ||
| 09:30 | GBP | Construction PMI Dec | 46.1 | 45.5 | ||
| 10:00 | EUR | Eurozone CPI Y/Y Dec P | 3.00% | 2.40% | ||
| 10:00 | EUR | Eurozone CPI Core Y/Y Dec P | 3.40% | 3.60% | ||
| 10:00 | EUR | Eurozone PPI M/M Nov | -0.10% | 0.20% | ||
| 10:00 | EUR | Eurozone PPI Y/Y Nov | -8.70% | -9.40% | ||
| 13:30 | USD | Nonfarm Payrolls Dec | 168K | 199K | ||
| 13:30 | USD | Unemployment Rate Dec | 3.80% | 3.70% | ||
| 13:30 | USD | Average Hourly Earnings M/M Dec | 0.30% | 0.40% | ||
| 13:30 | CAD | Net Change in Employment Dec | 13.2K | 24.9K | ||
| 13:30 | CAD | Unemployment Rate Dec | 5.90% | 5.80% | ||
| 15:00 | USD | ISM Services PMI Dec | 52.7 | 52.7 | ||
| 15:00 | USD | Factory Orders M/M Nov | 2.30% | -3.60% | ||
| 15:00 | CAD | Ivey PMI Dec | 55 | 54.7 |
AUD/JPY Technical Analysis Overview – FX Pairs to Watch
Talking Points
- Weekly Chart Technical Analysis
- Short Term formation before Non-Farm Payroll
Weekly Chart
Price was trading within an uptrend that began mid-year 2020 and may still be in place, however, the trend acceleration pace slowed once the FED began raising Interest Rates in early 2022, and price action continued sideways failing to make new highs since then. Price found resistance multiple times near the RED Resistance line identified on the above weekly chart near level 98.00
The overall context of price action reflects a narrowing formation with a trendline resistance level (Red line) above level 98.00, a break and a close above the resistance line may open the way for price action, however if price action fails to break above the resistance, price action may resume within the narrowing formation.
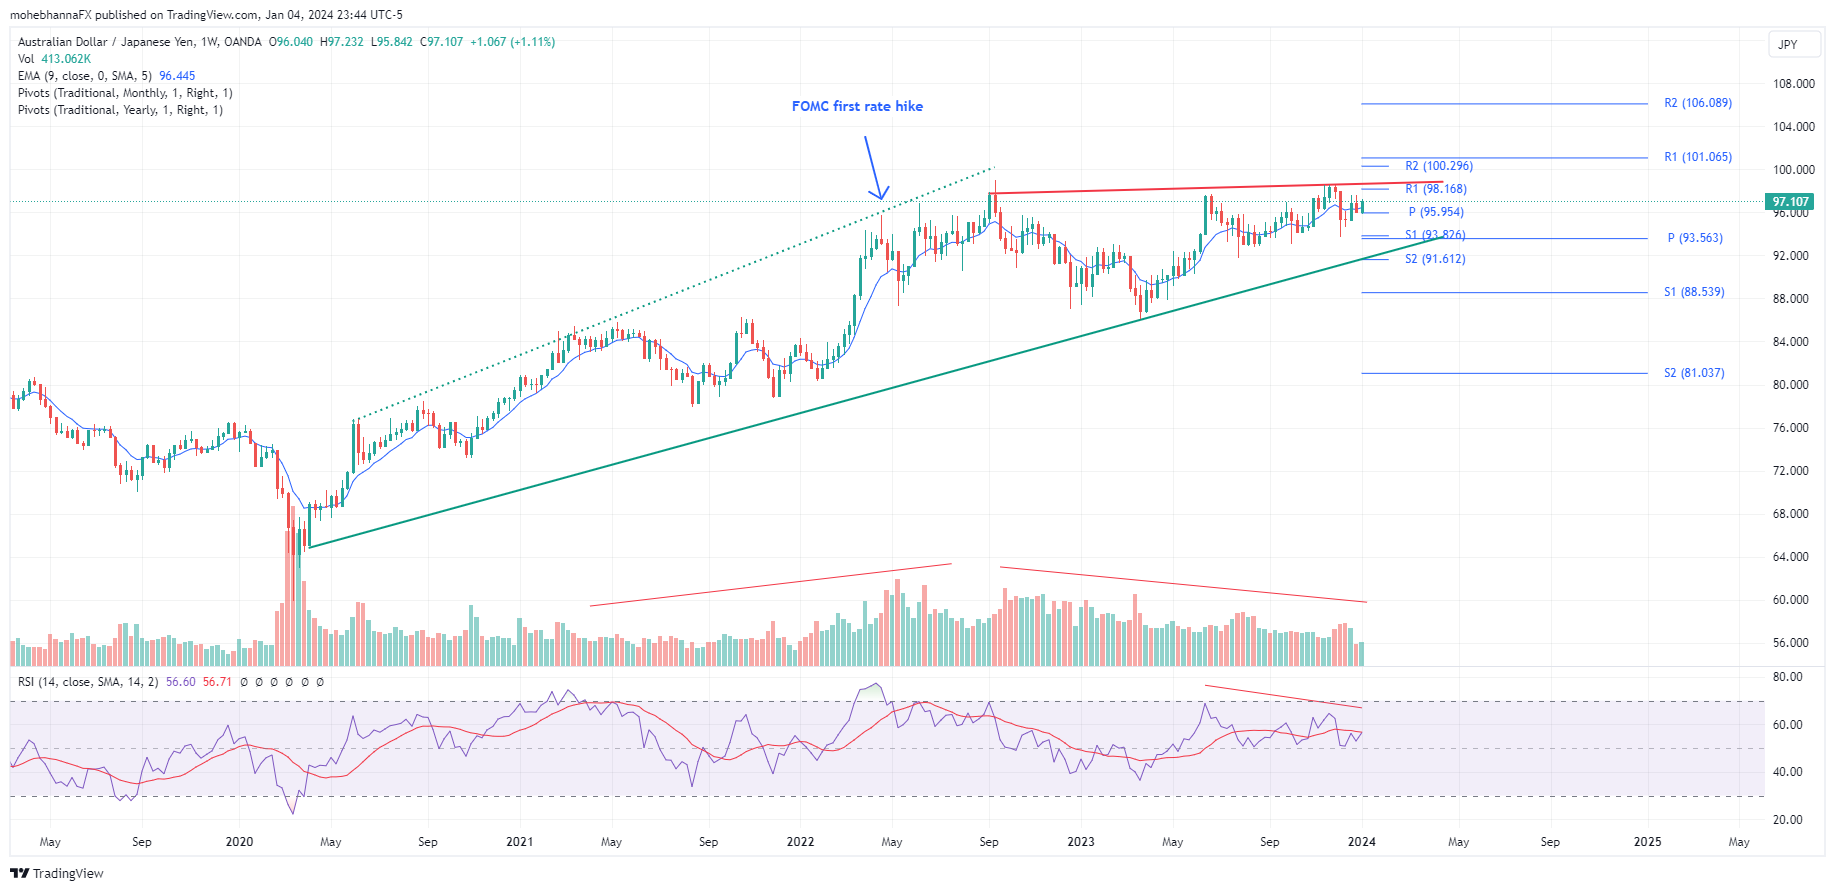
Price continues to trade above its EMA9 and its monthly pivot of 95.95, a confluence of support represented by the annual pivot point and monthly S1 calculation near level 93.80.
A negative divergence between price action and tick volume was identified on the chart, and another negative divergence is also in place between price action and RSI, with price action making higher highs while indicators are making lower highs
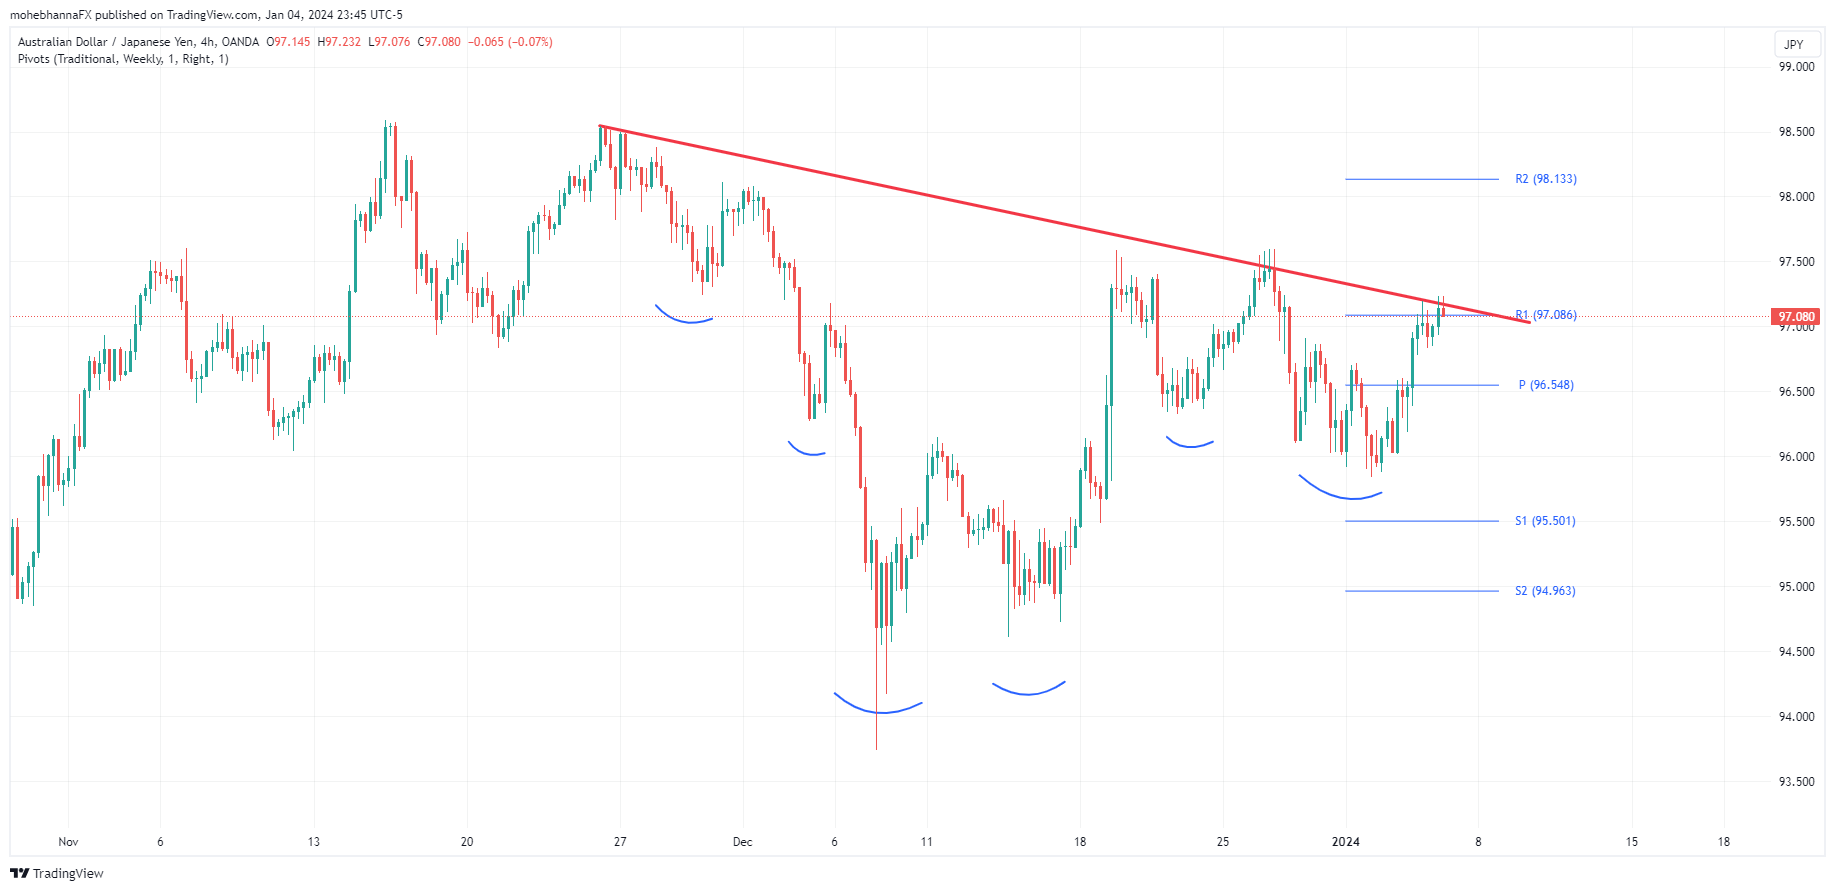
4 – Hour Chart
An inverted complex Head and Shoulder formation can be seen in shorter time frames (4 hours) as traders continue speculating on FOMC interest rate cuts, theoretically, lower rates on USD should reflect positively on AUDJPY, however, how much of it is already discounted in price is the question.
Price action at the neckline can be monitored closely as we approach Non-Farm Payroll release time, a false breakout and a pattern failure are also a possibility, especially with the negative divergences seen on the weekly chart and its trendline resistance level. (Red line)
Technical Outlook and Review
DXY:
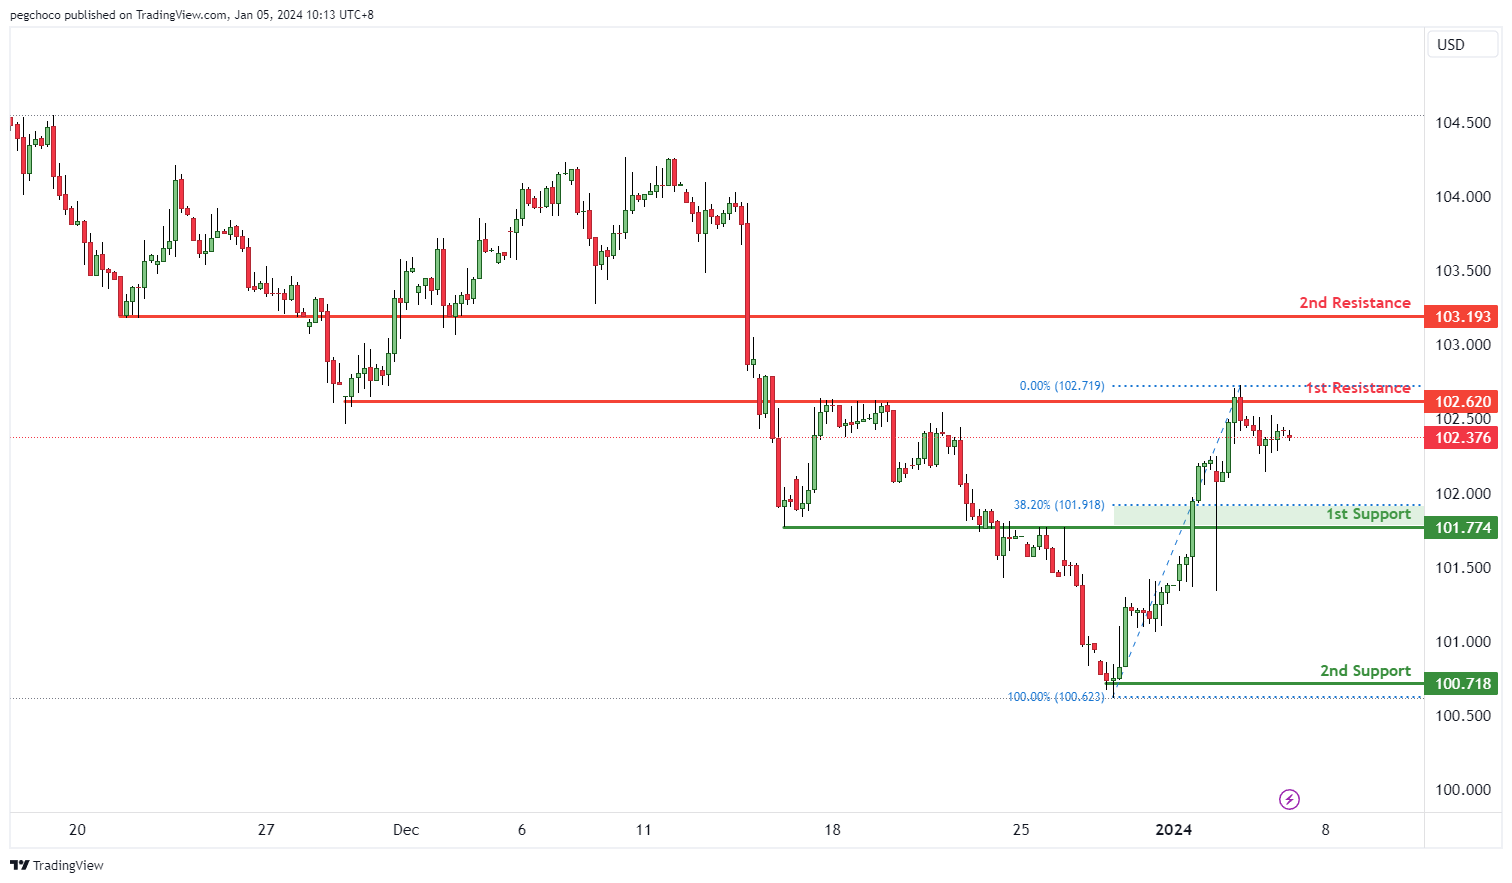
The DXY (US Dollar Index) chart currently has a bearish overall momentum, indicating weakness in the US Dollar.
Price could potentially continue its bearish movement towards the 1st support level.
The 1st support at 101.77 is categorized as a pullback support and is associated with the 38.20% Fibonacci Retracement level. This level may act as a significant area where buying interest could emerge, providing temporary support for the DXY.
The 2nd support at 100.71 is identified as a swing low support, further reinforcing its significance as a potential support zone.
On the resistance side, the 1st resistance at 102.62 is categorized as an overlap resistance. This level may act as a substantial barrier where selling interest could intensify, potentially hindering the bullish movement in the short term.
The 2nd resistance at 103.16 is noted as a pullback resistance. This level could play a role in reversing or slowing down any upward movement of the DXY.
EUR/USD:
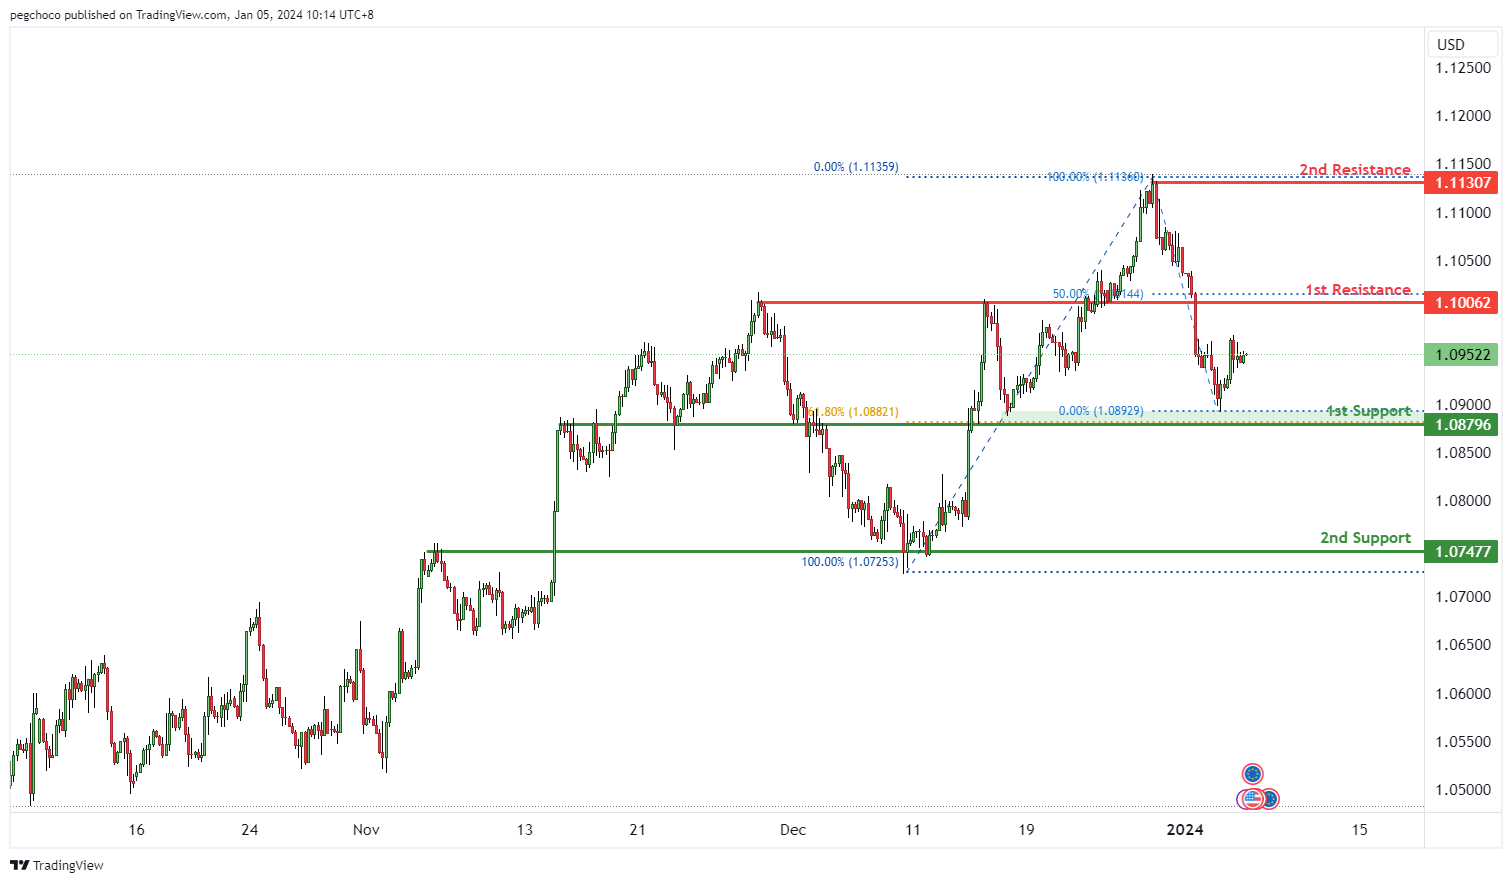
The EUR/USD chart currently exhibits a bullish overall momentum, suggesting strength in the Euro against the US Dollar.
Price could potentially continue its bullish movement towards the 1st resistance level.
The 1st support at 1.0879 is categorized as an overlap support and is associated with the 61.80% Fibonacci Retracement level. This level may act as a significant area where buying interest could emerge, providing temporary support for the EUR/USD.
The 2nd support at 1.0747 is identified as an overlap support, further reinforcing its significance as a potential support zone.
On the resistance side, the 1st resistance at 1.1006 is categorized as a pullback resistance. This level may act as a substantial barrier where selling interest could intensify, potentially slowing down the bullish movement in the short term.
The 2nd resistance at 1.1130 is noted as a swing high resistance. Swing highs often mark points of reversal or resistance in price movement and could pose a significant obstacle to further upward movement in the EUR/USD.
EUR/JPY:
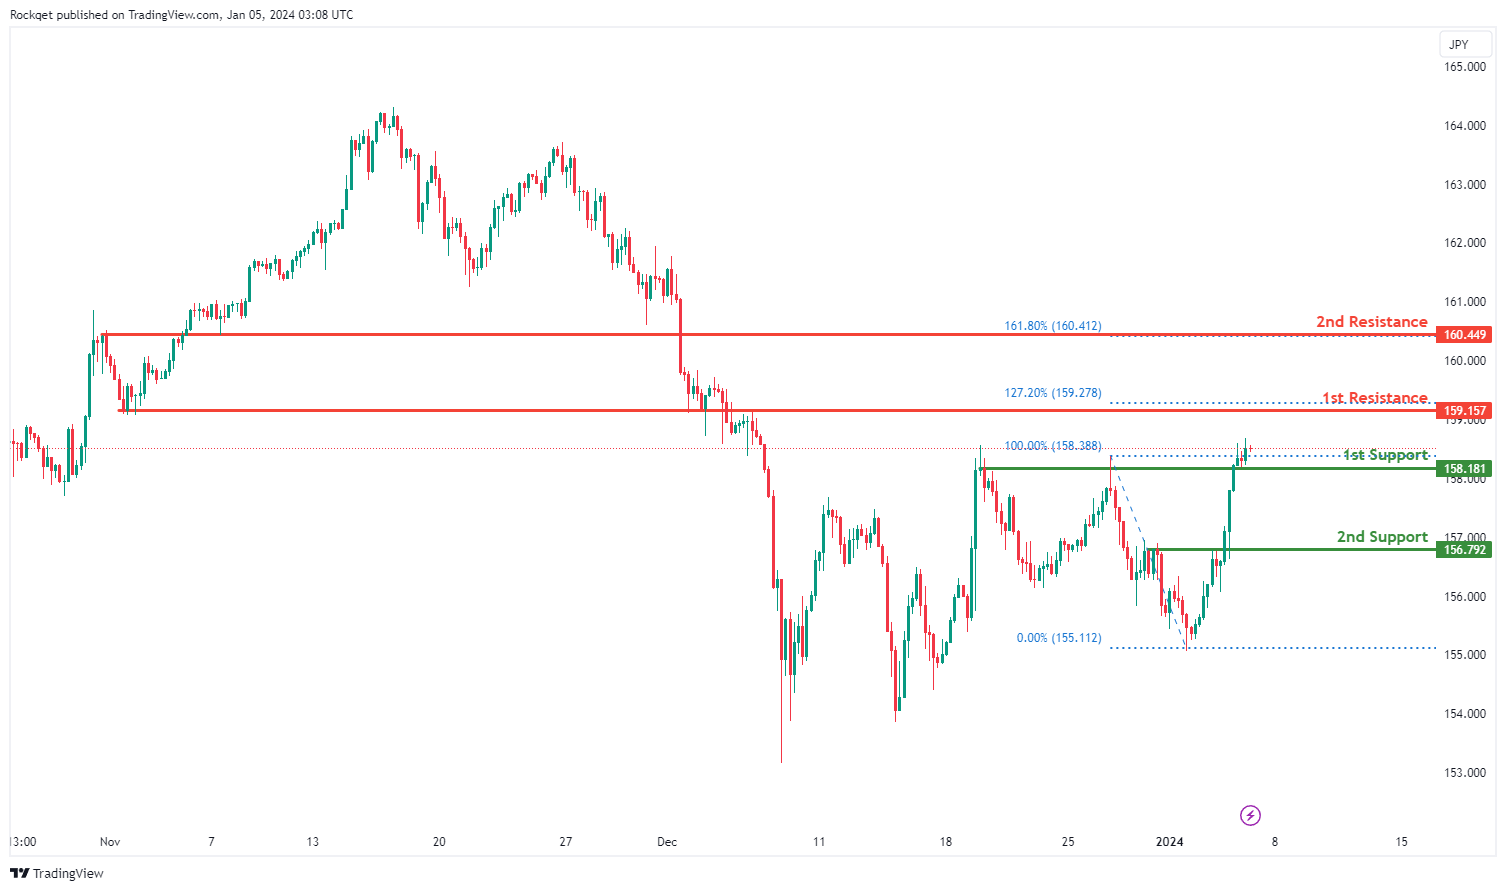
The EUR/JPY chart currently displays a bullish overall momentum, suggesting an inclination towards an upward trend. There is a potential scenario for a bullish continuation towards the 1st resistance.
The 1st support at 158.18 is identified as an overlap support, indicating historical significance as a level where buying interest has previously emerged.
The 2nd support at 156.79 is recognized as a pullback support, providing an additional layer of potential buying interest.
On the resistance side, the 1st resistance at 159.16 is marked as an overlap resistance and aligns with the 127.20% Fibonacci Extension, making it a notable level where selling interest could materialise.
The 2nd resistance at 160.45 is identified as an overlap resistance and coincides with the 161.80% Fibonacci Extension, adding significance to this potential resistance level.
EUR/GBP:
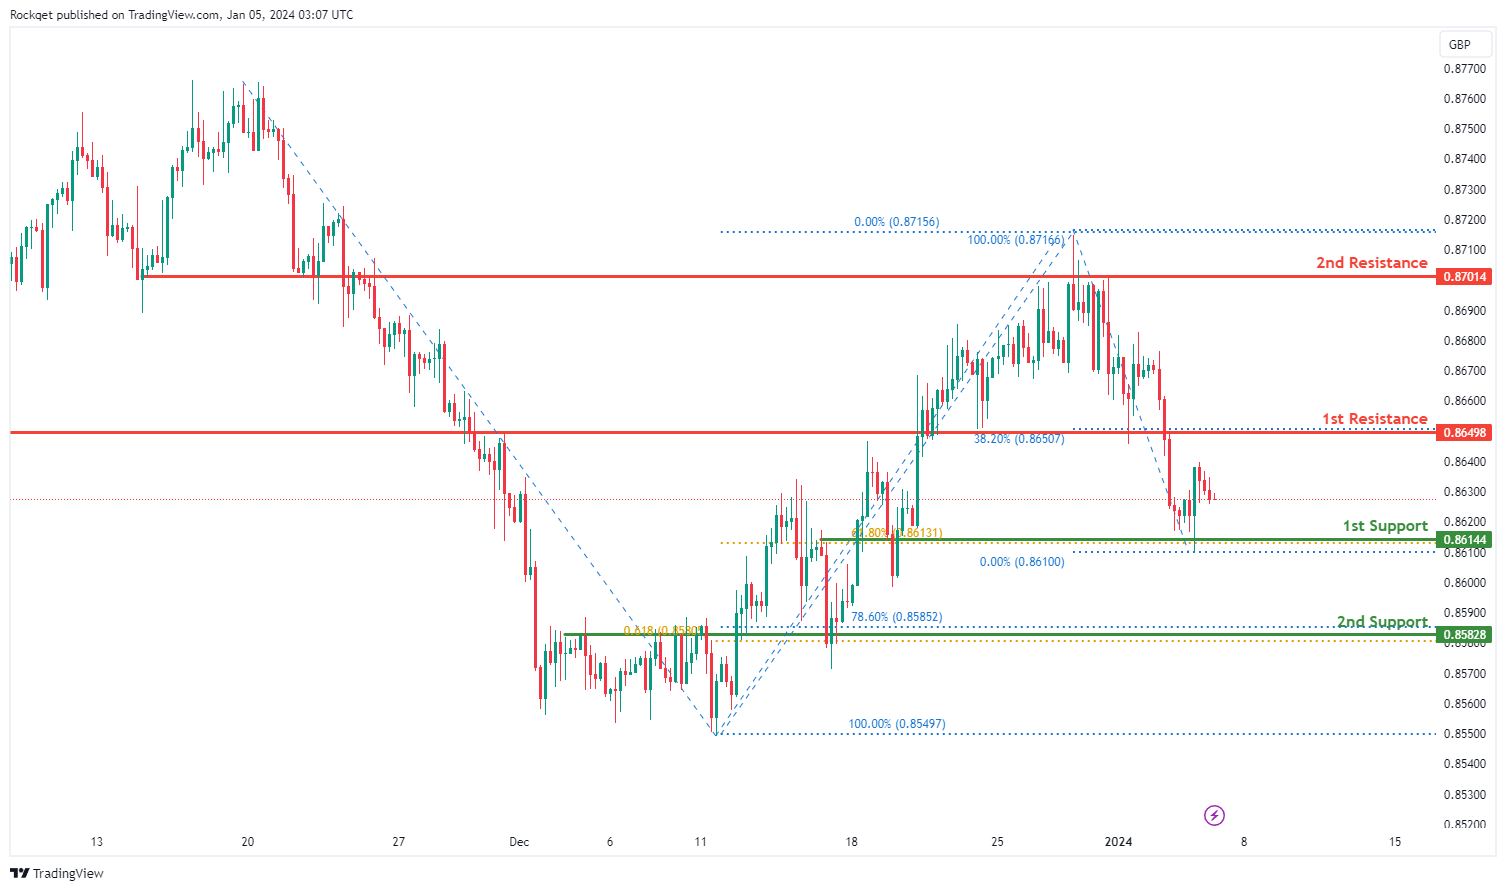
The EUR/GBP chart currently exhibits a bearish overall momentum, indicating a tendency toward a downward trend. There is a potential scenario for a bearish continuation towards the 1st support.
The 1st support at 0.8614 is identified as an overlap support, suggesting historical significance as a level where buying interest has previously emerged. The 61.80% Fibonacci Retracement further reinforces the potential significance of this support level.
The 2nd support at 0.8583 is recognized as an overlap support and coincides with the 78.60% Fibonacci Retracement, adding confluence to its potential as a support level, along with the 61.80% Fibonacci Projection.
On the resistance side, the 1st resistance at 0.8650 is noted as an overlap resistance and aligns with the 38.20% Fibonacci Retracement, making it a notable level where selling interest could materialise.
The 2nd resistance at 0.8701 is identified as an overlap resistance, providing an additional level where selling pressure might be encountered.
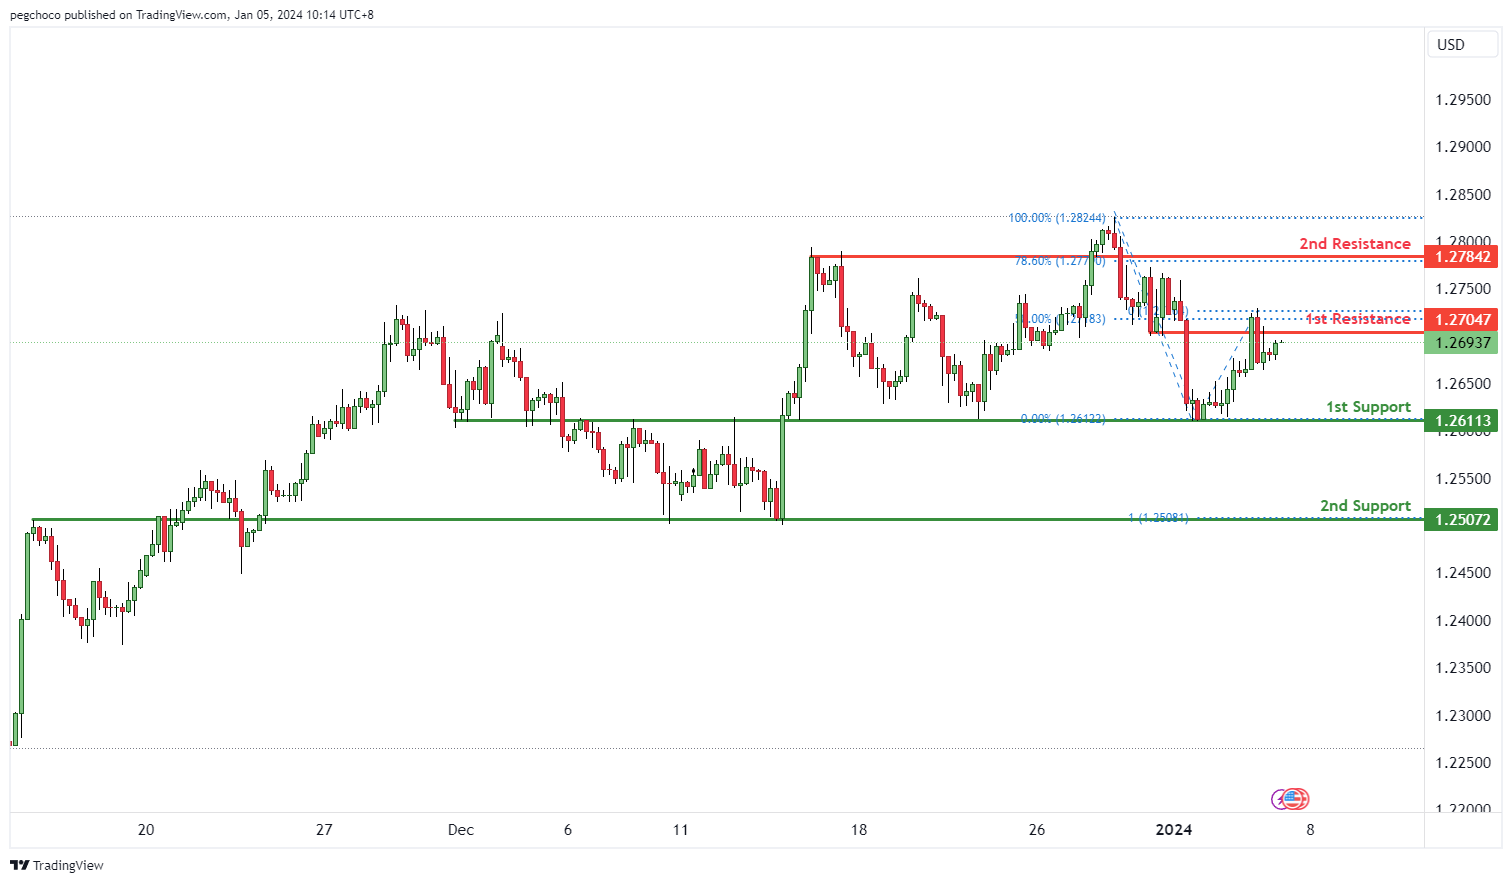
GBP/USD:
The GBP/USD chart currently has a bearish overall momentum, suggesting that the British Pound is weaker compared to the US Dollar.
Price could potentially make a bearish reaction off the 1st resistance level and drop towards the 1st support.
The 1st support at 1.2611 is categorized as an overlap support, indicating a significant area where buying interest may emerge, providing temporary support for the GBP/USD.
The 2nd support at 1.2507 is identified as an overlap support, further reinforcing its significance as a potential support zone. This level is also associated with the 100% Fibonacci Projection, adding to its importance.
On the resistance side, the 1st resistance at 1.2704 is categorized as an overlap resistance, and it is also associated with the 38.20% Fibonacci Retracement. This level may act as a substantial barrier where selling interest could intensify, potentially leading to a bearish reaction.
The 2nd resistance at 1.2814 is noted as a swing high resistance and is associated with the 78.60% Fibonacci Retracement. Swing highs often mark points of reversal or resistance in price movement, making this level a significant obstacle to further upward movement in the GBP/USD.
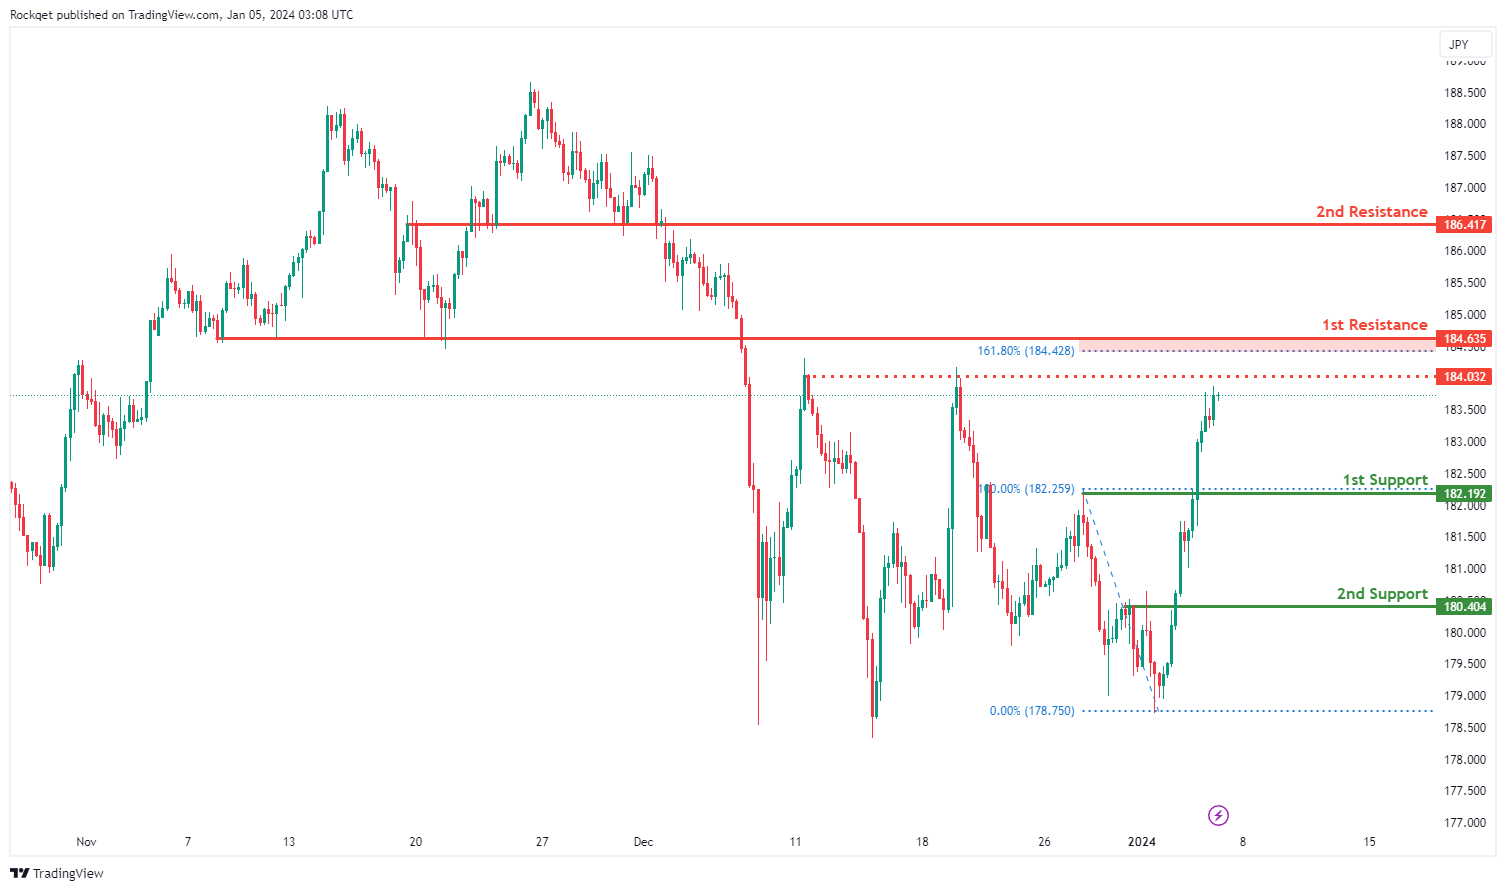
GBP/JPY:
The GBP/JPY chart currently demonstrates a bullish overall momentum, indicating a propensity for an upward trend. There is a potential scenario for a bullish continuation towards the 1st resistance.
The 1st support at 182.19 is considered favourable as it represents a pullback support level, suggesting historical significance as a point where buying interest has previously emerged.
The 2nd support at 180.40 is also identified as a pullback support, adding to the confluence of potential support levels.
On the resistance side, the 1st resistance at 184.64 is recognized as a pullback resistance and aligns with the 161.80% Fibonacci Extension, making it a notable level where selling interest could materialise.
The 2nd resistance at 186.42 is identified as an overlap resistance, providing an additional level where selling pressure might be encountered. The intermediate resistance at 184.03 is noted as a multi-swing high resistance, further emphasising its potential significance.
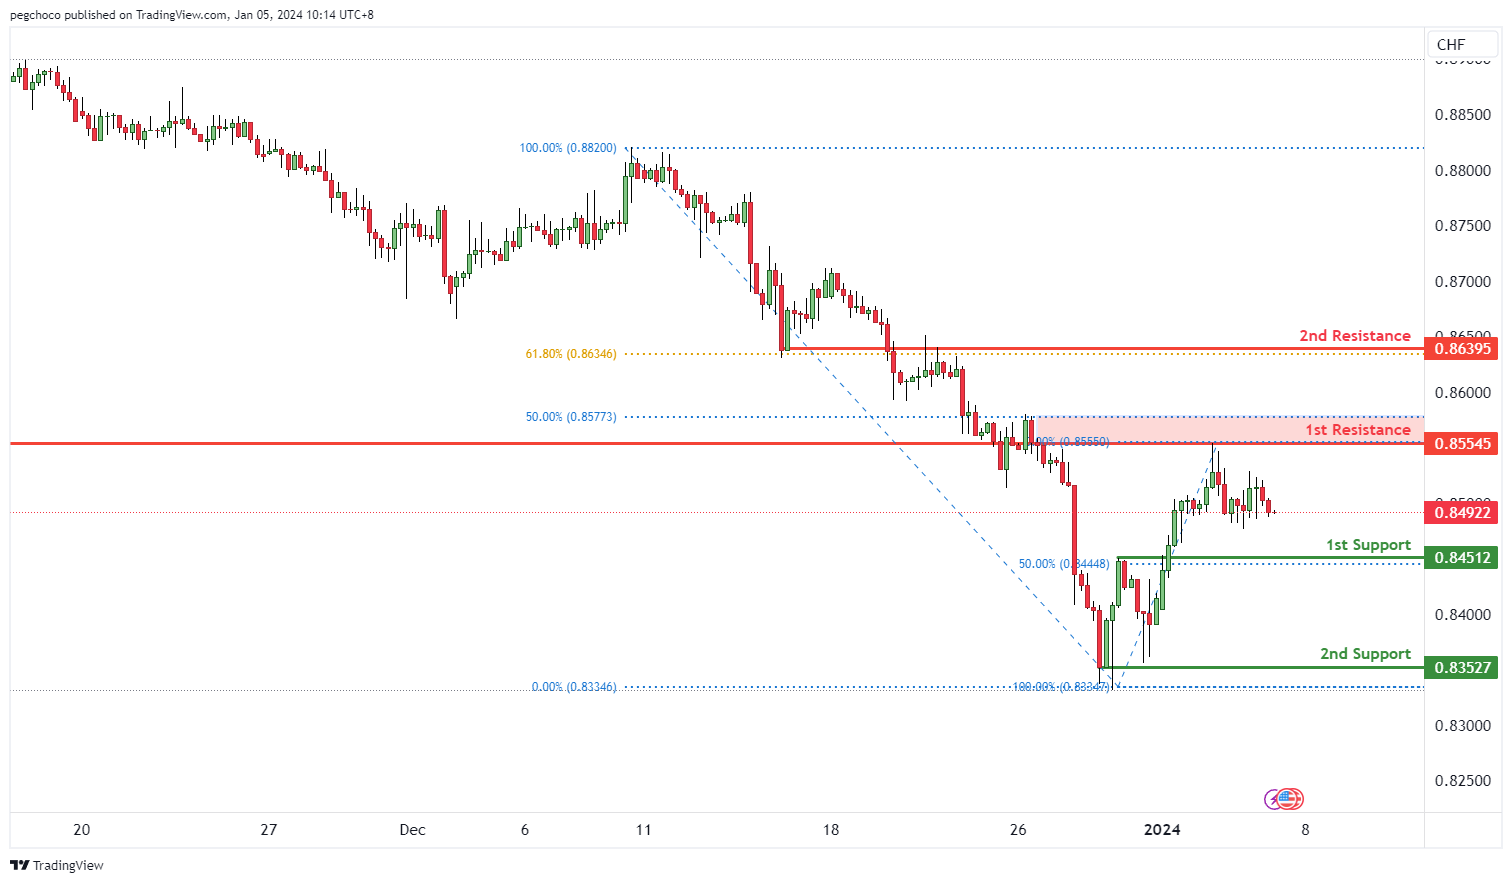
USD/CHF:
The USD/CHF chart currently has a bearish overall momentum, indicating that the US Dollar is weaker compared to the Swiss Franc.
Price could potentially continue its bearish movement towards the 1st support level.
The 1st support at 0.8451 is categorized as a pullback support, which suggests that it may serve as a significant area where buying interest could emerge, temporarily halting the bearish momentum of USD/CHF.
The 2nd support at 0.8352 is identified as a multi-swing low support, further reinforcing its importance as a potential support zone for the currency pair.
On the resistance side, the 1st resistance at 0.8554 is categorized as an overlap resistance and is also associated with the 50% Fibonacci Retracement level. This level may act as a substantial barrier where selling interest could intensify, potentially leading to a bearish continuation.
The 2nd resistance at 0.8639 is noted as an overlap resistance and is associated with the 61.80% Fibonacci Retracement. This level could also serve as a strong resistance point, further hindering any bullish attempts in USD/CHF.
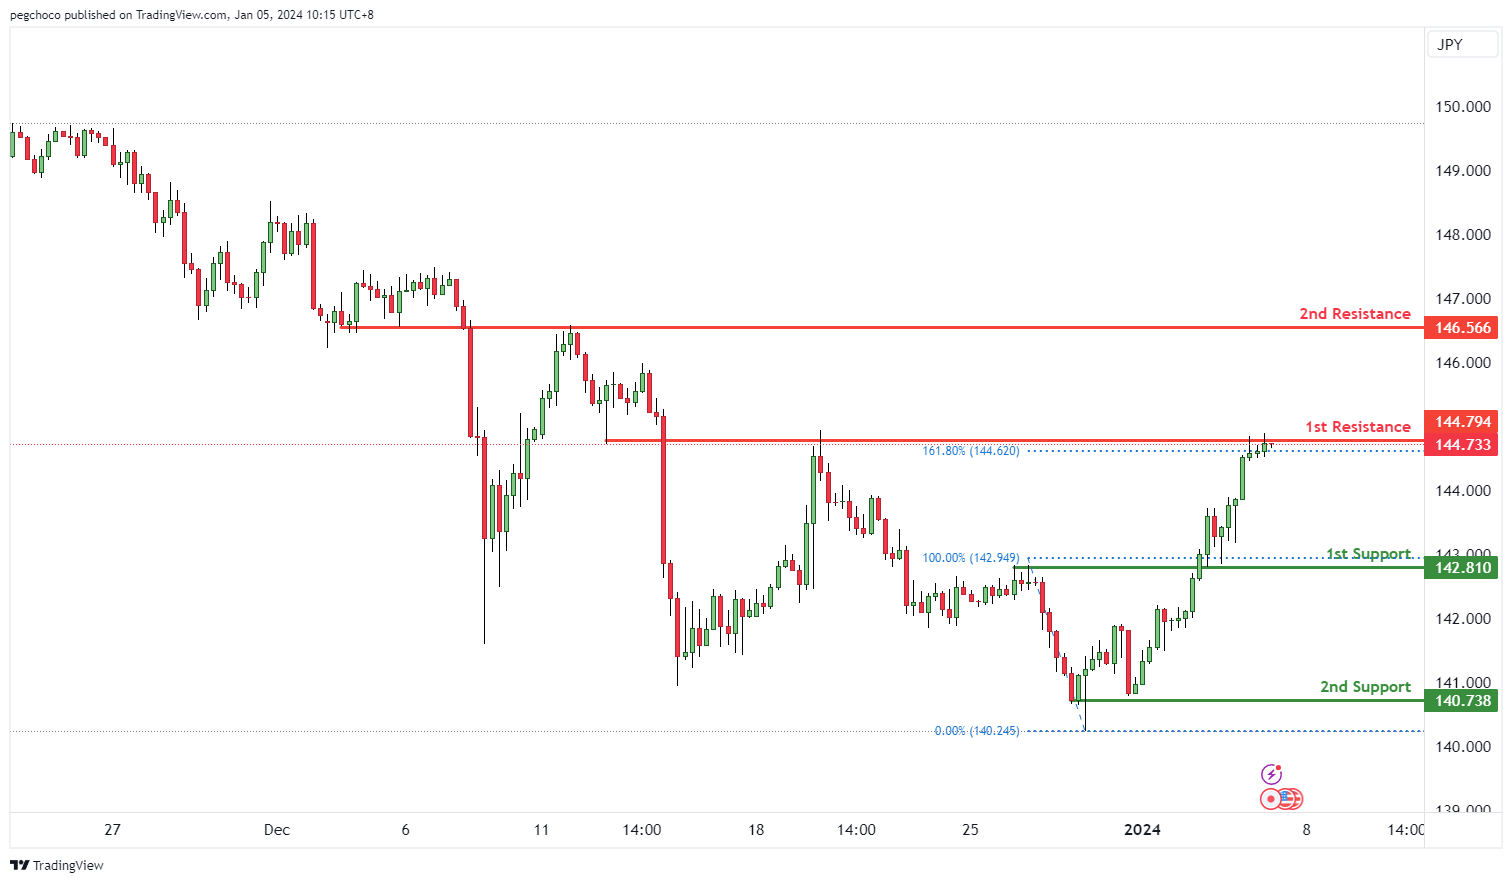
USD/JPY:
The USD/JPY chart currently exhibits a bearish overall momentum, indicating that the US Dollar is weaker compared to the Japanese Yen. In the short term, there’s potential for a bearish reaction off the 1st resistance level, followed by a drop towards the 1st support.
The 1st support at 142.81 is categorized as an overlap support. This level is significant as it suggests a potential area where buying interest may emerge, providing temporary support for USD/JPY.
The 2nd support at 140.73 is identified as a swing low support, further reinforcing its significance as a potential support zone for the currency pair.
On the resistance side, the 1st resistance at 144.79 is categorized as an overlap resistance and is also associated with the 161.80% Fibonacci Extension level. This level may act as a substantial barrier where selling interest could intensify, potentially leading to a bearish reversal.
The 2nd resistance at 146.56 is noted as an overlap resistance, further indicating a strong potential for resistance in this area.
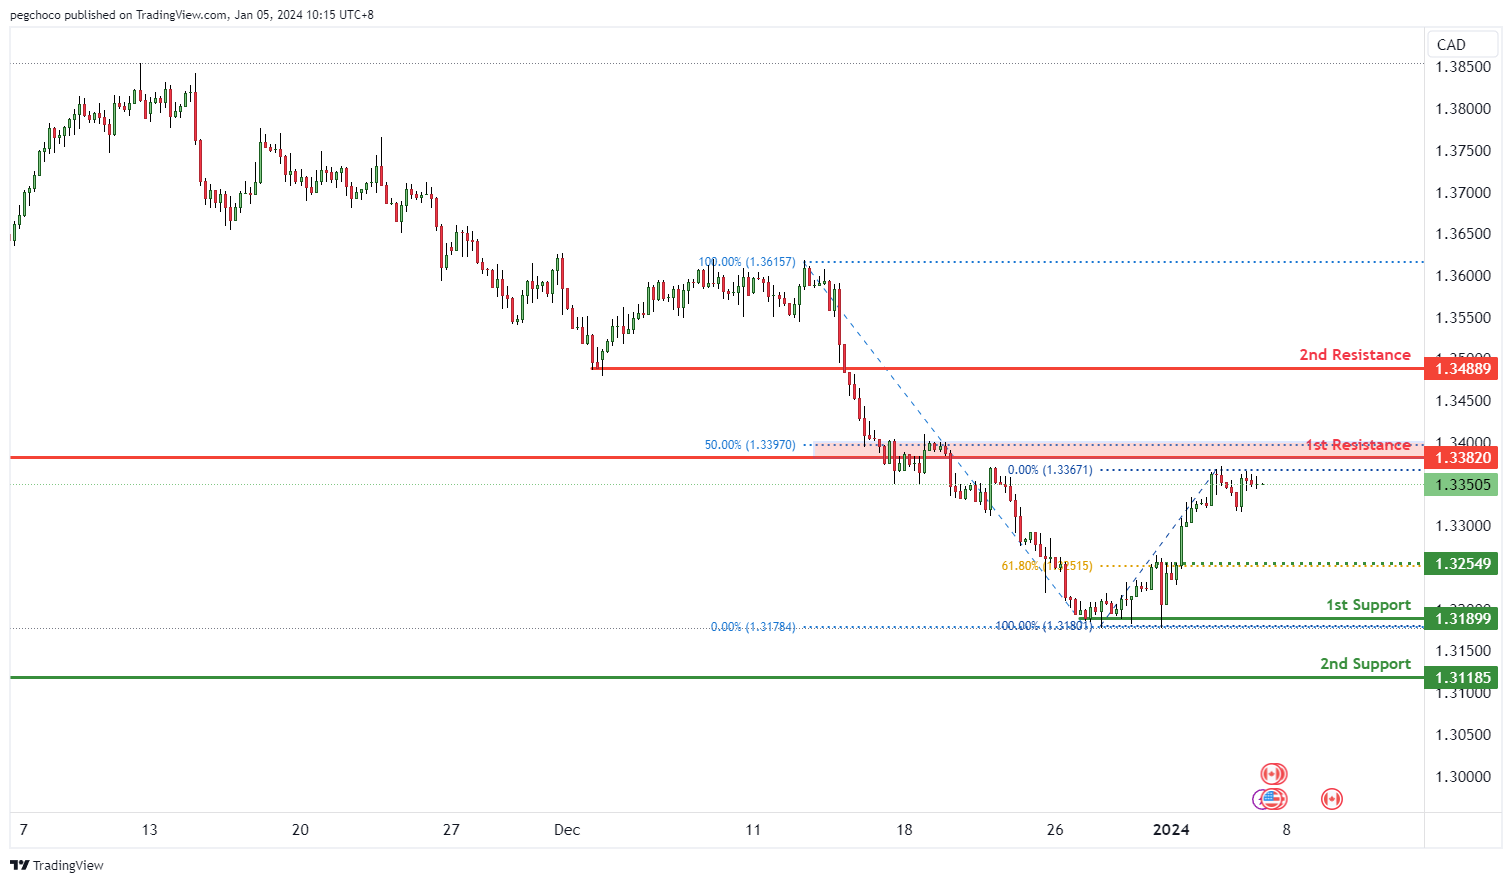
USD/CAD:
The USD/CAD chart currently has a bearish overall momentum, indicating potential weakness in the US Dollar compared to the Canadian Dollar. In the short term, there’s the possibility of a bearish continuation towards the 1st support level.
The 1st support at 1.3189 is identified as a multi-swing low support. This level holds significance as it suggests a potential area where buying interest may emerge, providing support for the USD/CAD pair.
The 2nd support at 1.3118 is categorized as a swing low support. Swing lows often represent areas where buyers have previously entered the market, adding to the significance of this level as a potential support zone.
On the resistance side, the 1st resistance at 1.3382 is categorized as an overlap resistance. This level may act as a substantial barrier where selling interest could intensify, potentially causing a bearish reversal or a temporary halt in the downtrend.
The 2nd resistance at 1.3488 is noted as a pullback resistance. This level signifies a point where sellers may re-enter the market after a pullback, further reinforcing its significance as a potential resistance zone.
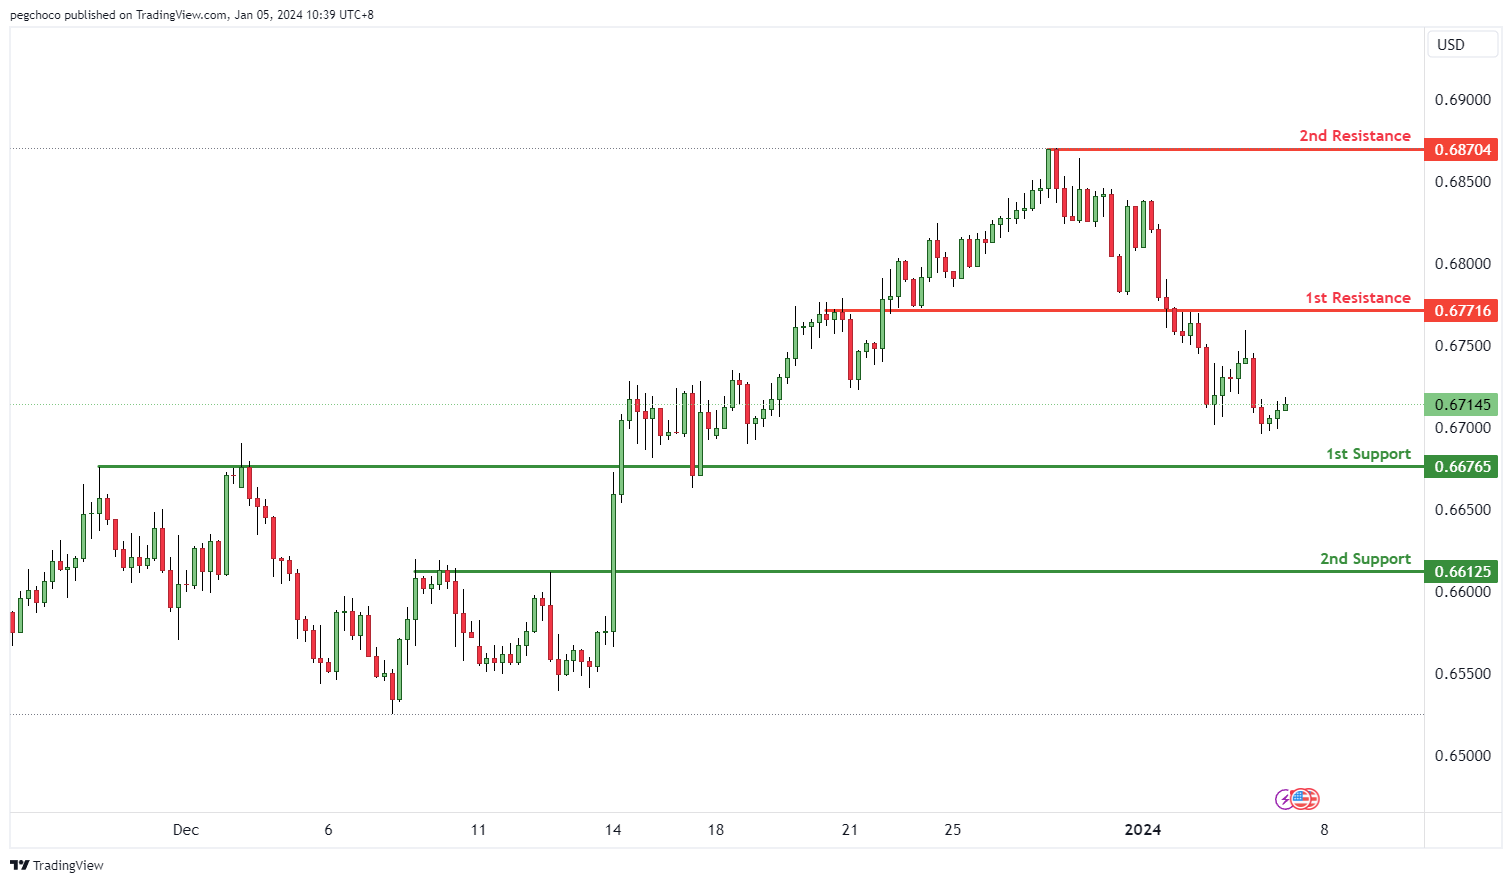
AUD/USD:
The AUD/USD chart currently exhibits a bullish overall momentum, suggesting potential strength in the Australian Dollar against the US Dollar. In the short term, there’s the potential for a bullish bounce off the 1st support level, followed by a move towards the 1st resistance.
The 1st support at 0.6676 is identified as an overlap support. This level holds significance as it suggests a potential area where buying interest may emerge, providing support for the AUD/USD pair.
The 2nd support at 0.6612 is categorized as a pullback support. It signifies a level where buyers may re-enter the market after a pullback, further reinforcing its significance as a potential support zone.
On the resistance side, the 1st resistance at 0.6771 is categorized as an overlap resistance. This level may act as a significant barrier where selling interest could intensify, potentially causing a temporary halt or reversal in the bullish movement.
The 2nd resistance at 0.6870 is noted as a swing high resistance. Swing highs often mark points of reversal or resistance in price movement.
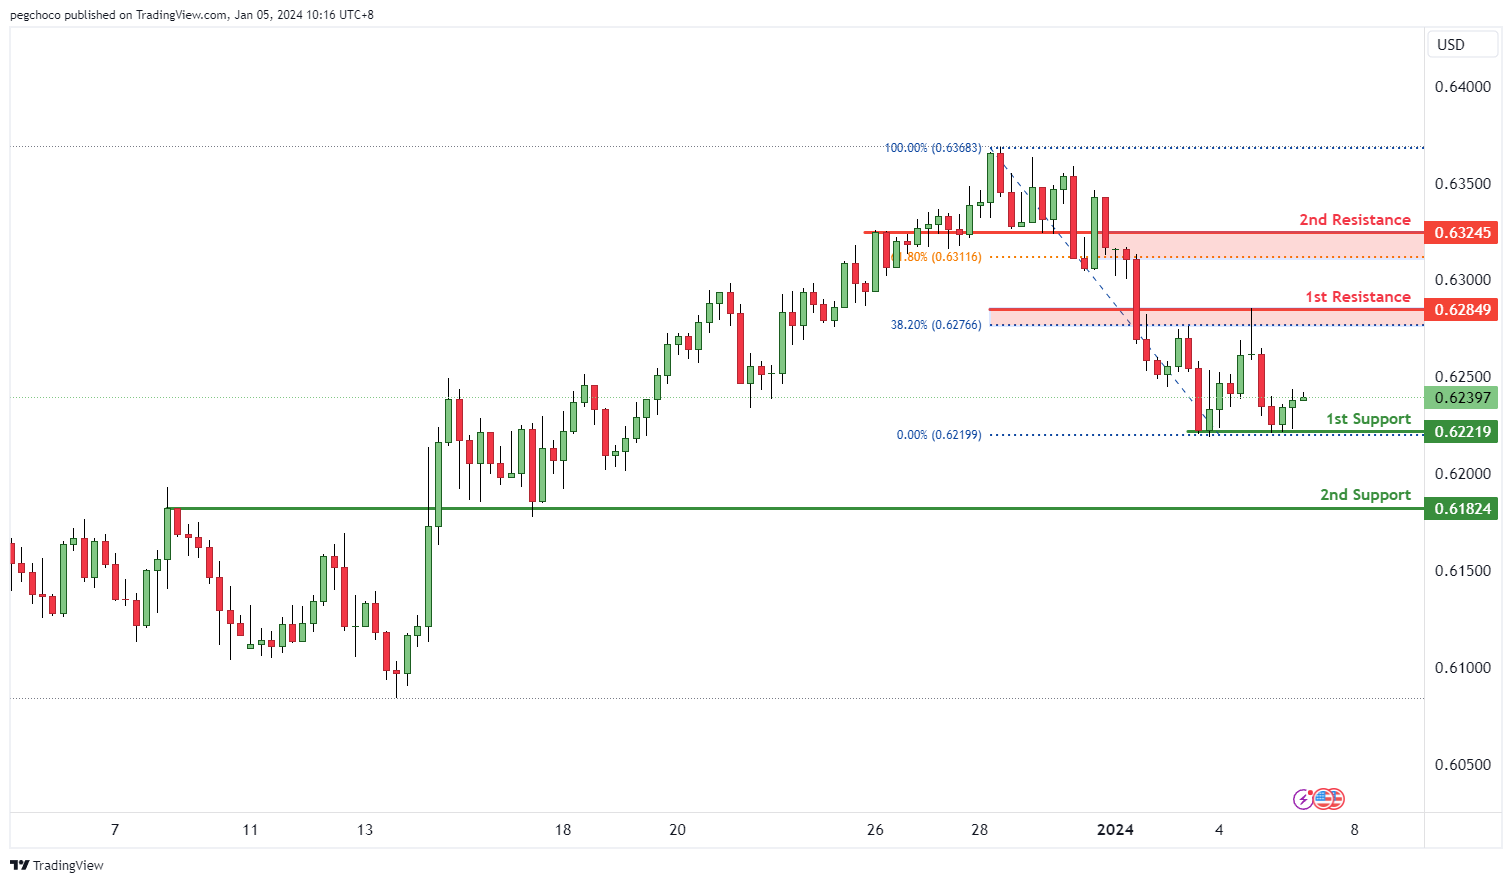
NZD/USD
The NZD/USD chart currently exhibits a bullish overall momentum, indicating a potential strength in the New Zealand Dollar against the US Dollar. In the short term, there’s the potential for a bullish bounce off the 1st support level, followed by a move towards the 1st resistance.
The 1st support at 0.6221 is identified as a multi-swing low support. This level holds significance as it suggests a potential area where buying interest may emerge, providing support for the NZD/USD pair.
The 2nd support at 0.6182 is categorized as an overlap support. While the reason for its significance is not provided, it still represents a potential support zone.
On the resistance side, the 1st resistance at 0.6284 is categorized as an overlap resistance. This level may act as a significant barrier where selling interest could intensify, potentially causing a temporary halt or reversal in the bullish movement.
The 2nd resistance at 0.6324 is also noted as an overlap resistance. This level represents another potential barrier where selling pressure may increase.
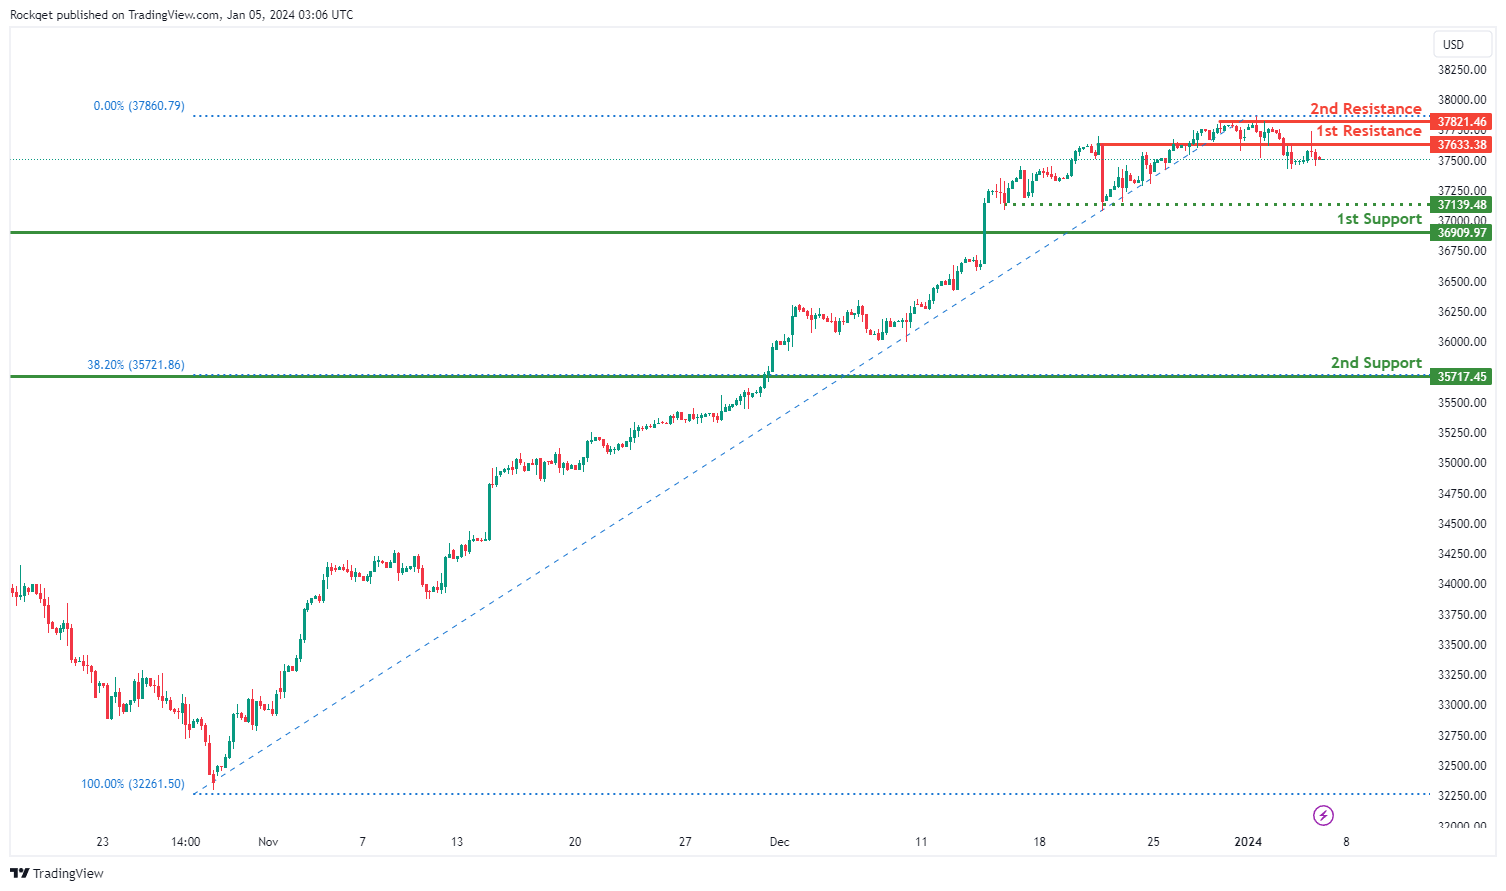
DJ30:
The DJ30 chart currently exhibits a weak bearish overall momentum, suggesting a potential for a downward trend, albeit with low confidence. There is a possibility of a bearish continuation towards the 1st support.
The 1st support at 36909.97 is considered advantageous as it signifies a pullback support level, indicating a historical significance where buying interest has previously emerged.
The 2nd support at 35717.45 is recognized as a pullback support and coincides with the 38.20% Fibonacci Retracement, adding confluence to its potential as a support level.
The intermediate support at 37139.48 is acknowledged as a swing low support, providing an additional level of potential support.
On the resistance side, the 1st resistance at 37633.38 is identified as an overlap resistance, suggesting a historical level where selling interest may materialise.
The 2nd resistance at 37821.46 is noted as a swing high resistance, representing a potential barrier for further upward movement.
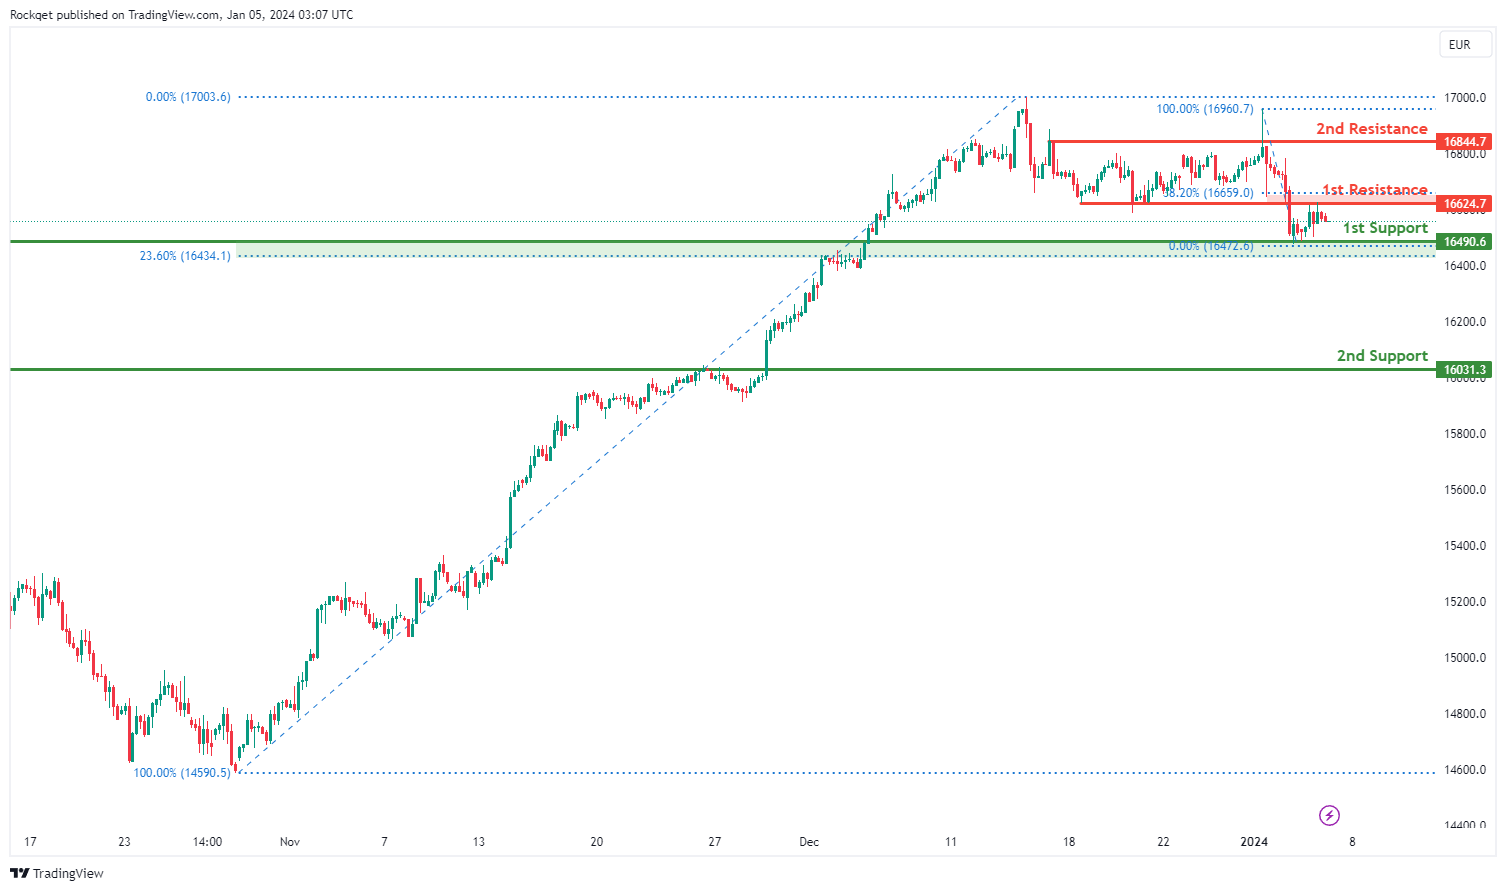
GER40:
The GER40 chart currently indicates a neutral overall momentum, suggesting a lack of a clear trend direction. Several factors contribute to this neutral momentum, and there is a potential scenario for price to fluctuate between the 1st resistance and 1st support levels.
The 1st support at 16490.60 is deemed favourable due to its identification as an overlap support, indicating historical significance as a level where buying interest has previously emerged. Additionally, it coincides with the 23.60% Fibonacci Retracement, adding confluence to its potential as a support level.
The 2nd support at 16031.30 is recognized as a pullback support, further supporting the idea of potential buying interest.
On the resistance side, the 1st resistance at 16624.70 is identified as pullback resistance and aligns with the 38.20% Fibonacci Retracement, suggesting a historical level where selling interest may emerge.
The 2nd resistance at 16844.70 is noted as a swing high resistance, representing a potential barrier for further upward movement.
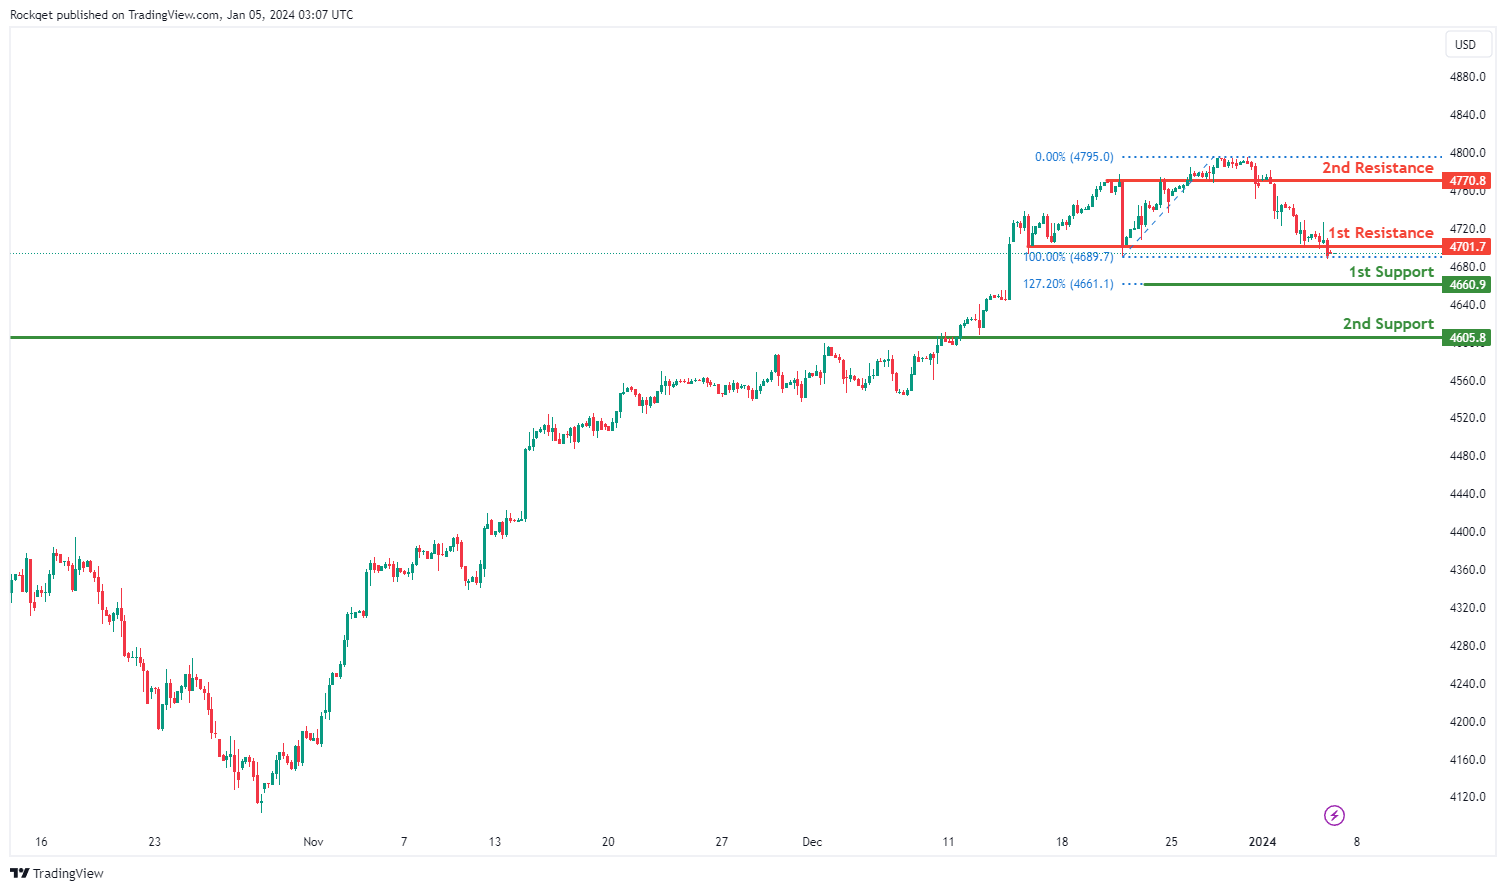
US500:
The US500 chart currently exhibits a bearish overall momentum, indicating a downward trend. Several factors contribute to this bearish momentum, and there is a potential scenario for a bearish reaction off the 1st resistance, leading to a drop to the 1st support.
The 1st support at 4660.9 is considered favourable due to its identification as an area where buying interest may emerge. This level coincides with the 127.20% Fibonacci Extension, adding confluence to its potential as a support level.
The 2nd support at 4605.8 is recognized as an overlap support, suggesting historical significance as a level where buyers have previously stepped in.
On the resistance side, the 1st resistance at 4701.7 is identified as pullback resistance, representing a potential level where selling interest may materialise.
The 2nd resistance at 4770.8 is noted as an overlap resistance, further adding significance to this potential barrier for upward movement.
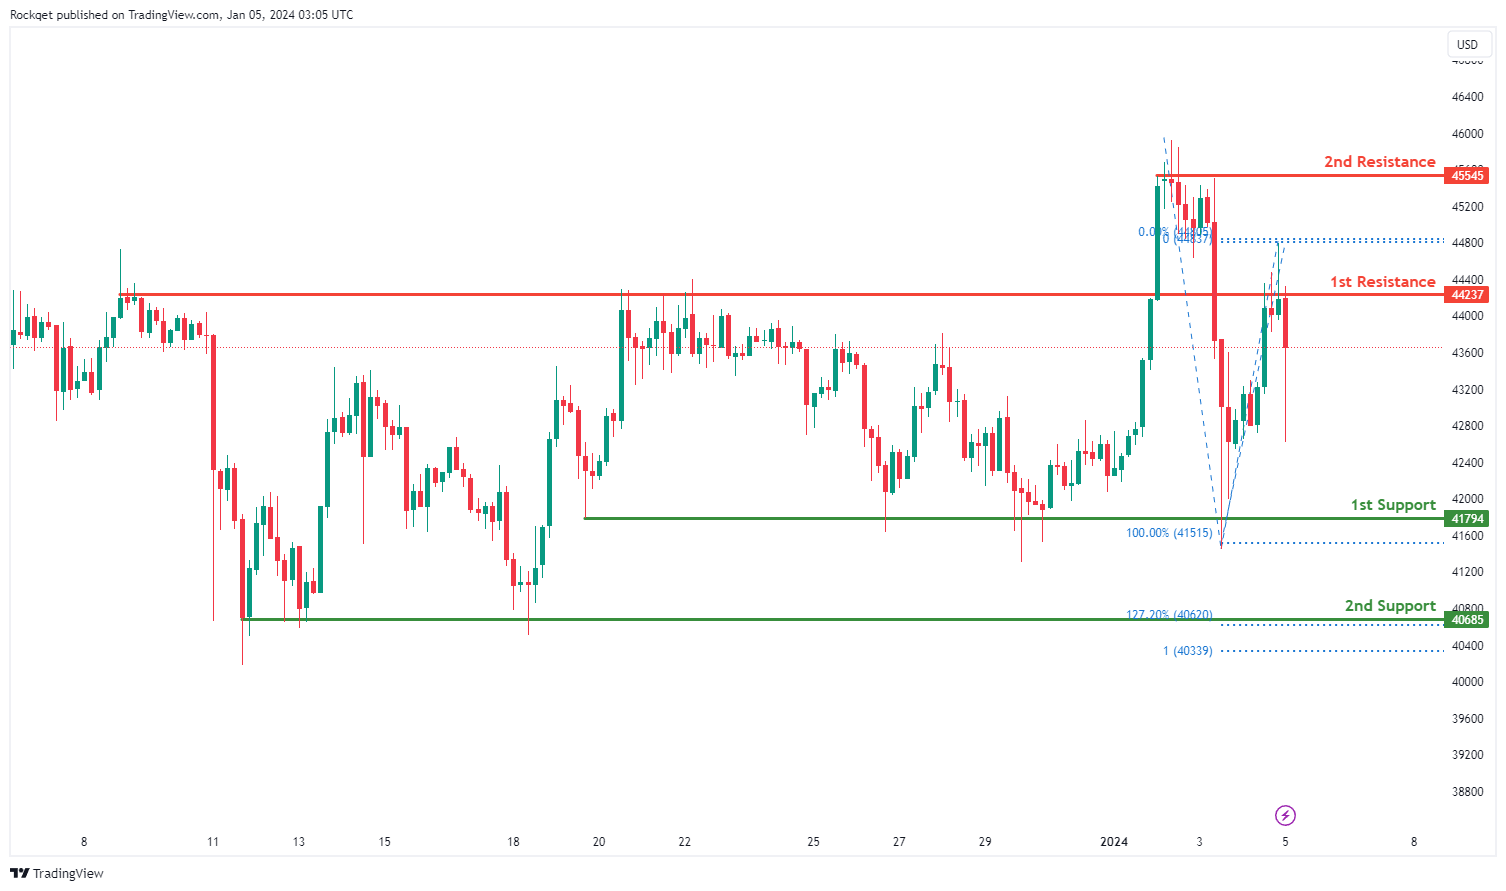
BTC/USD:
The BTC/USD chart currently indicates a bearish overall momentum, signalling a downward trend. There is a potential scenario for a bearish reaction off the 1st resistance, leading to a drop to the 1st support.
The 1st support at 41794 is considered favourable due to its identification as a multi-swing low support, suggesting historical significance as a level where buying interest has previously emerged.
The 2nd support at 40685 adds confluence to its potential as a support level, being both a multi-swing low support and coinciding with the 127.20% Fibonacci Retracement.
On the resistance side, the 1st resistance at 44237 is identified as an overlap resistance, representing a potential level where selling interest may materialise.
The 2nd resistance at 45545 is noted as a swing high resistance, further adding significance to this potential barrier for upward movement.
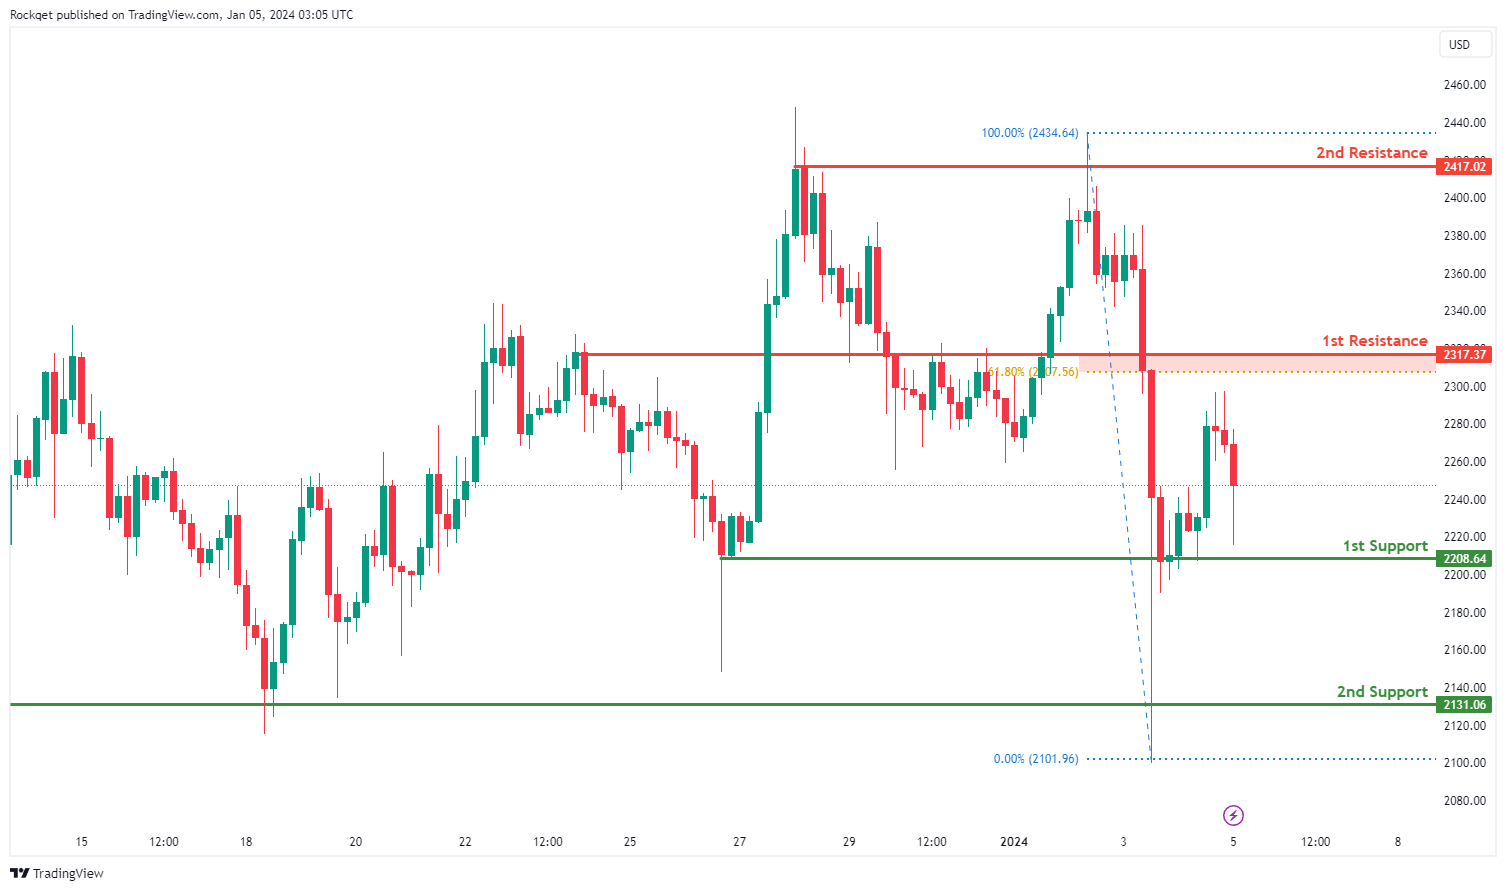
ETH/USD:
The ETH/USD chart currently reflects a bearish overall momentum, indicating a downward trend. There is a potential scenario for a bearish reaction off the 1st resistance, leading to a drop to the 1st support.
The 1st support at 2208.64 is considered favourable due to its identification as a multi-swing low support, suggesting historical significance as a level where buying interest has previously emerged.
The 2nd support at 2131.06 adds confluence to its potential as a support level, being another multi-swing low support.
On the resistance side, the 1st resistance at 2317.37 is identified as an overlap resistance and coincides with the 61.80% Fibonacci Retracement, representing a potential level where selling interest may materialise.
The 2nd resistance at 2417.02 is noted as a multi-swing high resistance, further adding significance to this potential barrier for upward movement.
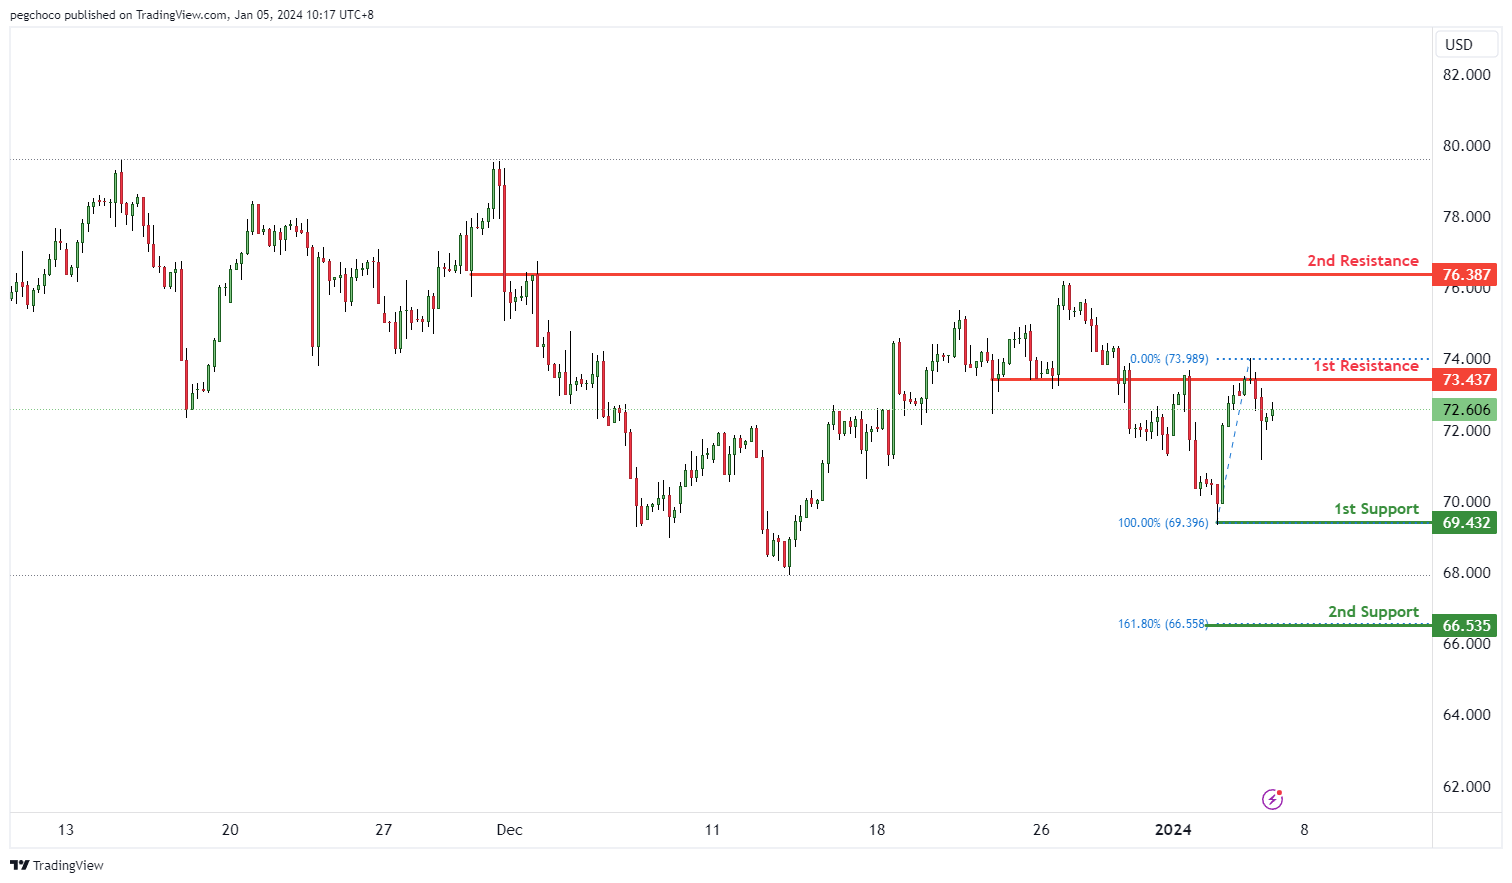
WTI/USD:
The WTI (West Texas Intermediate) chart currently has a bearish overall momentum, indicating a downward trend in the price of oil. In the short term, there’s potential for a bearish reaction off the 1st resistance level, followed by a drop towards the 1st support.
The 1st support at 69.43 is categorized as a swing low support. This level is significant as it suggests a potential area where buying interest may emerge, providing temporary support for the WTI price.
The 2nd support at 66.53 is also mentioned as a potential support level, although the reason for its significance is not provided.
On the resistance side, the 1st resistance at 73.43 is categorized as an overlap resistance. This level may act as a substantial barrier where selling interest could intensify, potentially leading to a bearish reversal.
The 2nd resistance at 76.38 is noted as an overlap resistance. This level also represents a potential barrier where selling pressure may increase.
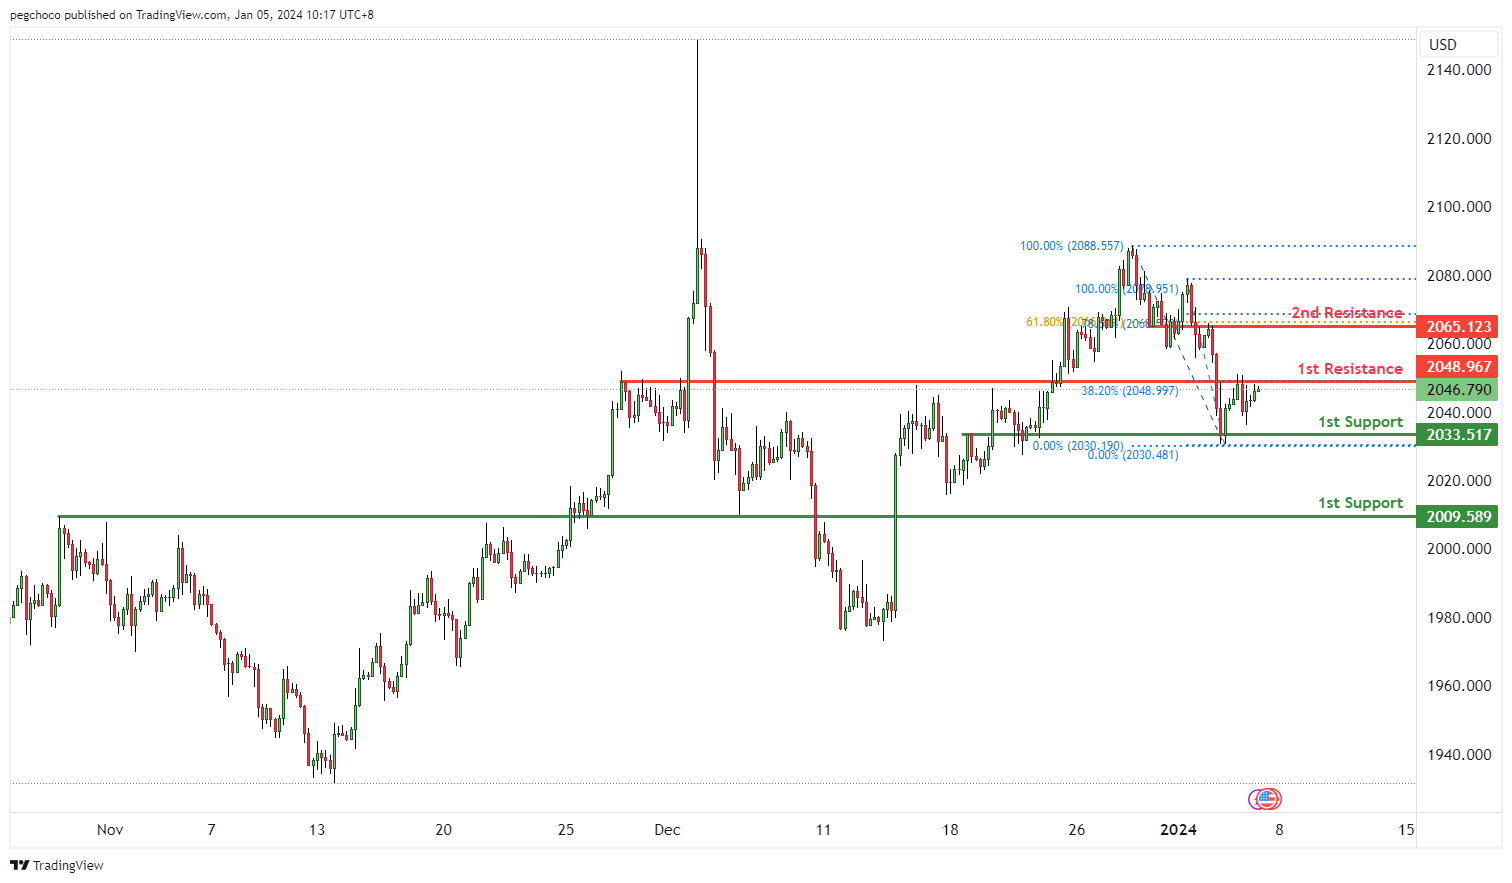
XAU/USD (GOLD):
The XAU/USD chart is currently exhibiting a bearish overall momentum, indicating that the price of gold (XAU) is weaker compared to the US Dollar (USD). In the short term, there’s potential for a bearish reaction off the 1st resistance level, followed by a drop towards the 1st support.
The 1st support at 2033.51 is categorized as an overlap support. This level is significant as it suggests a potential area where buying interest may emerge, providing temporary support for the XAU/USD pair.
The 2nd support at 2009.58 is also identified as an overlap support, further reinforcing its significance as a potential support zone.
On the resistance side, the 1st resistance at 2048.96 is categorized as an overlap resistance and is associated with the 38.20% Fibonacci Retracement level. This level may act as a substantial barrier where selling interest could intensify, potentially leading to a bearish reversal.
The 2nd resistance at 2065.12 is noted as an overlap resistance and is associated with both the 61.80% and 78.60% Fibonacci Retracement levels, indicating Fibonacci confluence. This reinforces the significance of this resistance level, making it a critical zone for potential reversals or strong selling pressure.
EUR/CHF on edge: Will Eurozone CPI trigger downside breakout?
Euro is currently trading weaker against its European peers and Dollar as market anticipates the release of Eurozone CPI flash data for December. Expectations are set for the headline CPI to increase from 2.4% yoy to 3.0% yoy, ending a six-month streak of consecutive declines. Meanwhile, core CPI is expected to slow down from 3.6% yoy to 3.4% yoy.
The jump in headline inflation shouldn't be a surprise to ECB officials. Executive Board member Isabel Schnabel had acknowledged last monththat a temporary uptick in inflation was possible. But she also expected it to "gradually" fall to ECB's 2% target by 2025. The anticipated continued decline in core inflation could reinforce the ECB's confidence that the trend of disinflation is still ongoing.
Currently, swap markets are factoring in approximately 1.6 percentage points of rate cuts by ECB this year, with 60% probability of these cuts commencing as early as March. The critical consideration now is the pace of disinflation: whether it is rapid enough to justify earlier rate cuts, or slow enough to warrant maintaining the current restrictive policy stance for a longer duration.
Today's Eurozone CPI data could be pivotal for the Euro's performance. Any results that fall short of expectations might trigger another wave of selling pressure. Specifically, break of 0.9252 support will resume EUR/CHF's down trend from 1.0095, and target 100% projection of 0.9995 to 0.9416 from 0.9683 at 0.9104 next.