Sample Category Title
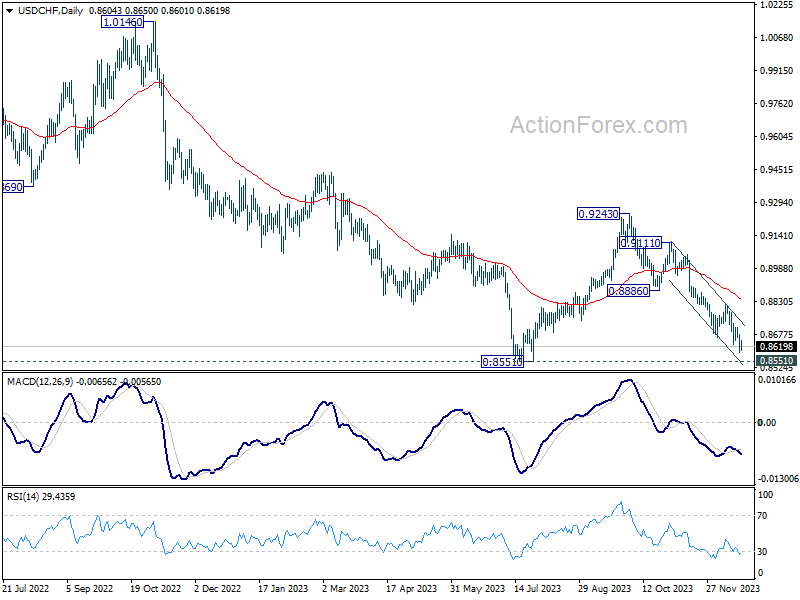
GBPNZD Wave Analysis
- GBPNZD broke key support level 2.0290
- Likely to fall to support level 2.0000
GBPNZD currency pair recently broke the key support level 2.0290 (which has been reversing the price from the middle of June).
The breakout of the support level 2.0290 coincided with the breakout of the 50% Fibonacci correction of the upward impulse from April.
Given the strongly bearish sterling sentiment, GBPNZD can be expected to fall further to the next round support level 2.0000.
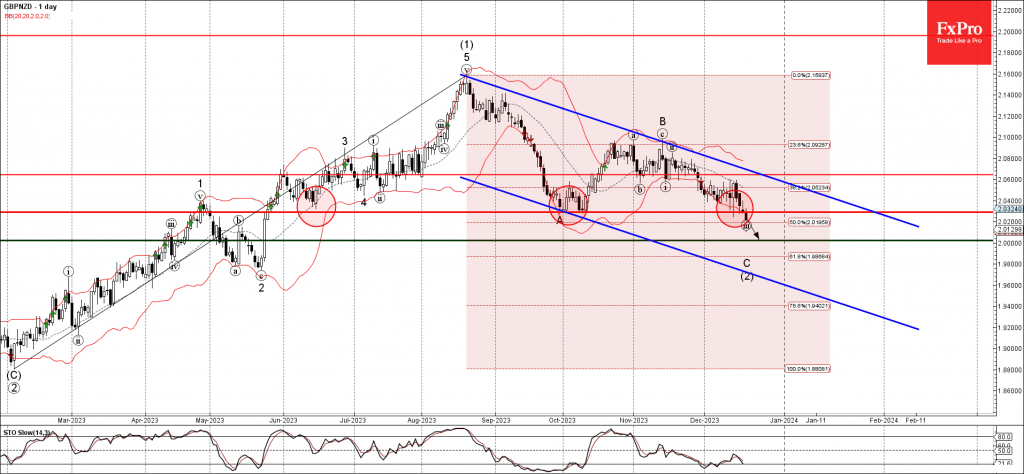
CHFJPY Pulls Back From Record Highs
- CHFJPY has lost some ground over the last month
- Yet, overall picture remains overwhelmingly positive
- Decisive break below 160 level needed to change that
CHFJPY suffered a minor retreat in recent weeks, after hitting a record high back in November. That said, the structure of higher highs and higher lows remains in force, which suggests that the market remains in a broader uptrend.
Momentum oscillators are near their neutral levels, providing few clues about what comes next. The RSI is around its 50 level, and although the MACD is still negative, it is currently trying to surpass its red trigger line.
In case buyers take back the wheel, their first test will take place around 167.30, a region that also encompasses the 50-day simple moving average (SMA). If they slice above it, that could open the way towards the record high of 170.52. Another move higher from there would bring the market into uncharted territory, turning the focus to round psychological numbers such as 175.00 as potential resistance areas.
On the flipside, a selloff could see the pair drop towards the 162.00 territory, which halted the declines twice this month. If sellers are powerful enough to drive the pair lower, an even bigger battle could take place near the 160.00 area, which is where the 200-day SMA is located as well.
In a nutshell, despite the latest retreat, the broader trend remains resolutely positive. A move below 160.00 is needed to change that.
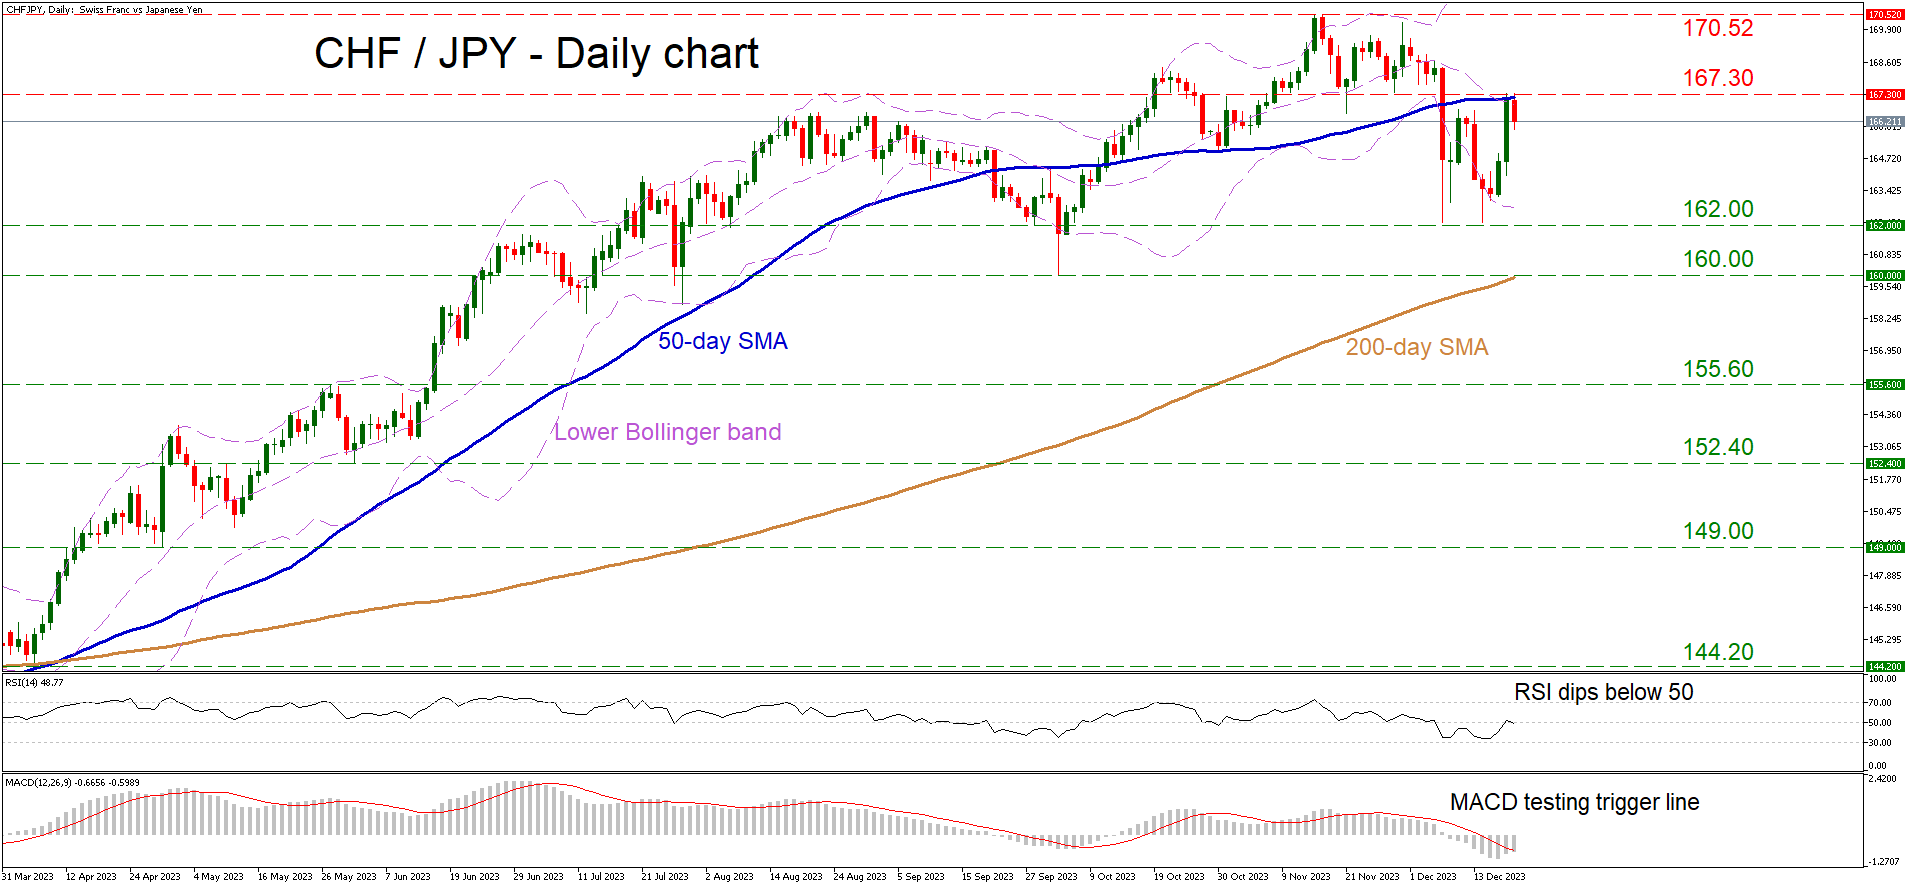
NZDUSD Climbs to Fresh 5-month High, Eyes 0.6300 Level
- NZDUSD headed for eighth straight day of gains
- Bullish momentum continues to strengthen
- But is it at risk of a negative correction?
NZDUSD reached a fresh five-month high of 0.6293 on Wednesday, as its bullish streak shows no sign of easing. The momentum indicators are looking dangerously overbought but a reversal may not be imminent and the current upswing could continue for a little bit longer.
The stochastics have crossed into the overstretched zone but the %K and %D lines remain positively aligned, while the MACD has managed to rise back above its red signal line.
However, there is a more prominent warning sign from the upper Bollinger Band, which has been trying to put a lid on the rally for the past few sessions. If the price finally succumbs to this impediment, it could pull back towards the 0.6200 level, before retreating towards the middle Bollinger band, which is also the 20-day simple moving average (SMA) and near the 61.8% Fibonacci retracement of the July-October downtrend.
A dip below the 20-day SMA, currently at 0.6160, the decline could extend until the 0.6050 region, which encompasses the highs from September, October and November, as well as the lower Bollinger band.
But in the event that the bulls keep on powering ahead, there could be further trouble at the 0.6300 handle, which needs to be overcome if the rally is to advance towards the July top of 0.6410.
All in all, despite the rising risk of a downside correction, both the short- and medium-term picture for NZDUSD is resoundingly positive. Only a fall below the lower Bollinger band would undermine the bullish structure, while a climb above the July peak would place the uptrend on an even more sustainable footing.
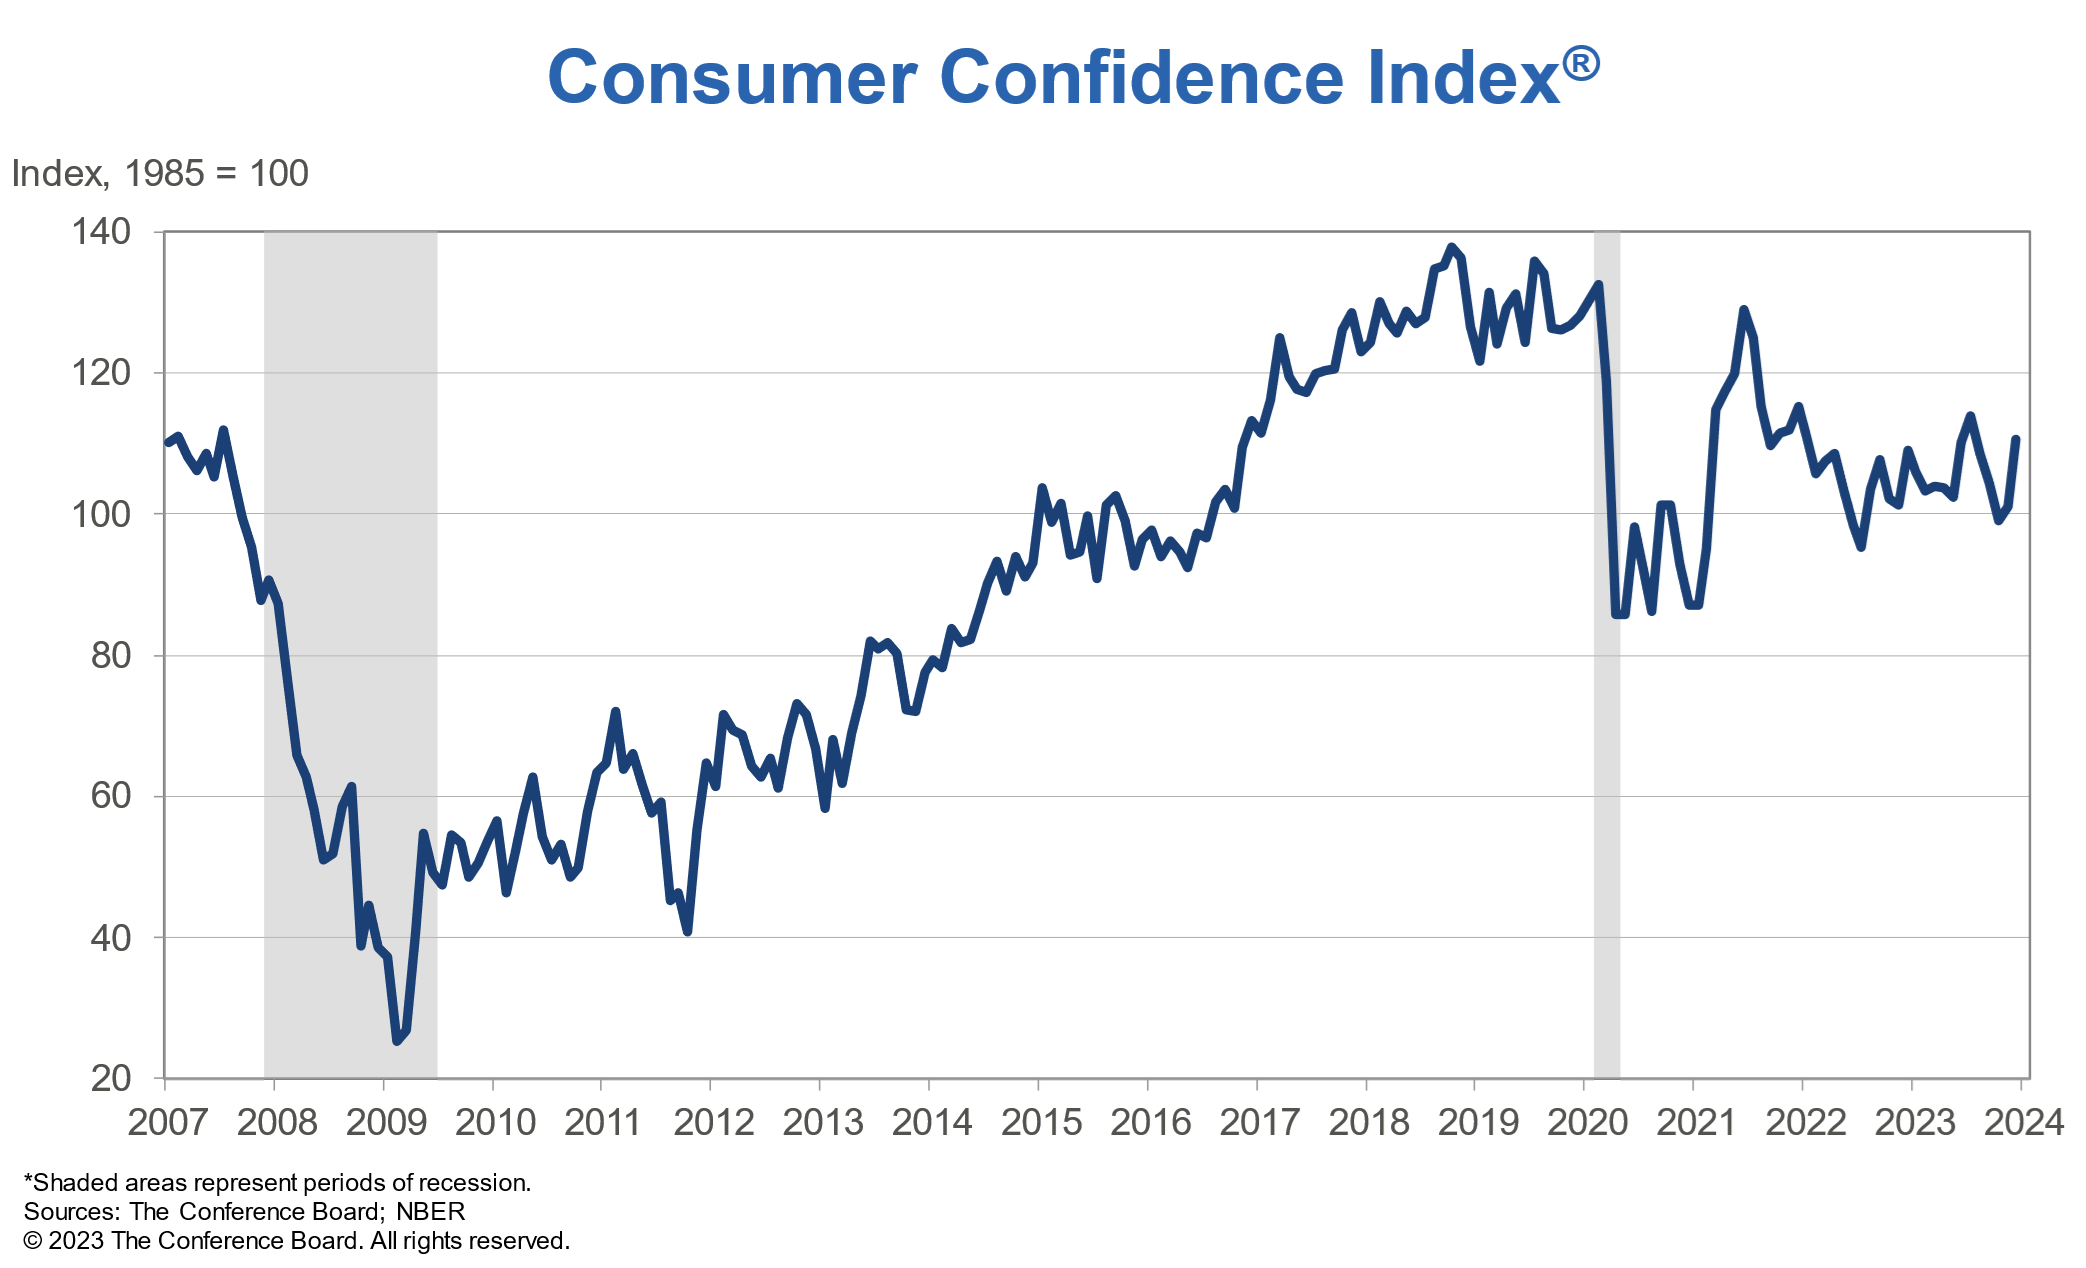
US consumer confidence rises to 110.7 in Dec
US Conference Board Consumer Confidence rose from 101.0 to 110.7 in December, above expectation of 103.9. Present Situation Index rose from 136.5 to 148.5. Expectations Index rose from 77.4 to 85.6.
"December's increase in consumer confidence reflected more positive ratings of current business conditions and job availability, as well as less pessimistic views of business, labor market, and personal income prospects over the next six months," said Dana Peterson, Chief Economist at The Conference Board.
"While December's renewed optimism was seen across all ages and household income levels, the gains were largest among householders aged 35-54 and households with income levels of $125,000 and above. December's write-in responses revealed the top issue affecting consumers remains rising prices in general, while politics, interest rates, and global conflicts all saw downticks as top concerns. Consumers' Perceived Likelihood of a US Recession over the Next 12 Months abated in December to the lowest level seen this year—though two-thirds still perceive a downturn is possible in 2024."
Will US Data Bring Pre-Christmas Joy to the Dollar?
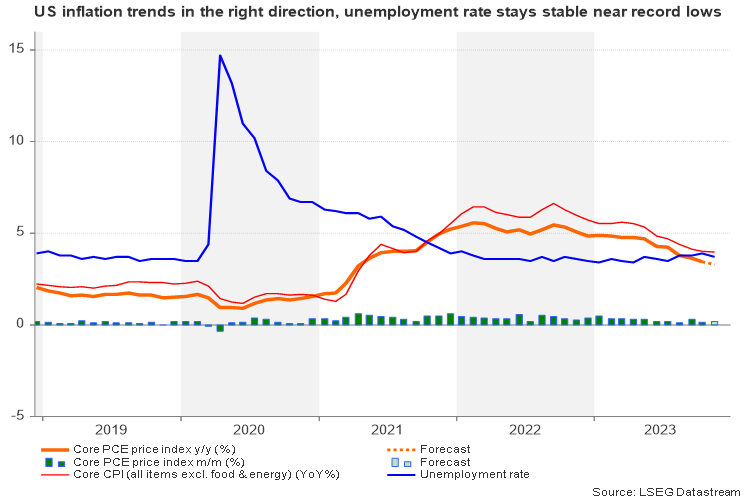
- Core PCE inflation to fall further on Friday 13:30 GMT, no big surprises expected
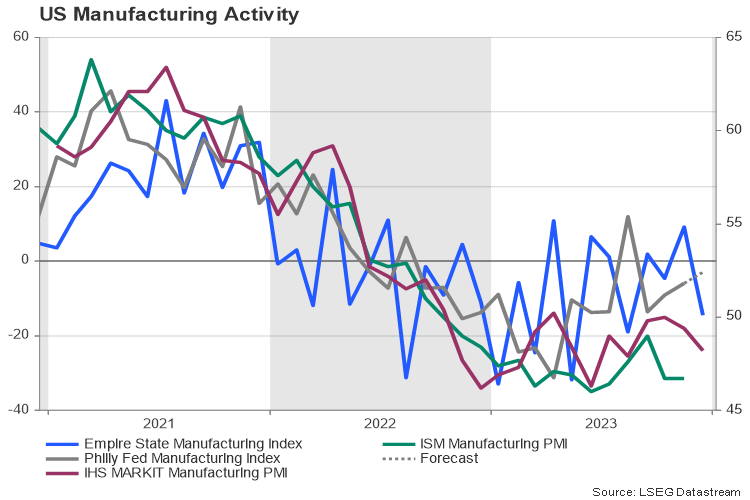
- Philly Fed manufacturing index, new home sales also on the agenda
- Investors see more than three rate cuts in 2024; US dollar could react moderately
The transition to monetary easing
The transition to monetary easing could be a hot theme in 2024. Global central banks excluding the Bank of Japan were more or less synchronized in their battle against high inflation following the pandemic price shock, delivering the most aggressive rate hiking cycle in decades. It’s still uncertain if this disinflation is mainly a result of normalizing supply chains or indeed because of tighter financial conditions (or both). In any case, inflation reacted in the right way, cooling substantially from its highs without causing a significant increase in the unemployment rate in 2023.
Although the possibility of another rate increase has not entirely evaporated as geopolitics and elevated wages keep threatening another upturn in inflation, Fed policymakers are now more confident to discuss a potential shift to rate cuts, probably because they are still concerned about the delayed effects of high borrowing costs in an important election year. The median projection of 19 Fed officials showed at least three reductions to 4.5% in 2024 during last week’s FOMC policy meeting, with futures markets currently awaiting the first 25 bps slash to come as soon as in March with a 65% probability. That said, market pricing should not be taken for granted as there are still three months ahead of data collection and sentiment could easily change.
US calendar to get busy, but little chance of festive cheer for the dollar
The Philadelphia Fed manufacturing index could come first into view on Thursday at 13:30 GMT. Forecasts are pointing to improving but still negative business conditions in the festive month of December, with the index expected to strengthen from -5.9 to -3.0.
Then on Friday at the same time, the focus will fall on the Fed’s favorite inflation measure, the core PCE price index for November. Analysts predict a slowdown to 3.3% y/y from 3.5% previously and a stable monthly increase of 0.2%. Other details of the report may reveal a moderate monthly pickup in personal income to 0.4% from 0.2% before and a steady expansion of 0.3% in personal consumption.
As regards the inflation trends, the CPI report has already updated investors on November’s price tendencies, whilst the S&P Global manufacturing PMI figures released last week have also informed investors about the latest changes in business sentiment. Hence, this week’s data may not trigger a notable pre-Christmas rally in the greenback, likely causing a balanced reaction in markets instead. Nevertheless, it would be interesting to see if the rise in medical care expenses, shelter & housing, and transportation persisted in the PCE report as the CPI data showed.
Meanwhile, traders could also pay attention to the Philly Fed employment and new orders sub-indices, which have been lacking strength since the start of the year. New home sales due on the same day at 15:00 GMT have been trending downwards as well over the past four months.
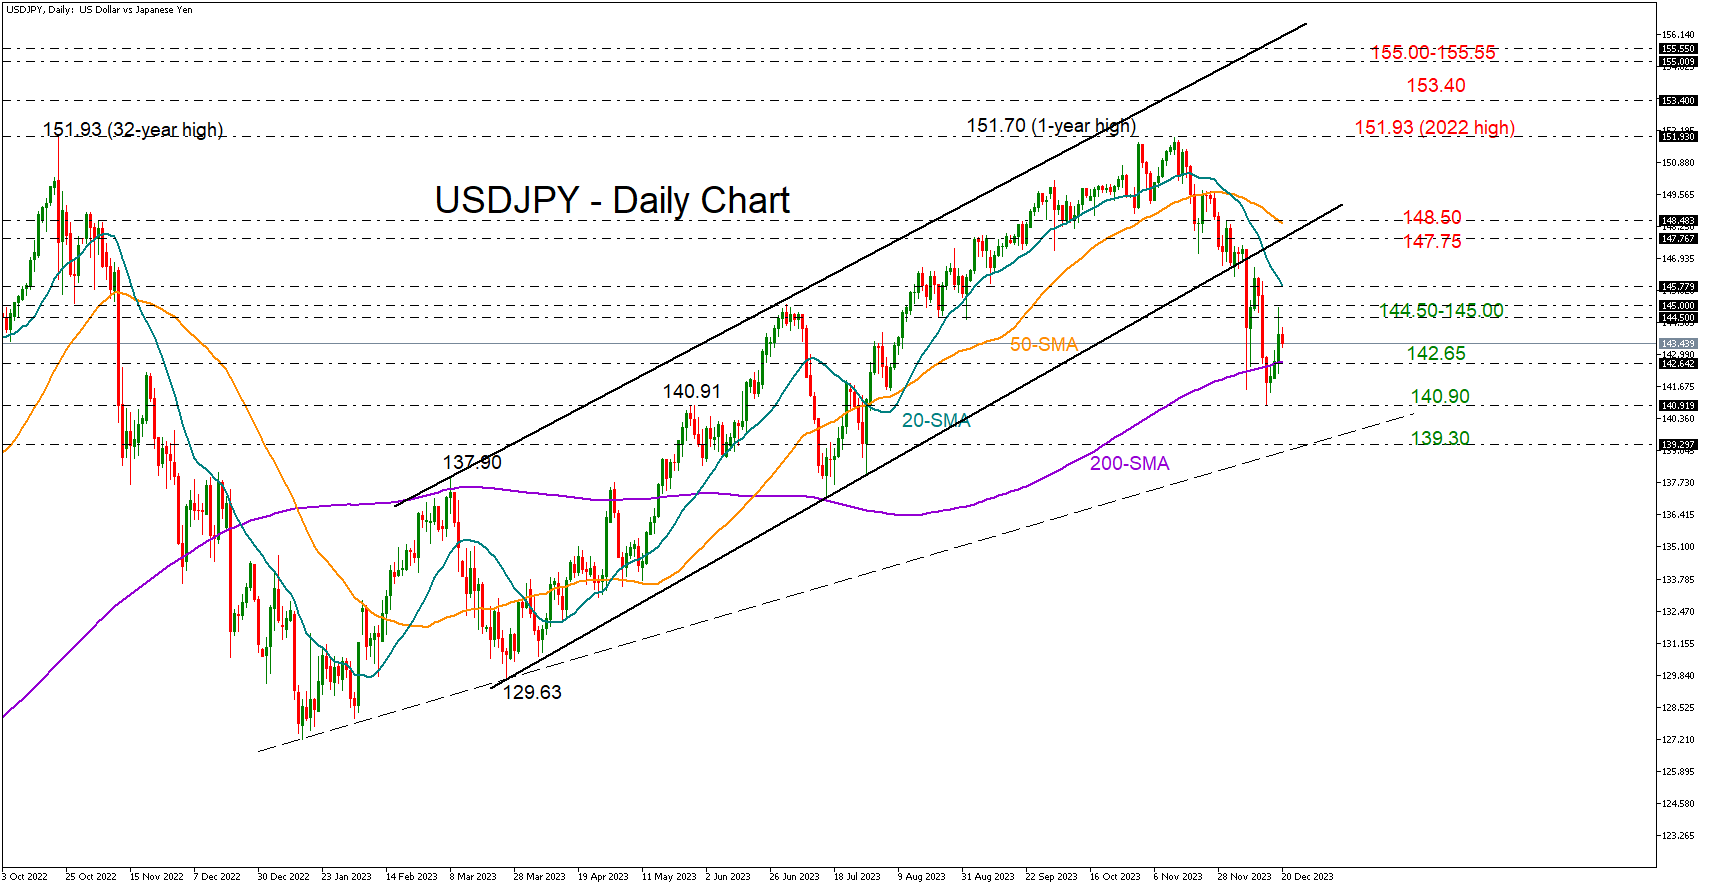
USD/JPY levels to watch
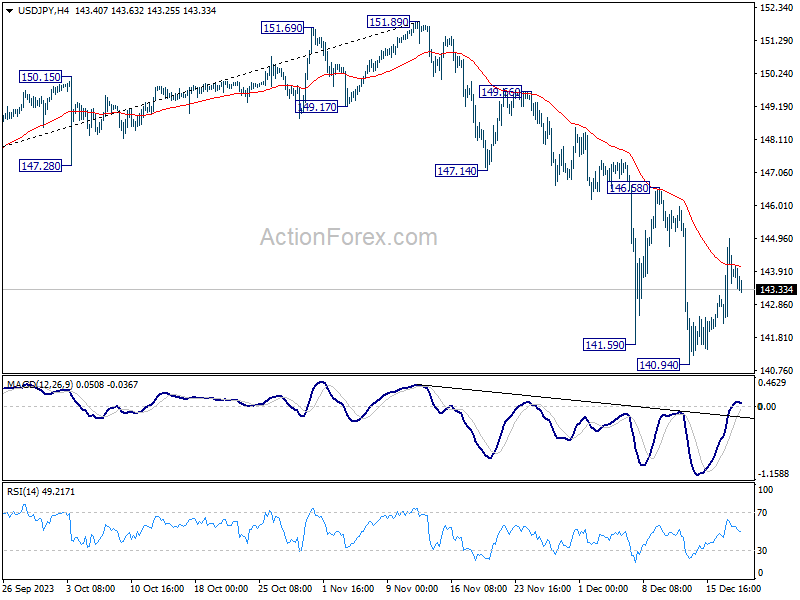
Following last week’s stronger-than-expected retail sales, another round of upbeat reports could somewhat ease investors' aggressive pricing of 150 bps of rate cuts by the end of 2024. Consequently, USDJPY could crawl higher to test the 145.00 level. If the bulls claim that barrier, closing above the 20-day simple moving average (SMA) too, the pair could next head for the 147.75-148.50 region.
In the event the data arrives worse than analysts anticipate, increasing the odds for a rate cut in March, the pair could slump to meet its 200-day SMA at 142.65. A continuation lower could initially challenge the almost five-month low of 140.94, while a steeper decline could meet the support trendline, which connects the lows from January and March, near 139.30.
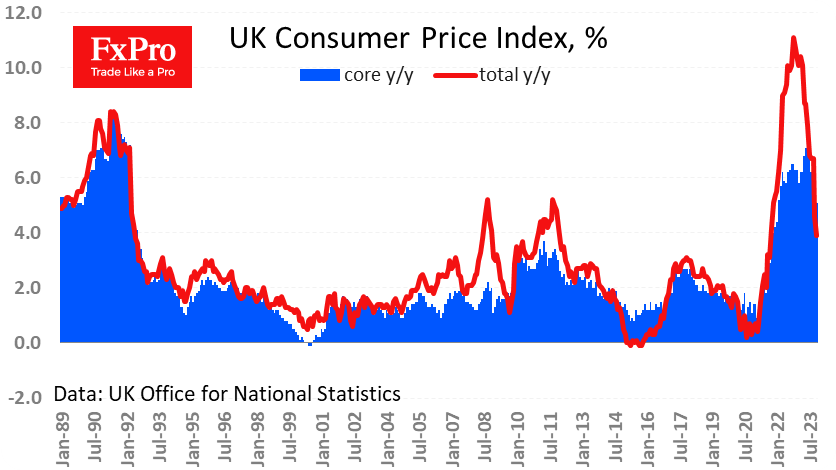
Soft Inflation Has Pressed the Pound, But Hardly the BoE
Britain’s impressive slowdown in inflation has increased speculation around a rate cut next year. The headline consumer price index lost 0.2% in November, and the annual rate slowed from 4.6% to 3.9% – impressively below the expected 4.3%. Inflation excluding food and energy slowed from 5.7% to 5.1%, versus an expected 5.6%. This is the slowest rate of growth since September 2021 in the former and since January 2022 in the latter.
The latest data has convinced us that the UK has climbed out of the territory of the highest rate of price growth since the early 1990s. Current rates were also seen in 2008 and 2011.
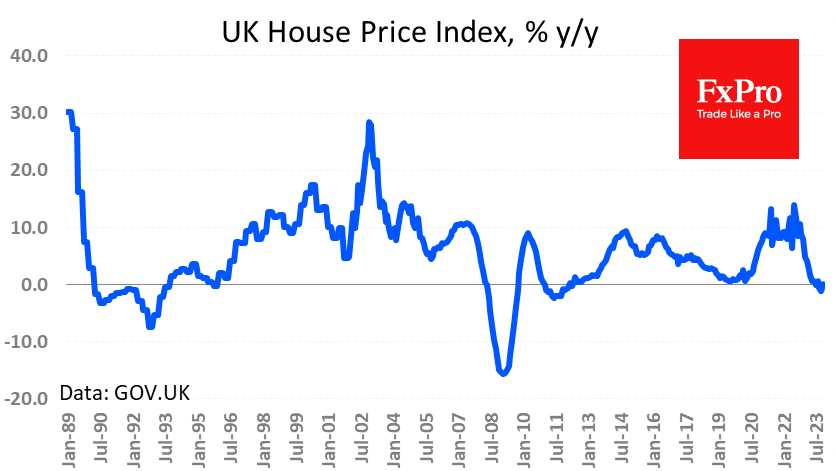
A separate report published a little later noted a 1.2% y/y fall in house prices in October, although the average forecast was for a 0.0% fall. The current decline is the deepest since 2011.
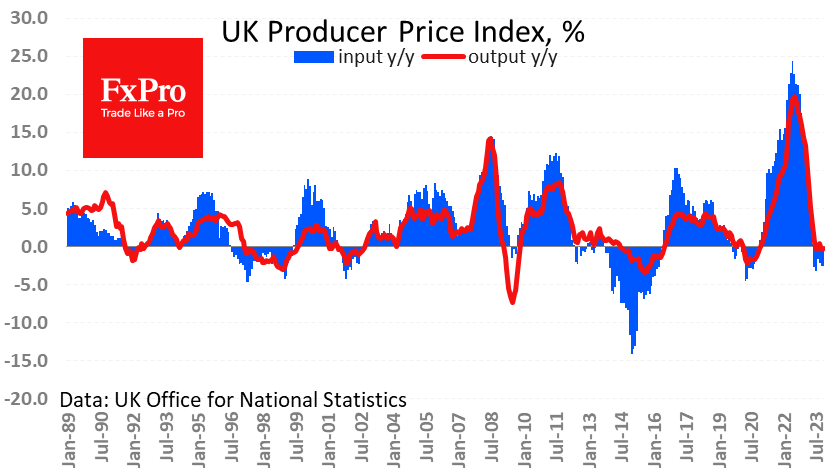
Producer prices maintained their pace of contraction, as Input PPI lost 2.6% y/y while Output was down 0.2%. The negative pace has persisted here for half a year, lowering the degree of concern around rising final prices. However, PPIs fell less than expected, suggesting a slightly stickier inflation. At the same time, retailers and manufacturers may further pass on costs to end consumers due to 7.2% y/y wage increases, keeping fears of a classic wage-price spiral alive.
The Pound reacted with a 0.75% drop on the inflation reports, temporarily back to $1.2630 – the area of this week’s lows. At the same time, it’s worth bearing in mind that the Bank of England displayed a hawkish attitude last week in spite of the Fed’s dovish reversal. It seems that the UK Central Bank is in no hurry to change its rhetoric just because of the pace of wages.
Steady Recovery Signals Strength Amid Market Cautiousness
Market picture
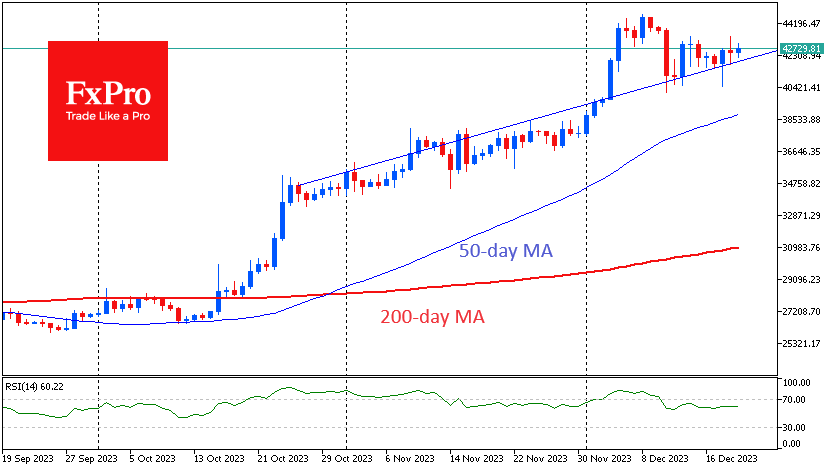
Crypto market capitalisation has changed little over the past 24 hours, standing at $1.61 trillion with fluctuations between $1.57 trillion and $1.62 trillion. The cryptocurrency market remains cautious, which can easily be explained by the perception that cryptocurrencies have grown far more than expected in the past year. But the correction is no longer prevalent.
Bitcoin is losing 0.6% in 24 hours, trading at $42.8K. The resistance of the ascending channel from late October has recently got support, marking the persistence of the buy-the-dip pattern. This behaviour is setting up for a quick retest of the December highs near $45K.
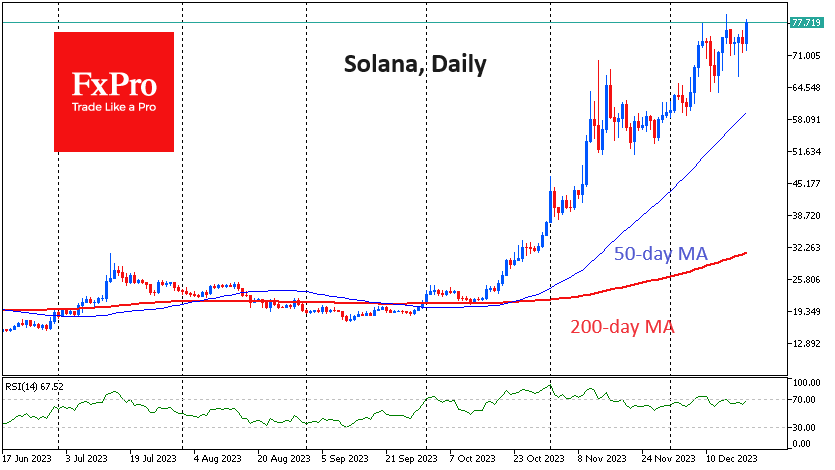
Solana is already testing the December highs near $78. The coin’s price has almost tripled from the start of the rally on 13 October, but it’s 70% below the peak. By comparison, Bitcoin is 37% lower, and the entire crypto market is 42% lower. The fact that Solana is recovering more steadily than most major competitors shows more interest in it in the community, which promises to keep its performance above the market in the coming months.
News background
Google searches on Solana have soared 250% in the past two months. User interest has coincided with the explosive growth of the asset and rising prices of related meme coins. The Solana blockchain continues to grow strongly with the background of new protocols and related airdrops.
MicroStrategy founder Michael Saylor described Bitcoin as an asset that has the potential to change investment strategies around the world. He said, “If Bitcoin doesn’t aim for zero, it will reach $1 million. If it’s a legitimate asset for institutional investors, it’s not getting enough attention.”
BlackRock conceded to the SEC and updated its application for a spot bitcoin ETF. The company’s proposal now includes a mechanism to redeem units for fiat money. This is a redemption model that the SEC considers safer for investors compared to redemption in BTC.
The U.S. District Court for the Northern District of Illinois approved a settlement in the Binance case – the exchange will pay the CFTC $2.7 billion, and Changpeng Zhao will pay $150 million. Zhao is still under investigation for his involvement in money laundering, and so far, the former Binance CEO has been unable to leave the U.S. He faces up to 18 months in prison.
Circle, the issuer of USDC, the second largest stablecoin by market capitalisation, has announced plans to launch a stablecoin cryptocurrency, EURC, pegged to the euro, on the Solana blockchain.
USD/JPY Mid-Day Outlook
Daily Pivots: (S1) 142.41; (P) 143.68; (R1) 145.12; More...
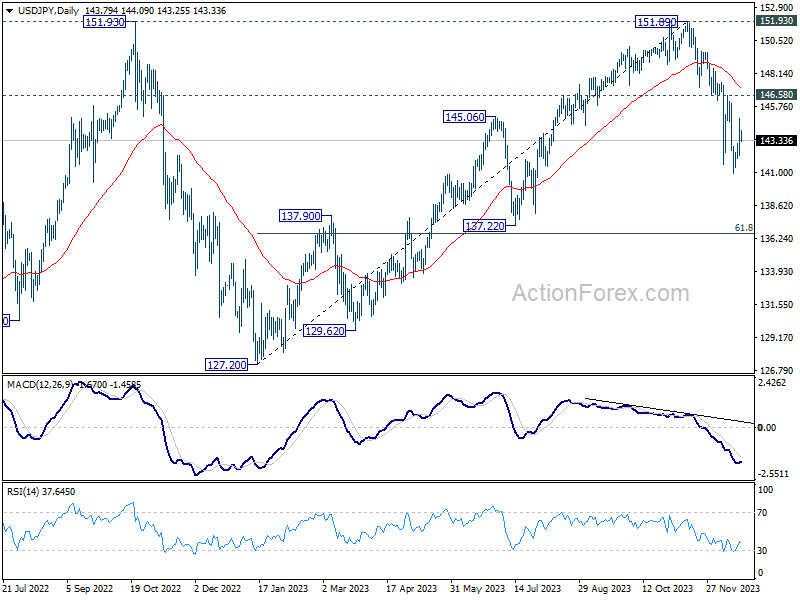
Outlook in USD/JPY is unchanged and intraday bias stays neutral at this point. Upside of current recovery should be limited below 156.48 resistance to bring another decline. Firm break of 140.94 will resume the whole fall from 151.89. Next target will be next fibonacci level at 136.63.
In the bigger picture, fall from 151.89 is seen as the third leg of the corrective pattern from 151.93 (2022 high). Deeper decline would be seen to 61.8% retracement of 127.20 to 151.89 at 136.63, sustained break there will pave the way to 127.20 support (2022 low). This will now remain the favored as long as 146.58 resistance holds.
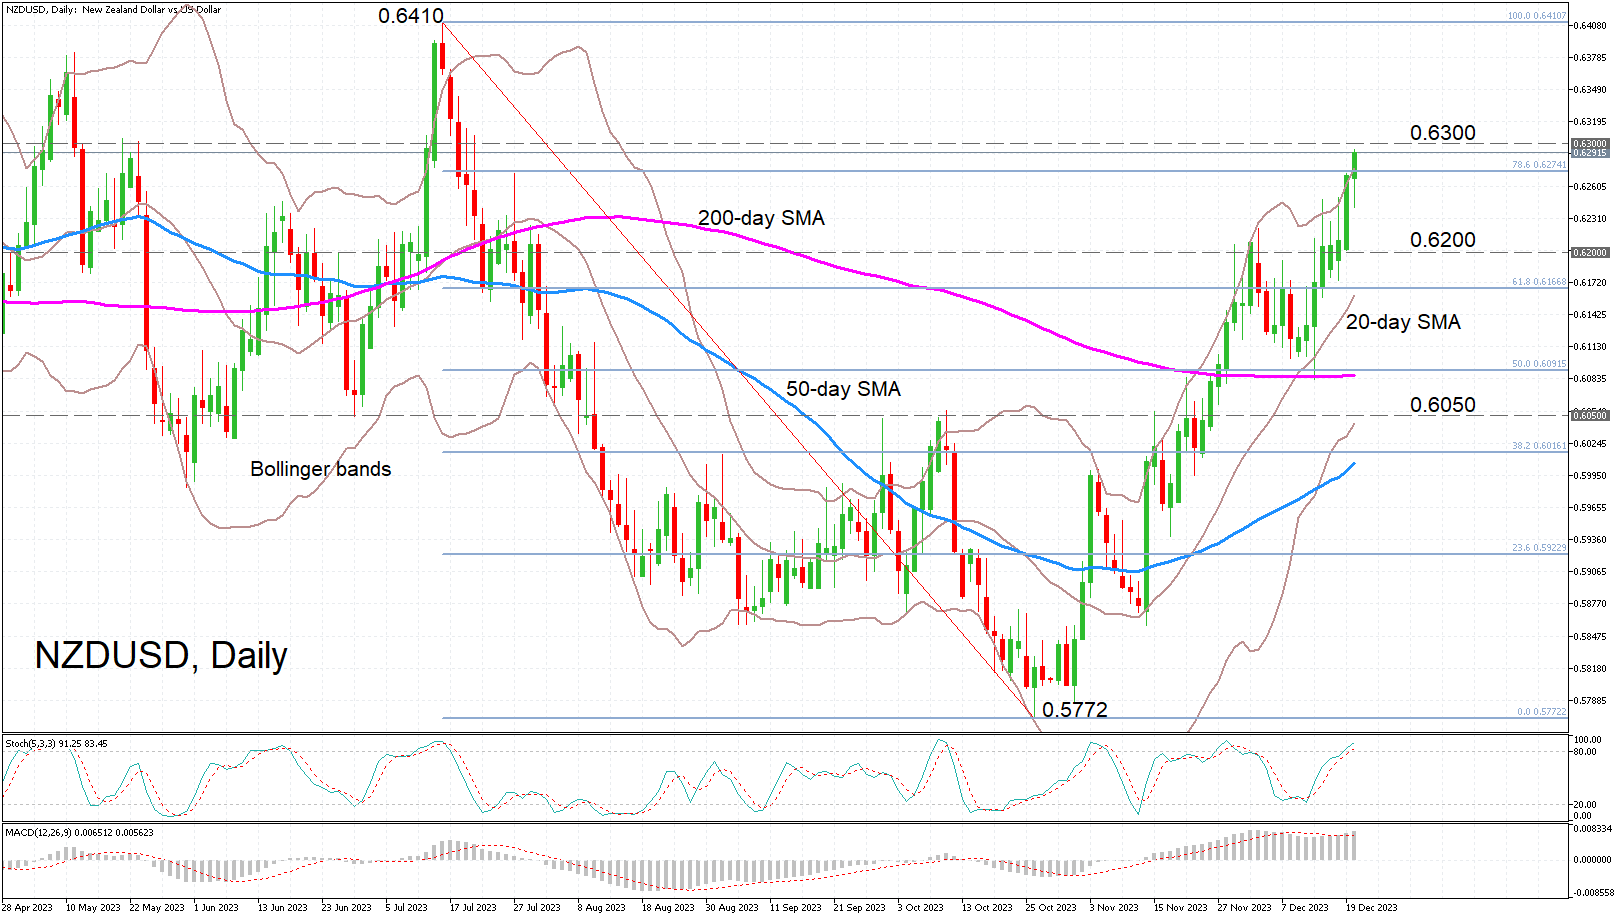
USD/CHF Mid-Day Outlook
Daily Pivots: (S1) 0.8573; (P) 0.8630; (R1) 0.8667; More....
Intraday bias in USD/CHF stays on the downside and outlook is unchanged. Current fall from 0.9243 is in progress for retesting 0.8551 key support next. On the upside, above 0.8710 minor resistance will turn intraday bias neutral again first. But outlook will remain bearish as long as 0.8819 resistance holds.
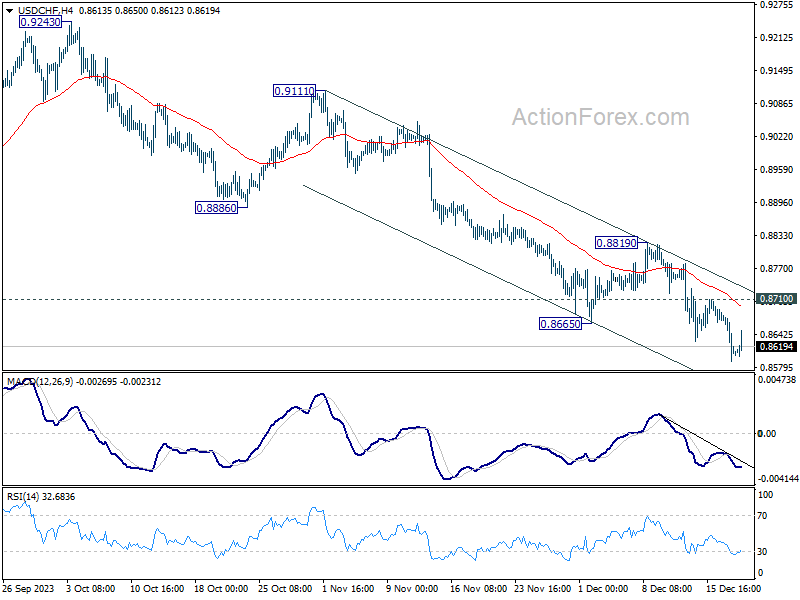
In the bigger picture, price actions from 0.8551 are currently seen as a corrective pattern to the decline from 1.0146 (2022 high). Fall from 0.9243 is seen as the second leg for now. Strong support should be seen 0.8551 to bring rebound. Meanwhile, break of 0.9111 resistance will argue that the third leg has started already, and target 0.9243.