Sample Category Title
GBP/USD Deflated By Softer Than Expected UK November Inflation Data
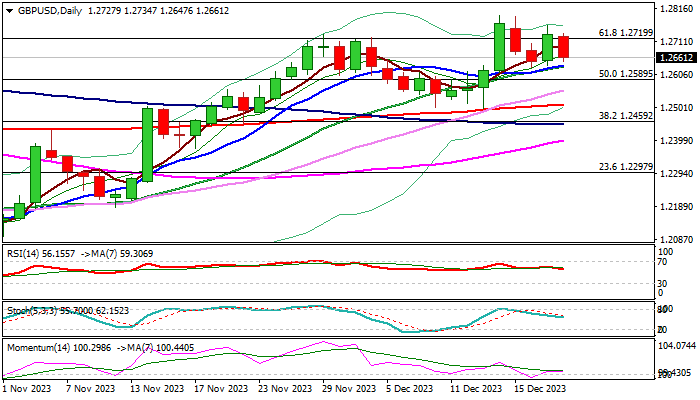
Cable dropped on Wednesday morning on softer than expected UK November inflation, losing around 0.4% after data release.
Stronger than expected drop in consumer prices adds support to rate cut scenario, making pound less attractive, though latest comments from BOE’s deputy governor about keeping restrictive policy for some time, may partially offset impact from inflation report.
Fresh weakness is on track to fully reverse Tuesday’s advance (the pair was up 0.65%) and challenge pivotal supports at 1.2636/31 (converged 10/20DMA’s).
Near-term bias is expected to remain with bulls while the these supports hold (daily studies show MA’s in bullish configuration and 14-d momentum in positive territory) and keep in play scenario for renewed probe through cracked Fibo barrier at 1.2919 (61.8% of 1.3141/1.2037) and possible acceleration towards pivotal 1.2800 zone.
Conversely, firm break of 10/20DMA’s would weaken near-term structure and risk deeper pullback towards key supports at 1.2510/00 zone (200DMA / Dec 8/13 higher base).
Res: 1.2719; 1.2761; 1.2800; 1.2818.
Sup: 1.2631; 1.2589; 1.2556; 1.2500.
USD: Initial Claims Data Incoming
The COVID-19 pandemic led to a substantial labor force transformation in the U.S., marked by 'The Great Reshuffle.' Over 50 million workers resigned in 2022, continuing the trend from 2021, but by August 2023, resignations tapered to 30.5 million. This reshuffling trend indicates a quest for better work-life balance, higher compensation, and a robust company culture. November's unemployment rate slightly dropped to 3.7%, with job gains surpassing expectations at 199,000, led by health care, government, and manufacturing sectors recovering from the United Auto Workers strike. The U.S. Chamber of Commerce is closely monitoring industry-specific trends, providing valuable insights for businesses and policymakers. Weekly jobless claims remained steady, with the insured unemployment rate at 1.3%. Notable state variations include New Jersey and California which have the highest insured unemployment rates. As the labor market adapts, businesses and policymakers are keenly observing these indicators to navigate changing workforce dynamics and economic conditions.
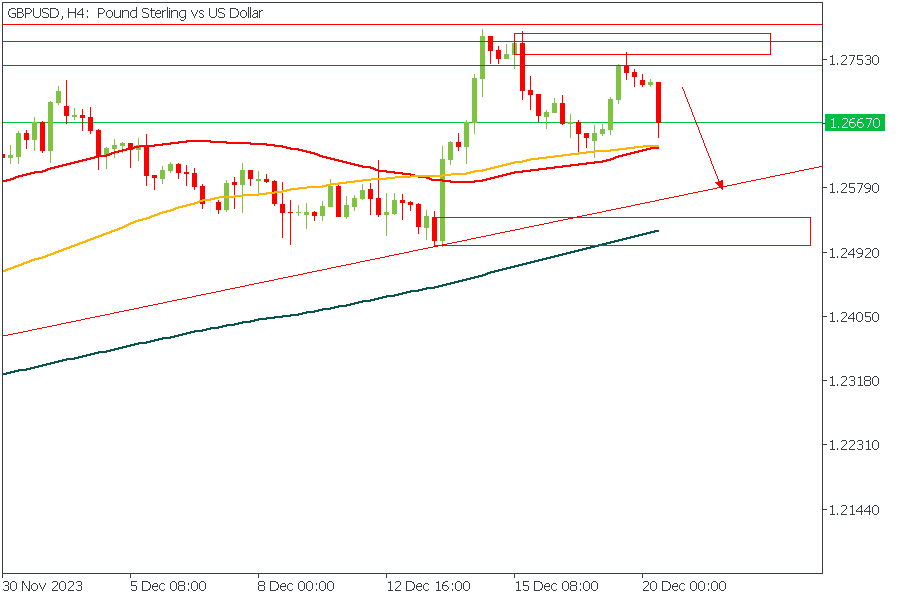
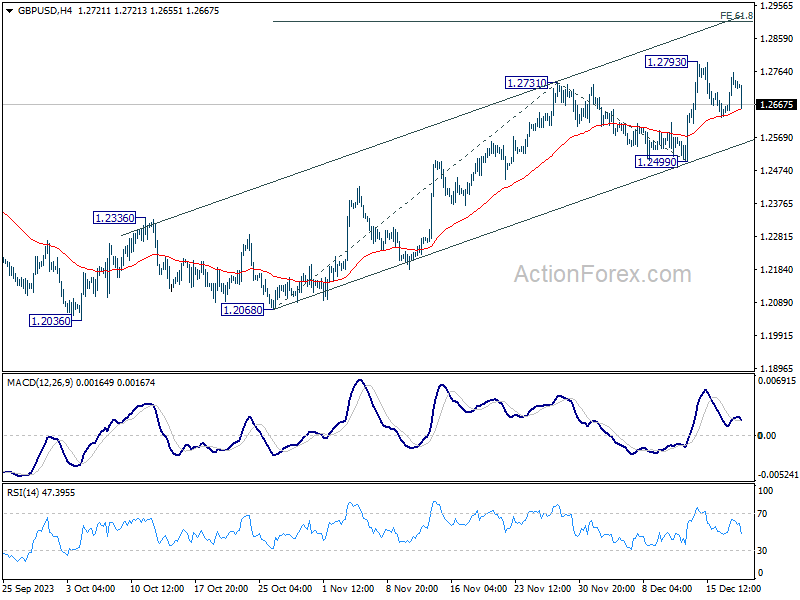
GBPUSD - H4 Timeframe
GBPUSD as seen from the attached chart above has been rejected off the rally-base-drop supply zone and seems to be aiming for the confluence region of the demand zone, moving average, and trendline support. In this situation, my sentiment remains bearish, until a proper reaction is observed from the confluence region as stated.
Analyst’s Expectations:
- Direction: Bearish
- Target: 1.25529
- Invalidation: 1.27081
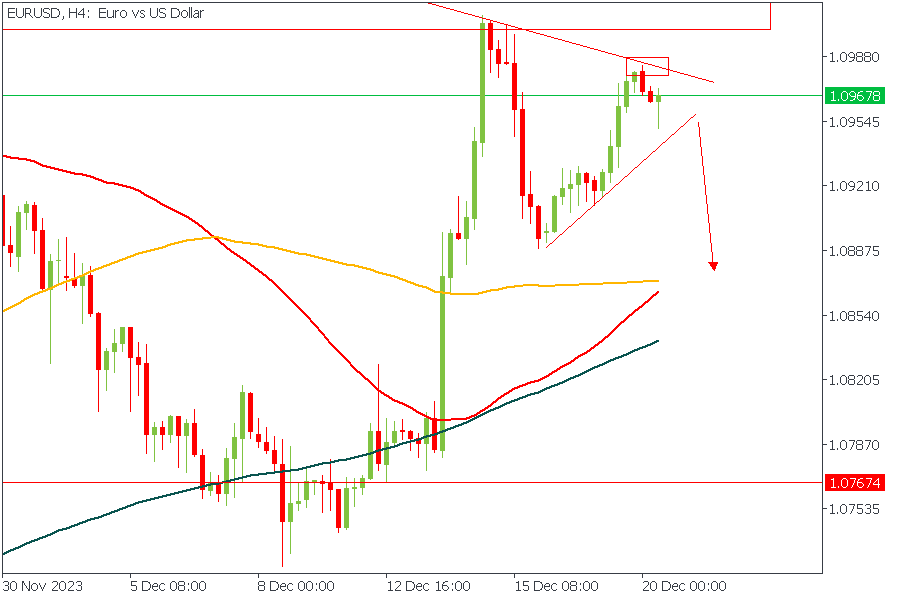
EURUSD - H4 Timeframe
EURUSD, after bouncing off the supply zone, is at the moment facing another bout of rejection from the trendline resistance. The current state of the price action is a consolidation between the two trendlines. A cautionary approach to this trade idea would be to wait for a clear break below the trendline support, whilst an aggressive approach would be to use the recent high as the stop-loss price.
Analyst’s Expectations:
- Direction: Bearish
- Target: 1.09867
- Invalidation: 1.09108
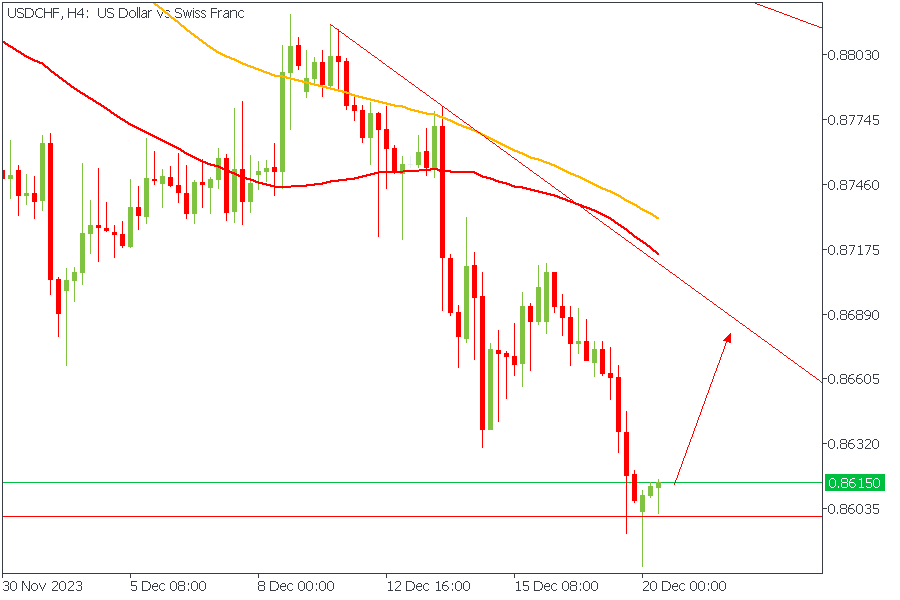
USDCHF - H4 Timeframe
As for USDCHF, price seems to be on the verge of a clean rejection from the demand zone as projected based on the pin-bar candlestick formation. I’m personally not exceedingly thrilled about this move though, since it does not have as many confluences as I’d prefer to be able to work with. In the meantime, however, I’ll keep my fingers crossed, with a tentative bullish sentiment.
Analyst’s Expectations:
- Direction: Bullish
- Target: 0.86671
- Invalidation: 0.85785
CONCLUSION
The trading of CFDs comes at a risk. Thus, to succeed, you have to manage risks properly. To avoid costly mistakes while you look to trade these opportunities, be sure to do your due diligence and manage your risk appropriately.
Gold Price Eyes Breakout, Crude Oil Price Recovers
Gold price gained traction and climbed above the $2,030 resistance level. Crude oil price is recovering, and it could climb further higher toward the $78 resistance.
Important Takeaways for Gold and Oil Prices Analysis Today
- Gold price started a decent increase from the $1,975 zone against the US Dollar.
- A connecting bullish trend line is forming with support near $2,030 on the hourly chart of gold at FXOpen.
- Crude oil prices rallied above the $71.00 and $73.00 resistance levels.
- There is a key bullish trend line forming with support near $73.00 on the hourly chart of XTI/USD at FXOpen.
Gold Price Technical Analysis
On the hourly chart of Gold at FXOpen, the price found support near the $1,975 zone. The price formed a base and started a fresh increase above the $1,990 level.
There was a decent move above the 50-hour simple moving average. The bulls pushed the price above the $2,030 resistance zone. Finally, the bears appeared near $2,045, A high is formed near $2,046.99 and the price is now consolidating gains.
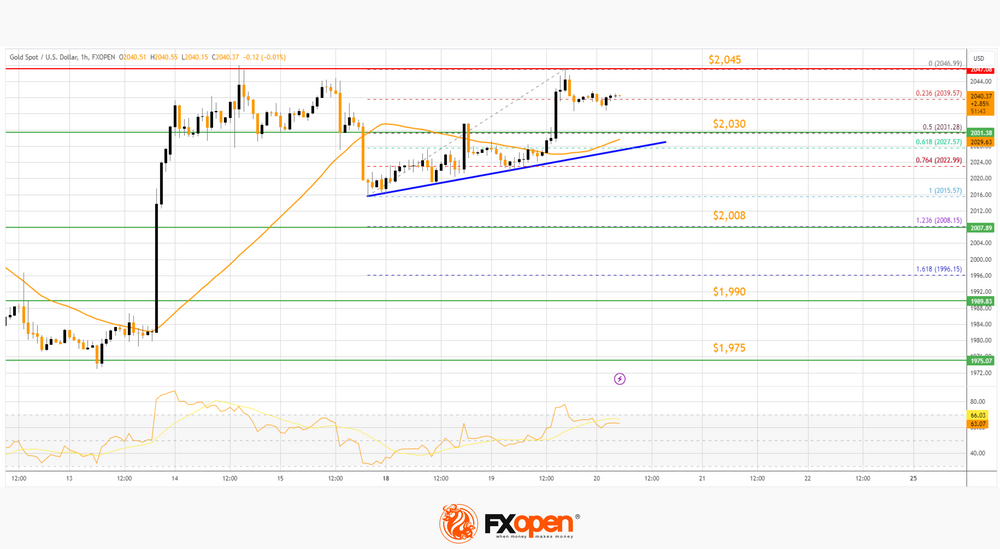
There was a minor move below the 23.6% Fib retracement level of the upward move from the $2,015 swing low to the $2,046 high. The RSI is still stable above 50 and the price could aim for more gains. Immediate resistance is near the $2,045 level.
The next major resistance is near the $2,050 level. An upside break above the $2,050 resistance could send Gold price toward $2,065. Any more gains may perhaps set the pace for an increase toward the $2,080 level.
Initial support on the downside is near the 50-hour simple moving average or $2,030. There is also a connecting bullish trend line forming with support near $2,030. The trend line is close to the 61.8% Fib retracement level of the upward move from the $2,015 swing low to the $2,046 high.
If there is a downside break below the $2,030 support, the price might decline further. In the stated case, the price might drop toward the $2,008 support.
Oil Price Technical Analysis
On the hourly chart of WTI Crude Oil at FXOpen, the price started a decent recovery wave against the US Dollar. The price gained bullish momentum after it broke the $71.00 resistance.
There was a sustained upward move above the $72.00 and $73.00 resistance levels. The bulls pushed the price toward $75.00. The current price action is positive above the 50-hour simple moving average and RSI is stable above 50.
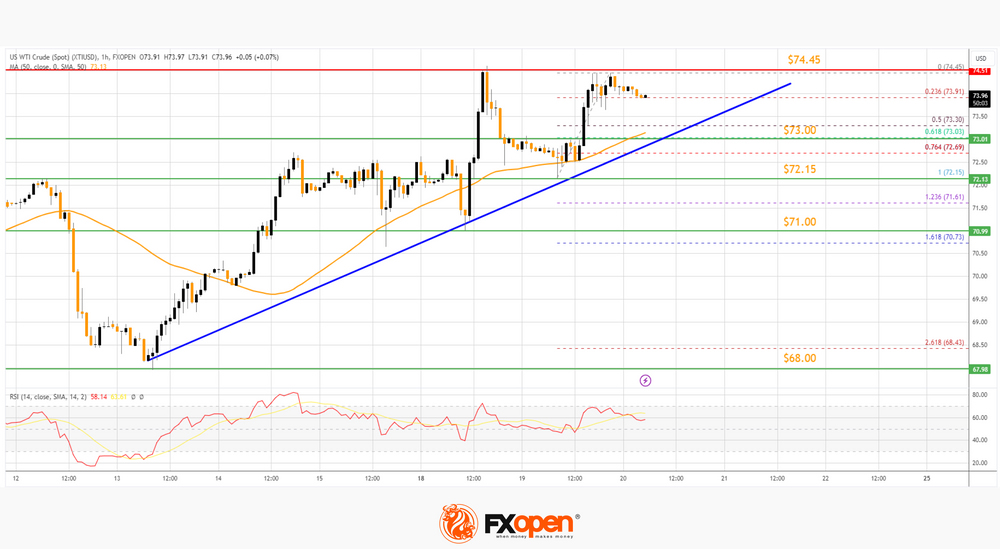
If the price climbs further higher, it could face resistance near $74.45. The first major resistance is near the $76.20 level. Any more gains might send the price toward the $78.00 level.
Conversely, the price might correct gains below the 23.6% Fib retracement level of the upward move from the $72.15 swing low to the $74.45 high. The next major support on the WTI crude oil chart is near a key bullish trend line at $73.00.
The 61.8% Fib retracement level of the upward move from the $72.15 swing low to the $74.45 high is also near $73.00. If there is a downside break, the price might decline toward $72.15. Any more losses may perhaps open the doors for a move toward the $71.00 support zone.
This article represents the opinion of the Companies operating under the FXOpen brand only. It is not to be construed as an offer, solicitation, or recommendation with respect to products and services provided by the Companies operating under the FXOpen brand, nor is it to be considered financial advice.
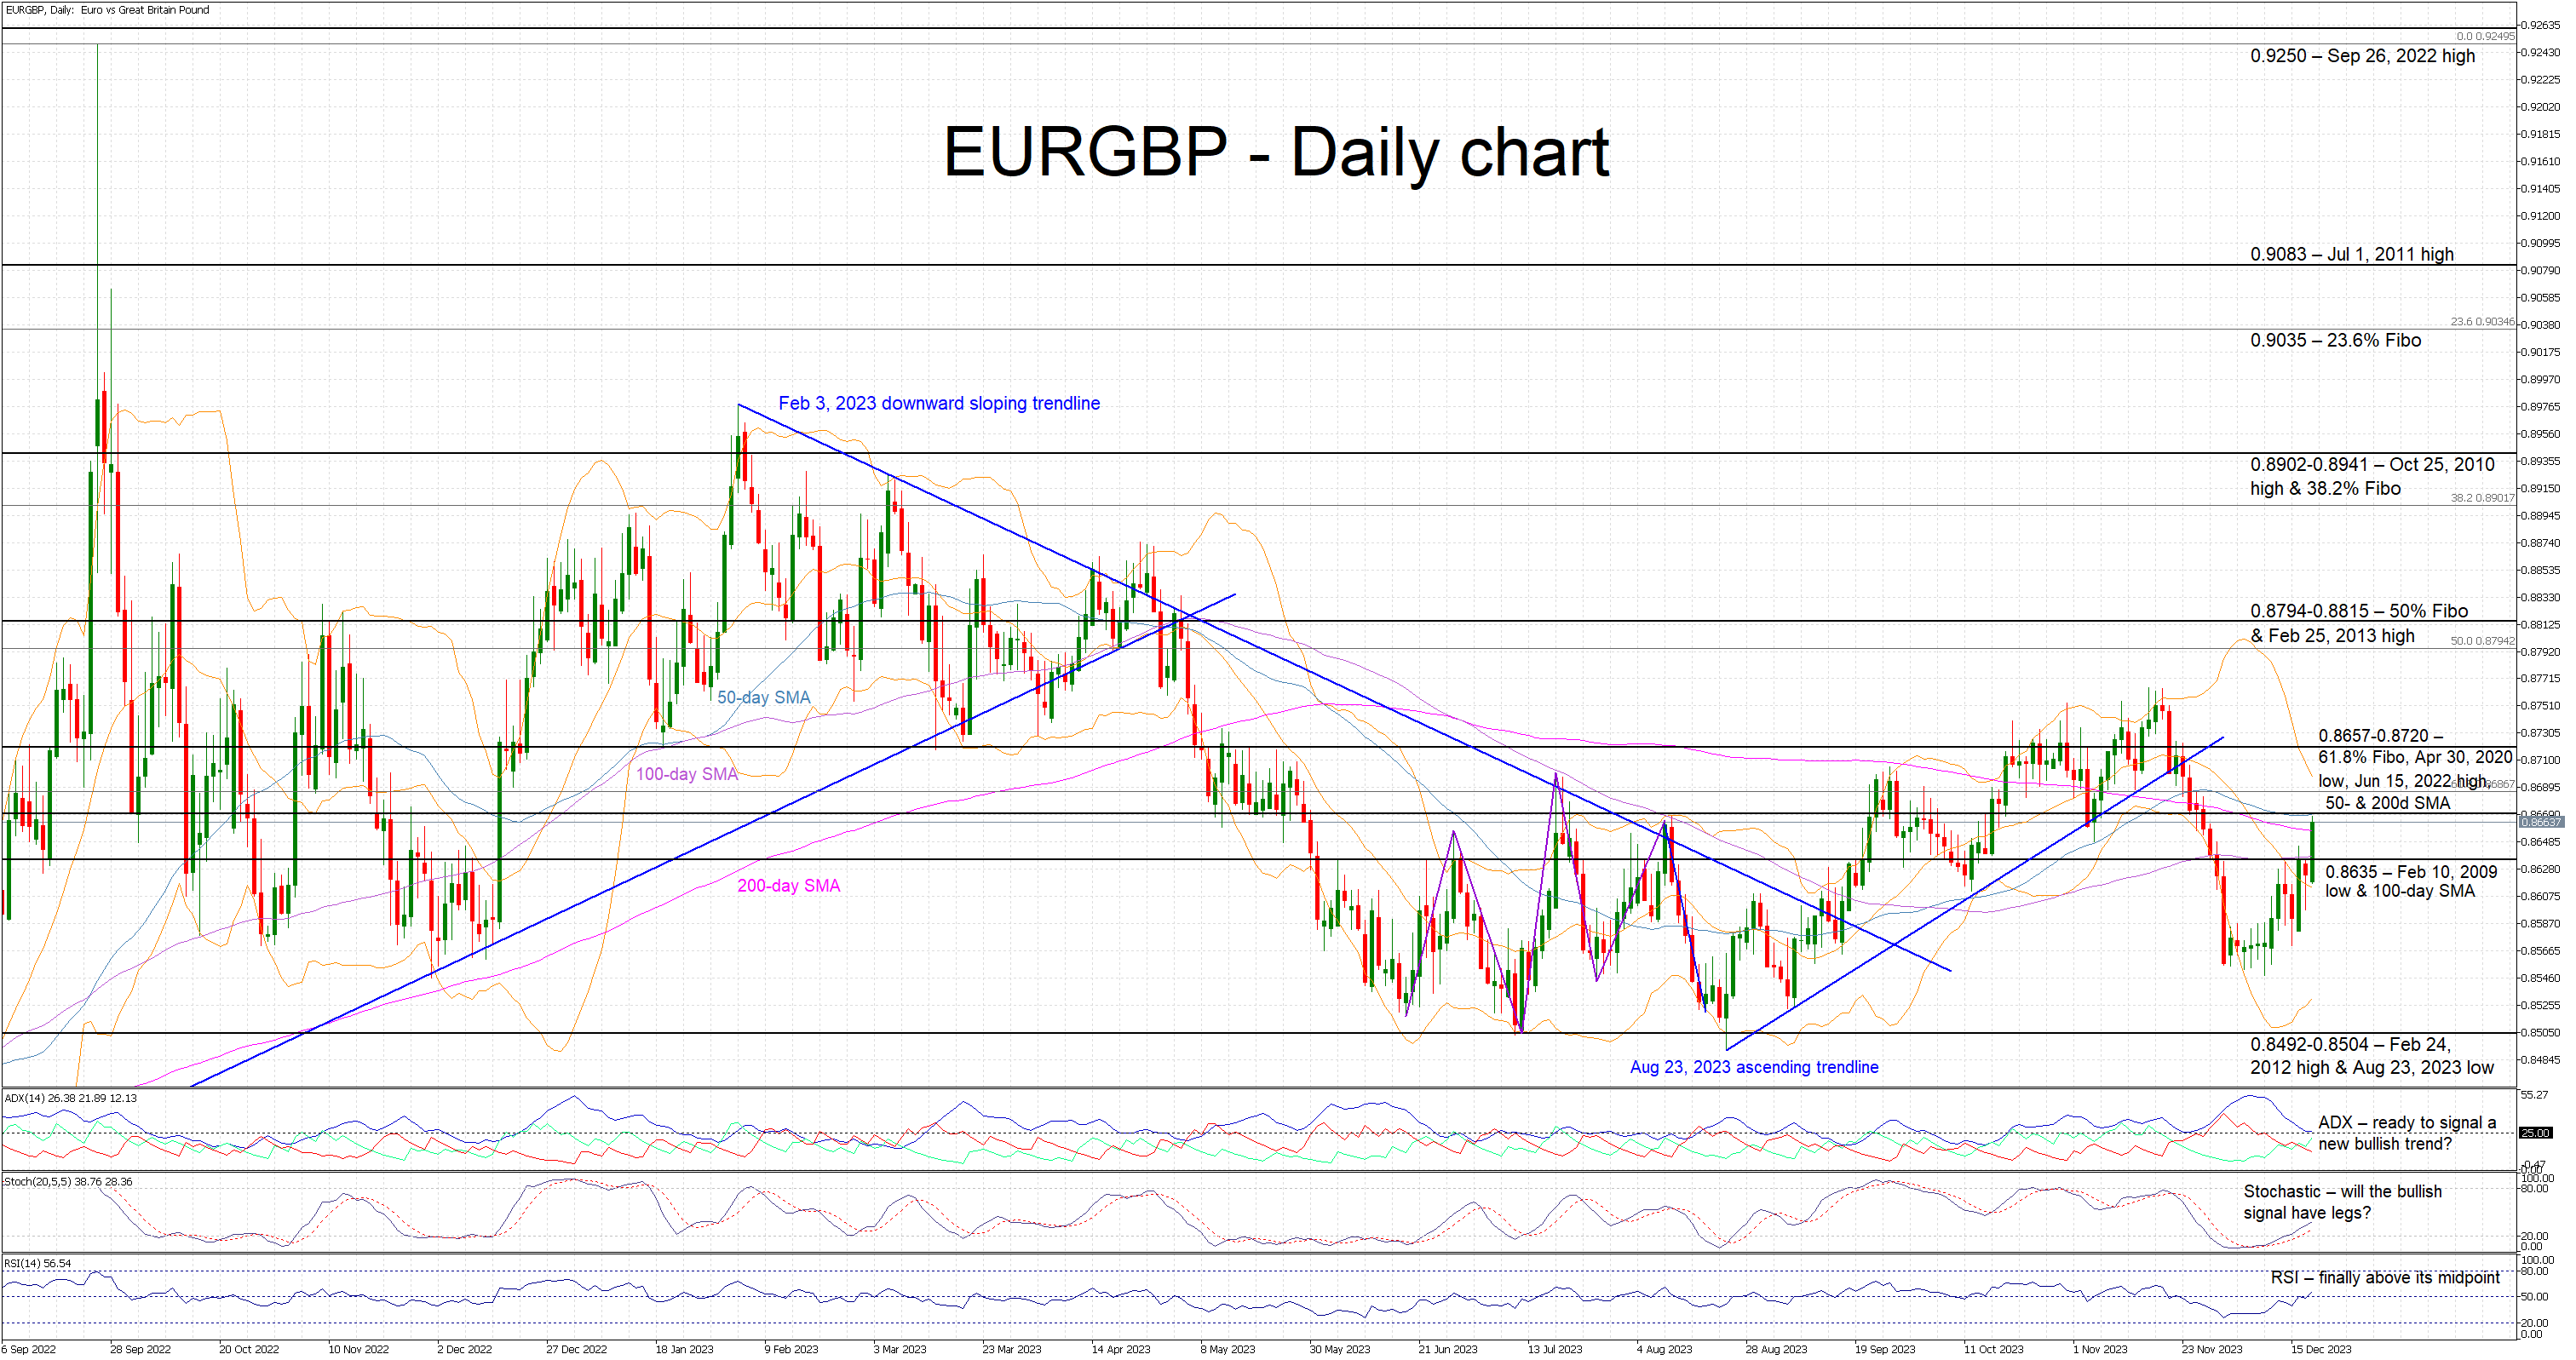
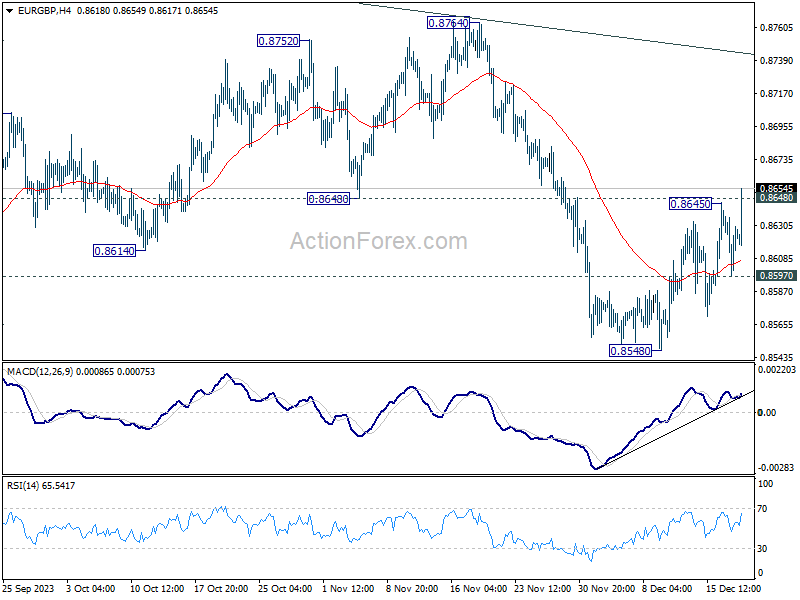
Could EURGBP Bulls Keep the Rebound Alive?
- EURGBP edges higher after weaker UK CPI
- Path higher filled with strong resistance points
- Momentum indicators are mostly bullish
EURGBP is trading higher today after the downside surprise registered by the UK inflation report. The 0.8635 level was easily surpassed with the EURGBP bulls now preparing to test the resistance set by the 0.8657-0.8720 area. They are just halfway to recovering the losses incurred during the November 20-December 1 correction.
In the meantime, the momentum indicators appear supportive of the current upleg. The Average Directional Movement Index (ADX) remains a tad above its 25-threshold, confirming the increasing bullish pressure in the market. Similarly, the RSI has finally managed to return back above its 50-midpoint. More importantly, the stochastic oscillator is edging higher, above its oversold territory, and building a good gap from its moving average.
Should the bulls feel confident, they could first try to push EURGBP above the very busy 0.8657-0.8720 area. This is populated by the 61.8% Fibonacci retracement of the August 4, 2022 – September 26, 2022 uptrend, the June 15, 2022 high and the 50- and 200-day simple moving averages (SMAs). If successful in overcoming this key region, the bulls could have the chance to stage a move above the recent peak of 0.8765 and record a new 7-month high.
On the flip side, the bears appear determined to defend the busy 0.8657-0.8720 area and protect their recent hard-earned gains. They could then try to push EURGBP back below the 0.8635 level defined by the February 10, 2009 low and the 100-day SMA. Even lower, the path appears to be unhindered until the 0.8492-0.8504 area.
To sum up, with some support from the momentum indicators, EURGBP bulls are trying to keep the current upleg intact. However, their true drive could be tested at the busy 0.8657-0.8720 area.
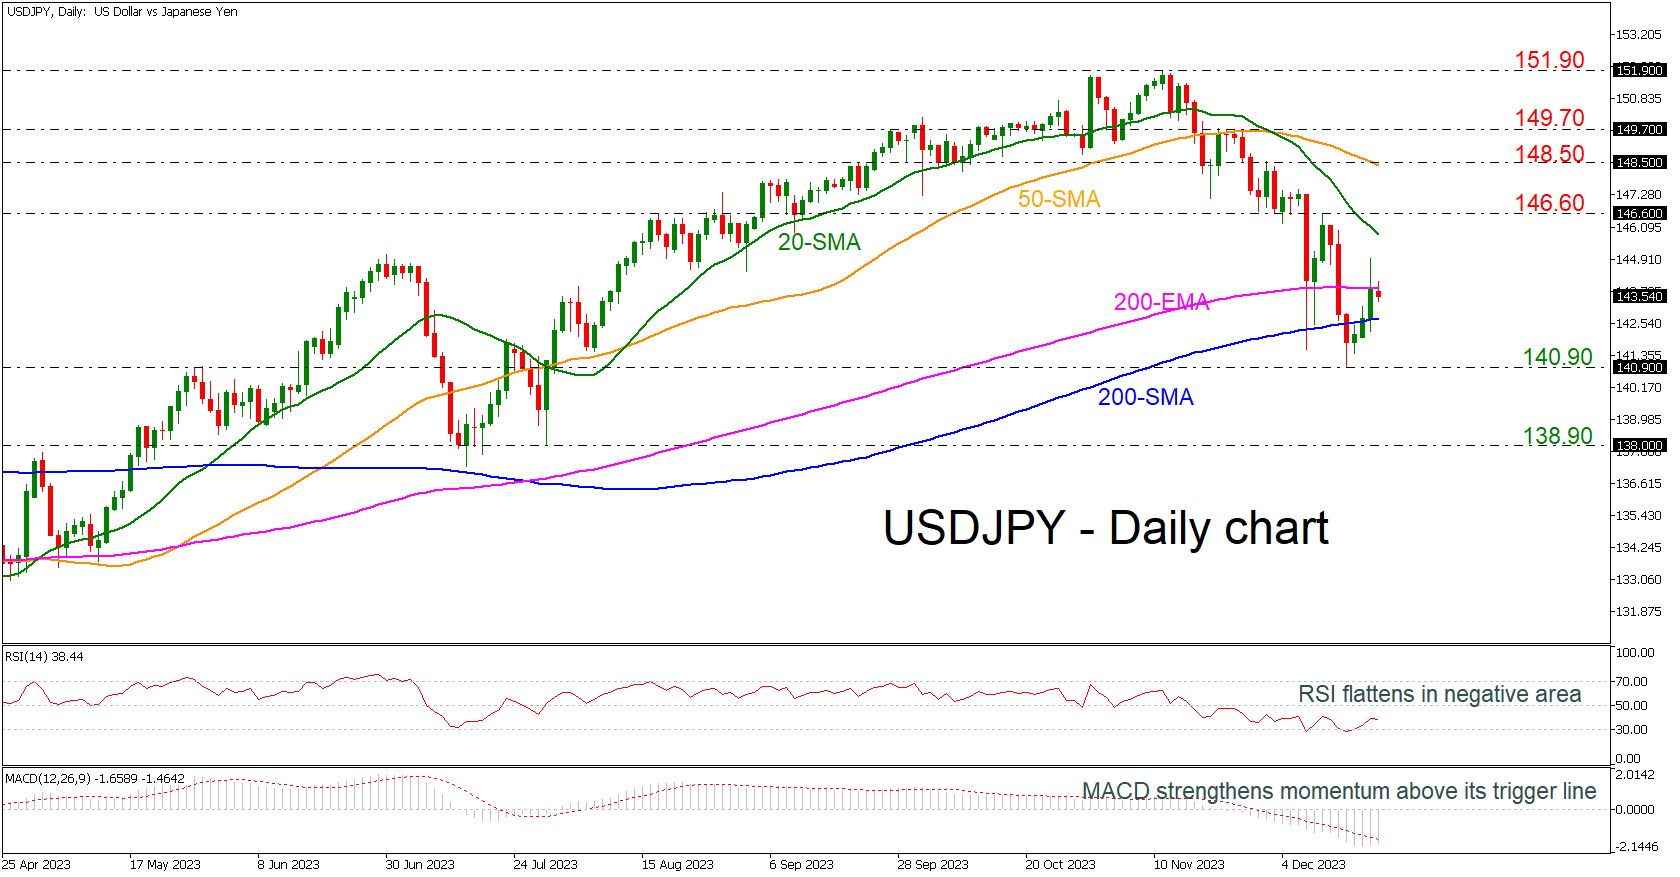
USDJPY Holds Within Key Lines
- USDJPY rebounds off 140.90
- Momentum indicators suggest more gains in the near term
USDJPY stormed higher after penetrating the 200-day simple moving average (SMA) but found strong resistance at the 200-day exponential moving average (EMA), recouping some of last week’s losses. The RSI indicator bounced off the 30 level but is flattening, while the MACD is moving higher after the slip beneath its trigger line.
If the bullish pressures persist, the price could revisit the 20-day SMA at 146.15 and the 146.60 barricade. Breaking above this area, the pair may face the 148.50 resistance, which overlaps with the 50-day SMA. A jump above that region could pave the way for 149.70.
Alternatively, should the bears attempt to push the price lower, initial declines could cease at the recent support lines of 200-day EMA at 143.80 ahead of the 200-day SMA at 142.60. Diving below these levels, the price may descend towards the 140.90 bottom.
In brief, USDJPY is in negative mode in the near-term after the pullback from 151.90 but in the very short-term timeframe is gaining some momentum. However, the odds are in favour of a bullish breakout as the MACD is strengthening in their negative territories.
UK Inflation Falls Faster Than expected
Isn’t it amazing how investors ignore the hawkish Federal Reserve (Fed) comments but fully embrace the dovish commentaries.
Fed’s Thomas Barkin’s words that suggested that the Fed could cut rates if recent progress inflation continues sent the Nasdaq 100 to a fresh record for the 3rd consecutive day and the S&P500 to a fresh ytd high and near an ATH record as well. Yet all the other central bankers’ warnings that it could be too early to cut rates didn’t see the same enthusiastic reaction. But the trend is your friend, the doves are your friends, the hawks are not your friends and that’s – I guess - the magic ingredient to ensure a Santa rally.
Yet, there is no rational explanation to this asymmetric market reaction given that the latest USeconomic data points at ongoing strength, and the latter should be, in theory, supportive of the Fed hawks.
Investors are dreaming of aggressive rate cuts in an environment of strong economic growth, and that is not the right recipe for easing inflation and keeping it sufficiently low. The robust economic data and high earnings expectations are not compatible with a dovish Fed.
FedEx rings the alarm bell
The latest FedEx results didn’t enchant investors yesterday. The company, which serves as a gauge of economic activity, missed expectations due to declining airfreight and trucking volumes. The stock price fell 7% after the closing bell. The selloff will likely send FedEx below its uptrending channel building since October – on the back of falling yields, but that negative correlation between the FedEx and the US 10-year yield is about to break, as FedEx, like most stocks, can’t continue to rise on the back of the falling yields: a further fall in yields implies a decent economic slowdown and that isn’t good for earnings, earnings expectations and hence the valuations.
Zooming out, the S&P stocks are now trading at nearly 20 times the 12-month earnings estimates, and the trailing 12-month EPS estimate is at a record. This is a valuable insight into the expectations regarding the overall earnings performance of the companies in the S&P500, and the numbers don’t look like an economy that needs looser financial conditions.
Dollar weakness
Released yesterday, the latest housing data in the US showed that housing starts jumped nearly 15% in November as the mortgage rates dipped from above 8% to below 7% thanks to a swift fall in US yields. That’s a good sign for economic health, but not necessarily for the future path of inflation. But the dollar didn’t react.
Another interesting place to see is the US deposits. The US deposits were around 80% at the peak of the pandemic and are now reverting toward pre-pandemic norm of around 60%. The melting excess savings could slow down the US consumer spending, hence temper the economic growth and tame inflation, but Atlanta Fed’s GDPNow points at a 2.7% growth in the US GDP in Q4. Thursday’s official data will remind that the US economy grew more than 5% in Q3, a number that should raise questions regarding the dovish Fed optimism.
The Fed doves’ optimism is overdone given the strength of the underlying economic data, and the upside pressure on energy and shipping costs as the world’s leading energy and shipping companies have started avoiding Suez Canal due to Houthi attacks. The recent developments will start showing in the economic data in a few weeks and help investors assess the extent of global implications.
Inflation falls
As worries regarding the implications of developments in the Red Sea mount, latest inflation numbers from Europe and Britain give some respite.
Inflation in the Eurozone slowed to 2.4% in November and core inflation fell to 3.6% as expected.
In the UK, both headline and core inflation fell faster than expected in November. Headline CPI slipped below the 4% mark, as core inflation eased to 5.1%. Cable slipped below 1.27 as a kneejerk reaction to the softer-than-expected inflation figures.
Yet in absolute terms, core inflation in Britain is still more than twice the BoE’s 2% inflation target. And even though the pace of easing is more than welcome, the Bank of England (BoE) is still last in line to join the pivot party. Therefore, hawkish BoE expectations should limit the pond selloff if, of course, investors continue to divest from the US dollar on the back of softening Fed expectations.
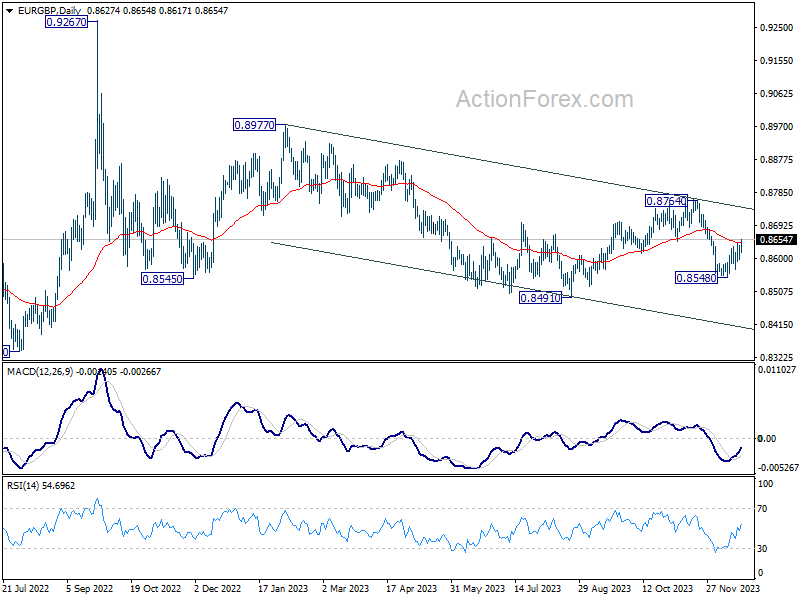
EUR/GBP Daily Outlook
Daily Pivots: (S1) 0.8602; (P) 0.8621; (R1) 0.8644; More....
EUR/GBP's rise from 0.8548 resumes today and the break of 0.8648 support turned resistance argues that fall from 0.8764 might have completed already. Intraday bias is now on the upside for stronger rebound towards 0.8764 resistance. On the downside, though, break of 0.8597 minor support will bring retest of 0.8548 instead.
In the bigger picture, current development suggests that down trend from 0.9267 (2022 high) is still in progress. This decline is seen as the third leg of the pattern from 0.9499 (2020 high). Break of 0.8201 will target 100% projection of 0.9499 to 0.8201 from 0.9267 at 0.7969. In any case, outlook will stay bearish as long as 0.8764 resistance holds.
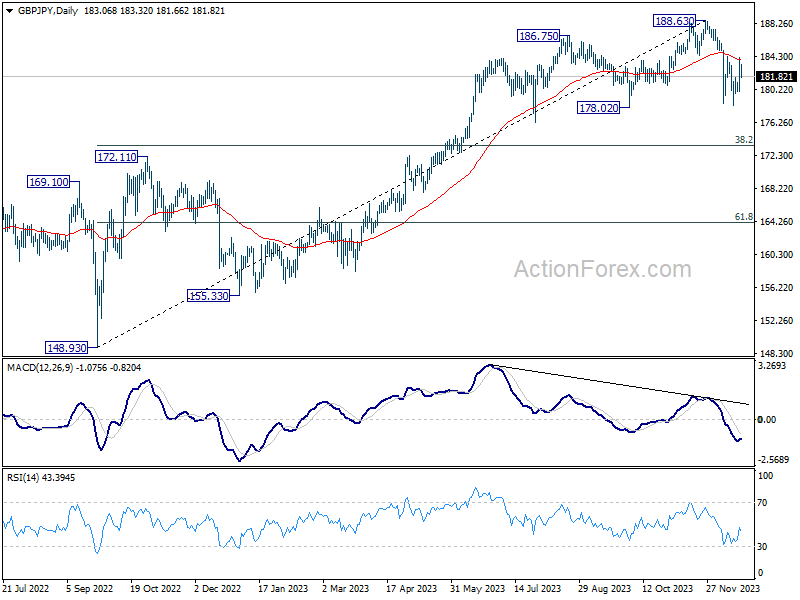
GBP/JPY Daily Outlook
Daily Pivots: (S1) 180.73; (P) 182.46; (R1) 184.86; More...
GBP/JPY retreats sharply ahead of 184.30 resistance and intraday bias remains neutral first. Fall from 188.63 is still in favor to continue. Break of 178.32 will resume the decline and target 38.2% retracement of 148.93 to 188.63 at 173.46. However, decisive break of 184.30 will argue that pull back from 188.63 has completed and bring retest of this high.
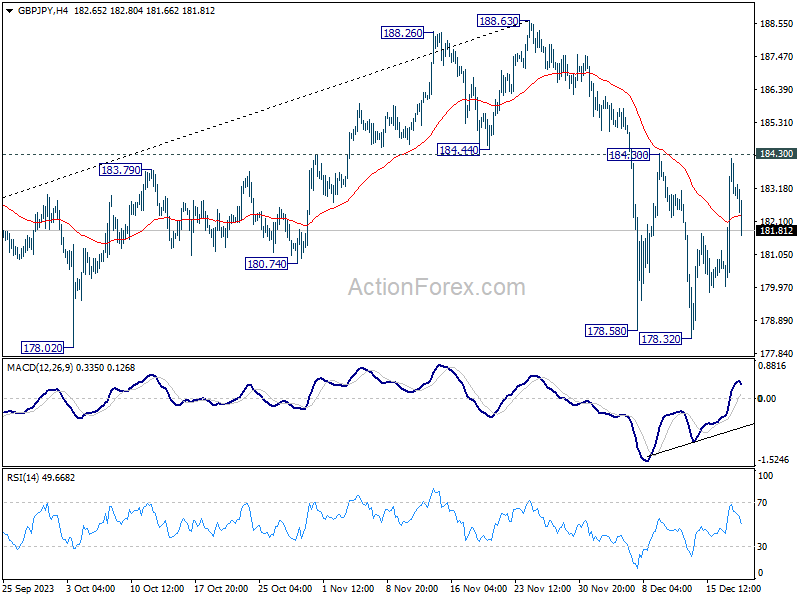
In the bigger picture, price actions from 188.63 medium term top are currently seen as a correction to the up trend from 148.93 (2022 low) only. As long as 172.11 resistance turned support holds, larger up trend from 123.94 (2020 low) is still in favor to resume through 188.63 at a later stage.
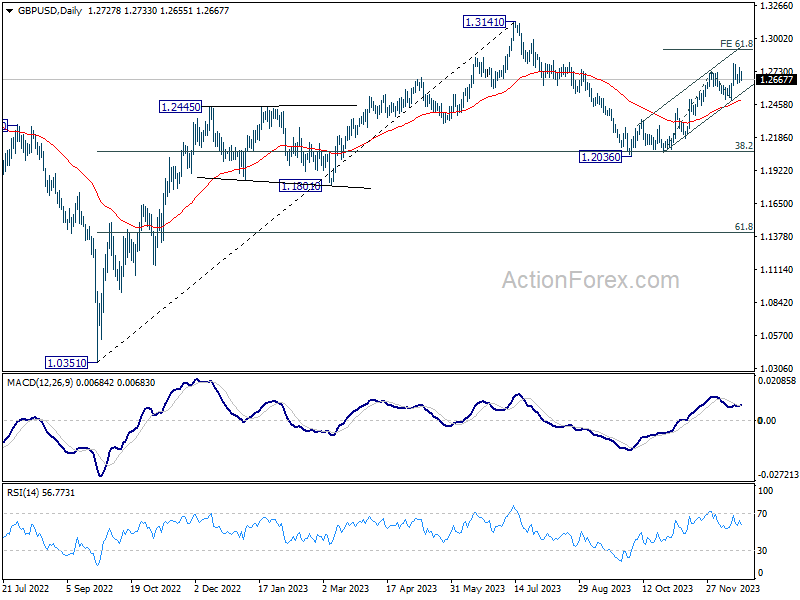
GBP/USD Daily Outlook
Daily Pivots: (S1) 1.2661; (P) 1.2711; (R1) 1.2782; More...
Intraday bias in GBP/USD remains neutral as consolidation from 1.2793 is still extend. Overall, further rally is expected as long as 1.2499 support holds. On the upside, firm break of 1.2793 will resume the rally from 1.2036. Next target is 61.8% projection of 1.2068 to 1.2731 from 1.2499 at 1.2909.
In the bigger picture, price actions from 1.3141 medium term top are seen as a corrective pattern to rise from 1.0351 (2022 low). Rise from 1.2036 is seen as the second leg that's in progress. Upside should be limited by 1.3141 to bring the third leg of the pattern. Meanwhile, break of 1.2499 support will argue that the third leg has already started for 38.2% retracement of 1.0351 (2022 low) to 1.3141 at 1.2075 again.
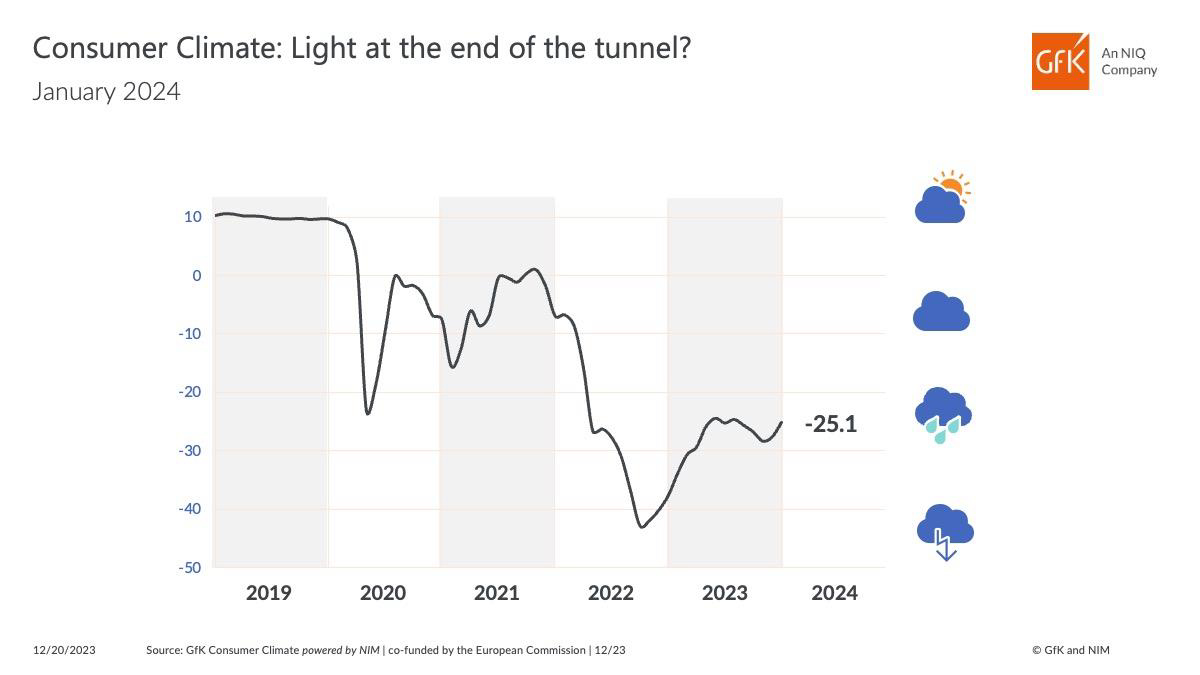
Germany’s Gfk consumer climate rises to -25.1, consumers still have major worries
Germany's Gfk Consumer Climate for January rose from -27.6 to -25.1. In December, income expectations rose from -16.7 to -6.9. Willingness to buy rose from -15.0 to -8.8. Willingness to save rose from 5.3 to 7.3.
"It remains to be seen whether the current increase represents the start of a sustained recovery in consumer sentiment," explains Rolf Bürkl, consumer expert at NIM.
"Consumers still have major worries. Geopolitical crises and wars, sharply rising food prices and discussions around national budget for 2024 continue to cause uncertainty. As a result, the level of consumer sentiment is currently still very low."